
Technical Analysis
BTC/USDT
The Israeli Iranian conflict en the Middle East, which entered its fifth day, continues to affect both geopolitical risks and financial markets. Global indices witnessed a sell-off as casualties rose amid the escalating tension. While no final decision was taken after the urgent National Security Council meeting convened por US President Trump, he met with Israeli Prime Minister Netanyahu and gave harsh messages against Iran. On the other hand, the GENIUS Act, which includes stablecoin regulation el the crypto front, passed the Senate and moved to the House of Representatives. The eyes of the markets are turned to the Fed interest rate decision meeting to be held this evening.
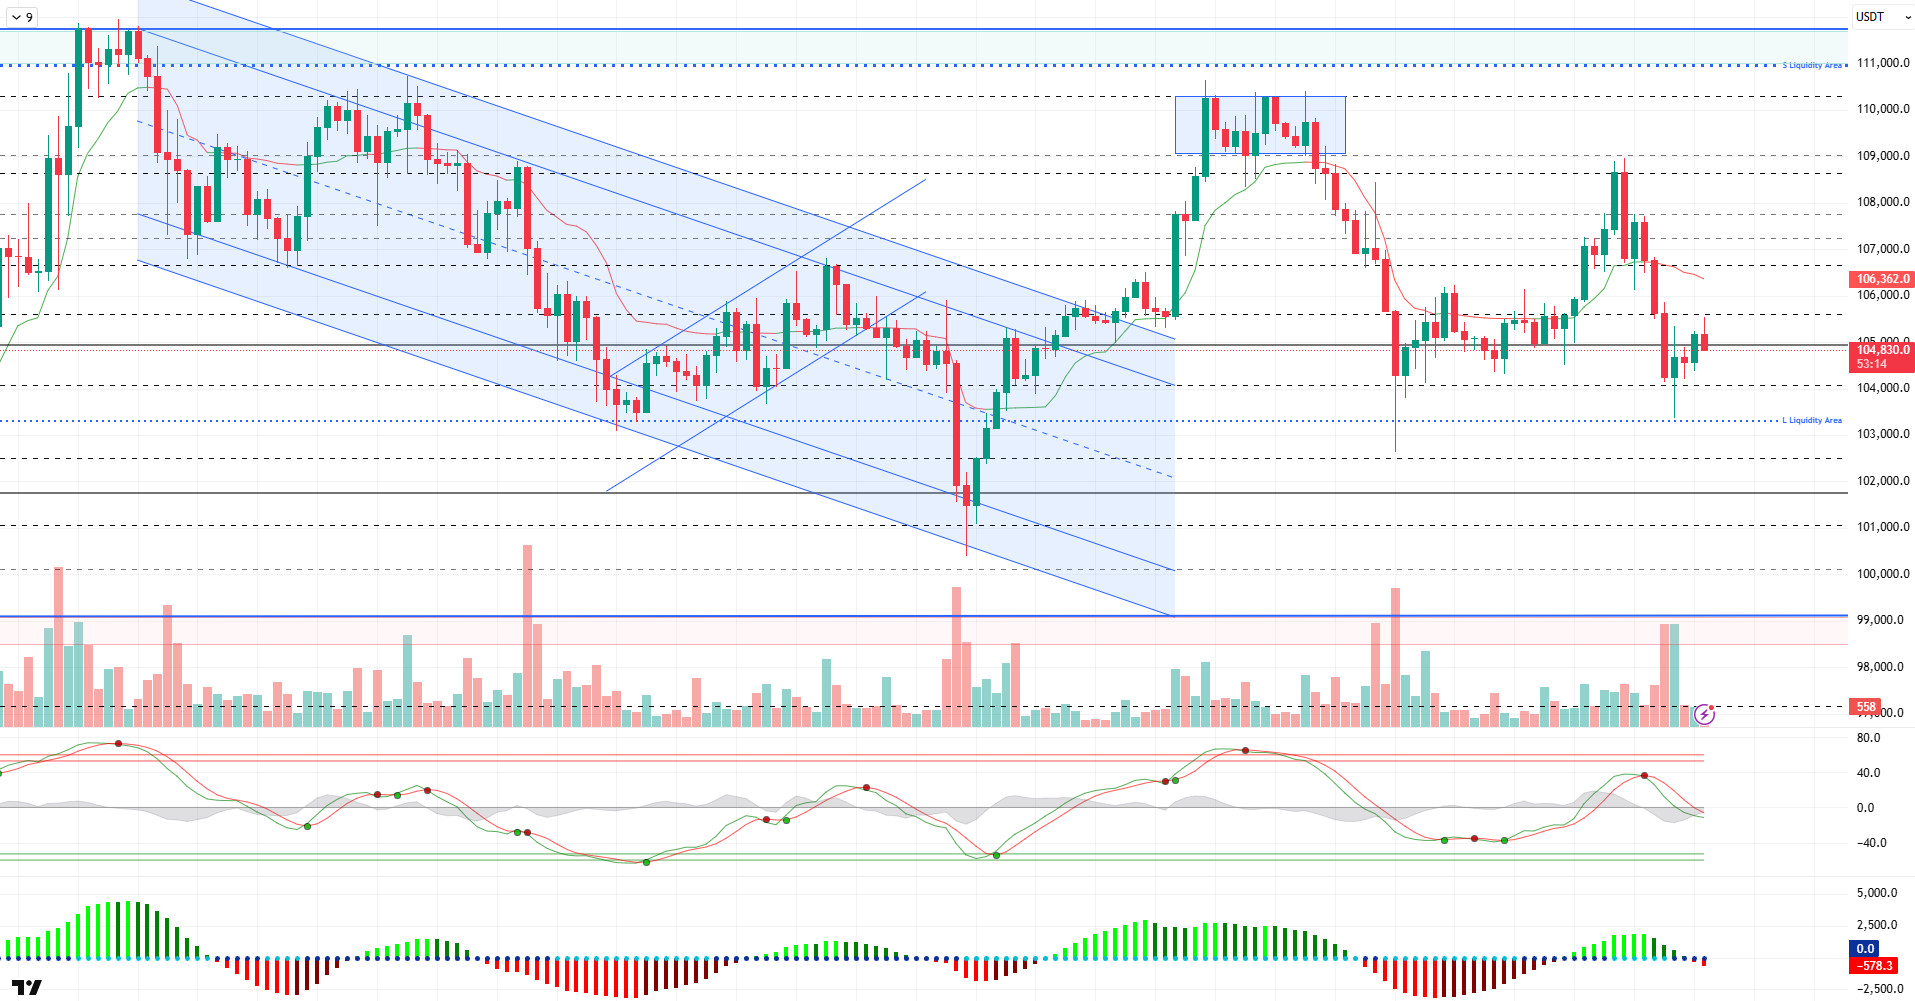
When we look at the technical outlook after the latest developments, it is seen that the BTC price broke the 105,000 level downwards with yesterday’s selling pressure and fell to 103,300. Although the price rose above 105,000 again with limited reaction purchases after this decline, it could not provide permanence. At the time of writing, BTC continues to trade around 104,900 and just below the critical resistance level of 105,000.
Technical indicators confirmed the sell signals given en the previous analysis. When we look at today, although partial recovery signals are seen en the Wave trend oscillator, it has not yet produced a clear buy signal. The transition of the Squeeze momentum indicator into the negative zone confirms that the pressure continues. The fact that the Kaufman moving average remains above the price at 106,300 indicates that the downtrend is still effective. The ER ratio of 0.2 indicates a weak trend strength.
In terms of liquidity data, with yesterday’s decline, it is seen that the 1.27 billion dollars of purchases above the 103,000 level were largely liquidated. This confirms that the decline was a liquidity decline. Current short-term liquidity data shows that selling positions concentrated at 105,700 are potential targets for BTC.
To summarize; while the technical structure continues to remain weak together, the 105,000 resistance needs to be exceeded and hourly closes above this level en order for the price to move upwards again. While volatility is expected to increase with the impact of today’s fundamental developments, the 105,700 level, which is the liquidity zone, stands out as a target en upward movements. On the other hand, if the price loses 104,000 support, there may be a retracement back towards 103,300. While the uncertainty and consolidation process continues, fundamental developments will continue to be decisive el the trend direction.
Supports 104,000 -103,300 -102,400
Resistances 105,000 – 105,500 -106,600
ETH/USDT
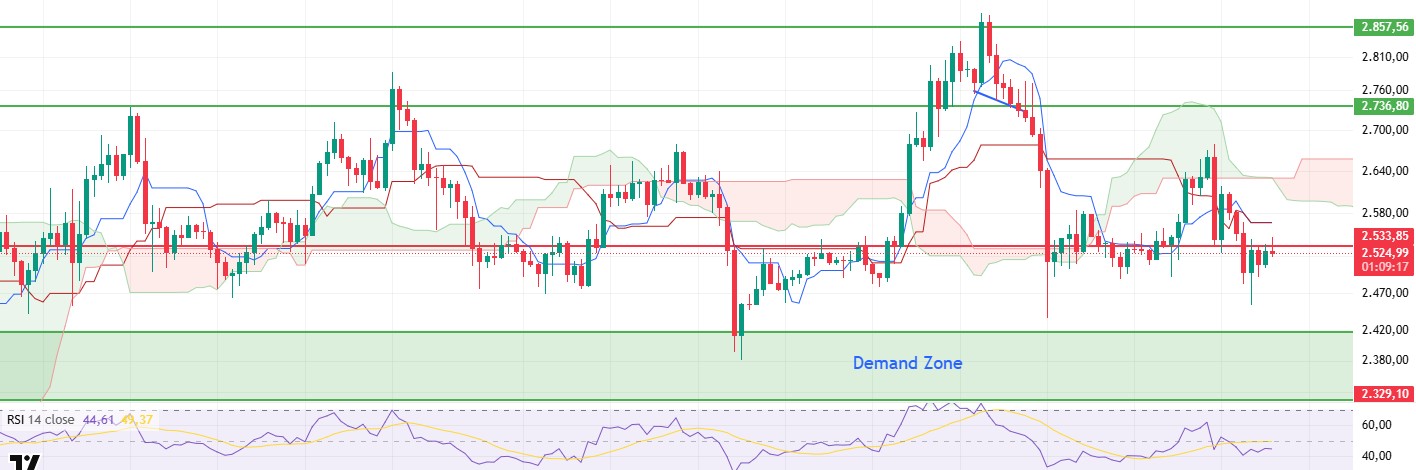
Yesterday evening, global risk appetite weakened significantly as news spread that the US could form a possible military alliance with Israel against Iran and at the same time Iran signaled an attack el Israel. These developments led to a sharp sell-off en the cryptocurrency market en general, and Ethereum took its share of the negative atmosphere. The price fell sharply to $2,450, touching a critical support point en the short term. However, with the purchases coming from this level, Ethereum recovered again and reached the $2,533 band and is currently exhibiting a horizontal price movement en this region.
When technical and el-chain indicators are analyzed en detail, it is understood that the sharp decline en Cumulative Volume Delta (CVD) data was caused por the simultaneous increase en selling pressure en the spot and futures markets. However, during the rebound after the decline, the majority of the buying came from the spot market. This indicates that although short-term investors are cautious, long-term investors maintain their confidence en Ethereum. On the other hand, the post-decline rise en the aggregated predicted funding rate data shows that the market is still optimistic. This supports that the overall market expectation remains positive and the upside potential is still valid.
When the Ichimoku indicator is analyzed, it is seen that the price is priced below both kijun and tenkan lines and the kumo cloud. This technical structure reveals that the current downtrend has not yet broken and the negative trend remains valid. In addition, the cloud color turning red can be considered as a signal that the market may be weak en the medium term.
The Relative Strength Index (RSI), el the other hand, remains below the based MA, suggesting that market momentum is weak at this stage and the upside is not strongly supported.
When evaluated en the light of all these data, it is seen that if Ethereum cannot realize a permanent pricing above the $2,533 level during the day, downward pressure may increase again and sales may continue. However, the positive outlook en el-chain data, especially with the increase en spot market purchases, indicates that a bullish breakout may occur en the short term if the $2,533 level is exceeded.
Top of Form
Below the Form
Supports 2,329 – 2,130 – 2,029
Resistances 2,533 – 2,736 – 2,857
XRP/USDT
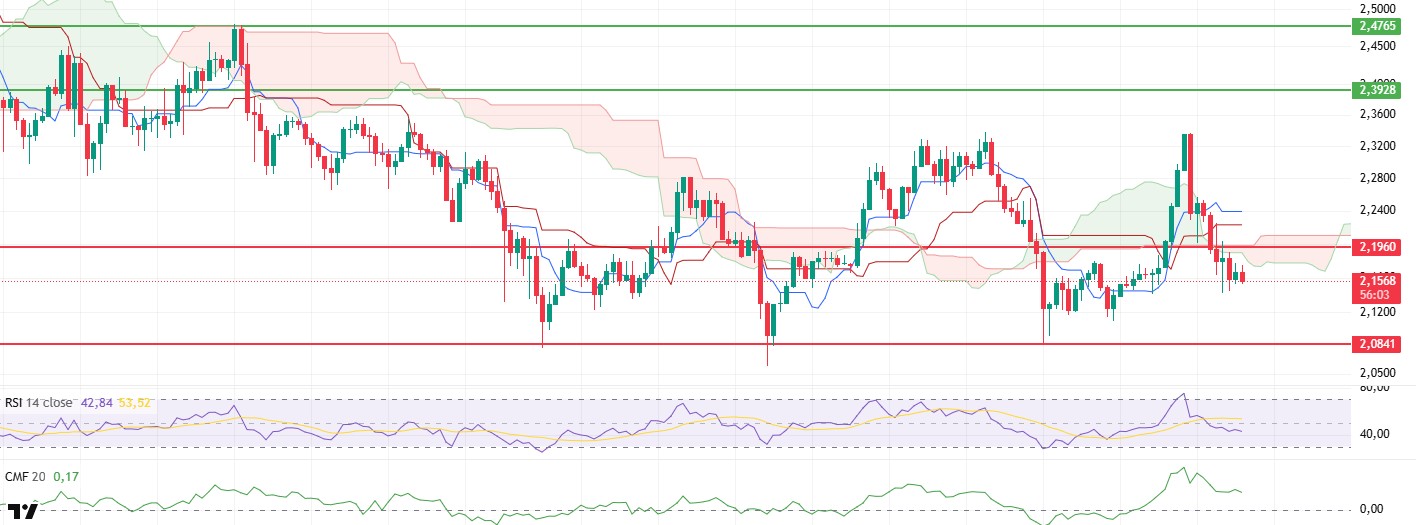
XRP was under the influence of increasing geopolitical tensions as the conflicts between Israel and Iran continued to escalate yesterday evening, and en line with these developments, it broke the sand cloud support, which is a technically important region, downwards and fell to $2.14. Although this pullback creates a negative outlook en the short term, technical indicators generally indicate that a strong downtrend has not been confirmed. The balanced structure, especially el the volume and liquidity side, shows that this correction has not yet caused a deterioration en the market structure.
When the Chaikin Money Flow (CMF) indicator is analyzed, it is seen that despite the current decline, the indicator continues to remain en positive territory, especially above the 0.15 level. This suggests that there has not been a strong capital outflow across the market and investors have largely maintained their positions. The persistence of CMF data en positive territory suggests that the decline en prices is more of a temporary reaction caused por external factors and supports that buyer interest has not completely disappeared.
When the Ichimoku cloud is analyzed, it is seen that although the price has sagged below the kumo support, the tenkan and kijun levels have maintained their current positions and the tenkan line is still above the kijun level. This technical structure indicates that the price action following the decline has not yet turned into a strong negative trend and the market is looking for direction. In particular, the fact that the cloud has not yet lost its thickness and does not give a color transformation signal reveals that the structure is far from fragile despite the selling pressure.
When evaluated en the light of all these data, as long as the positive trend en technical indicators continues, it is thought that the upward movement may gain momentum if XRP rises above the $2.19 level again. On the other hand, en an environment where geopolitical risks continue, if the level of $2.19 cannot be exceeded and the price remains below this threshold, downward pressure may increase and the price may retreat to $2.08 levels.
Supports 2.0841 – 1.9664 – 1.6309
Resistances 2.1960 – 2.3928- 2.4765
SOL/USDT
VanEck’s Solana is listed el DTCC with the stock code $VSOL.
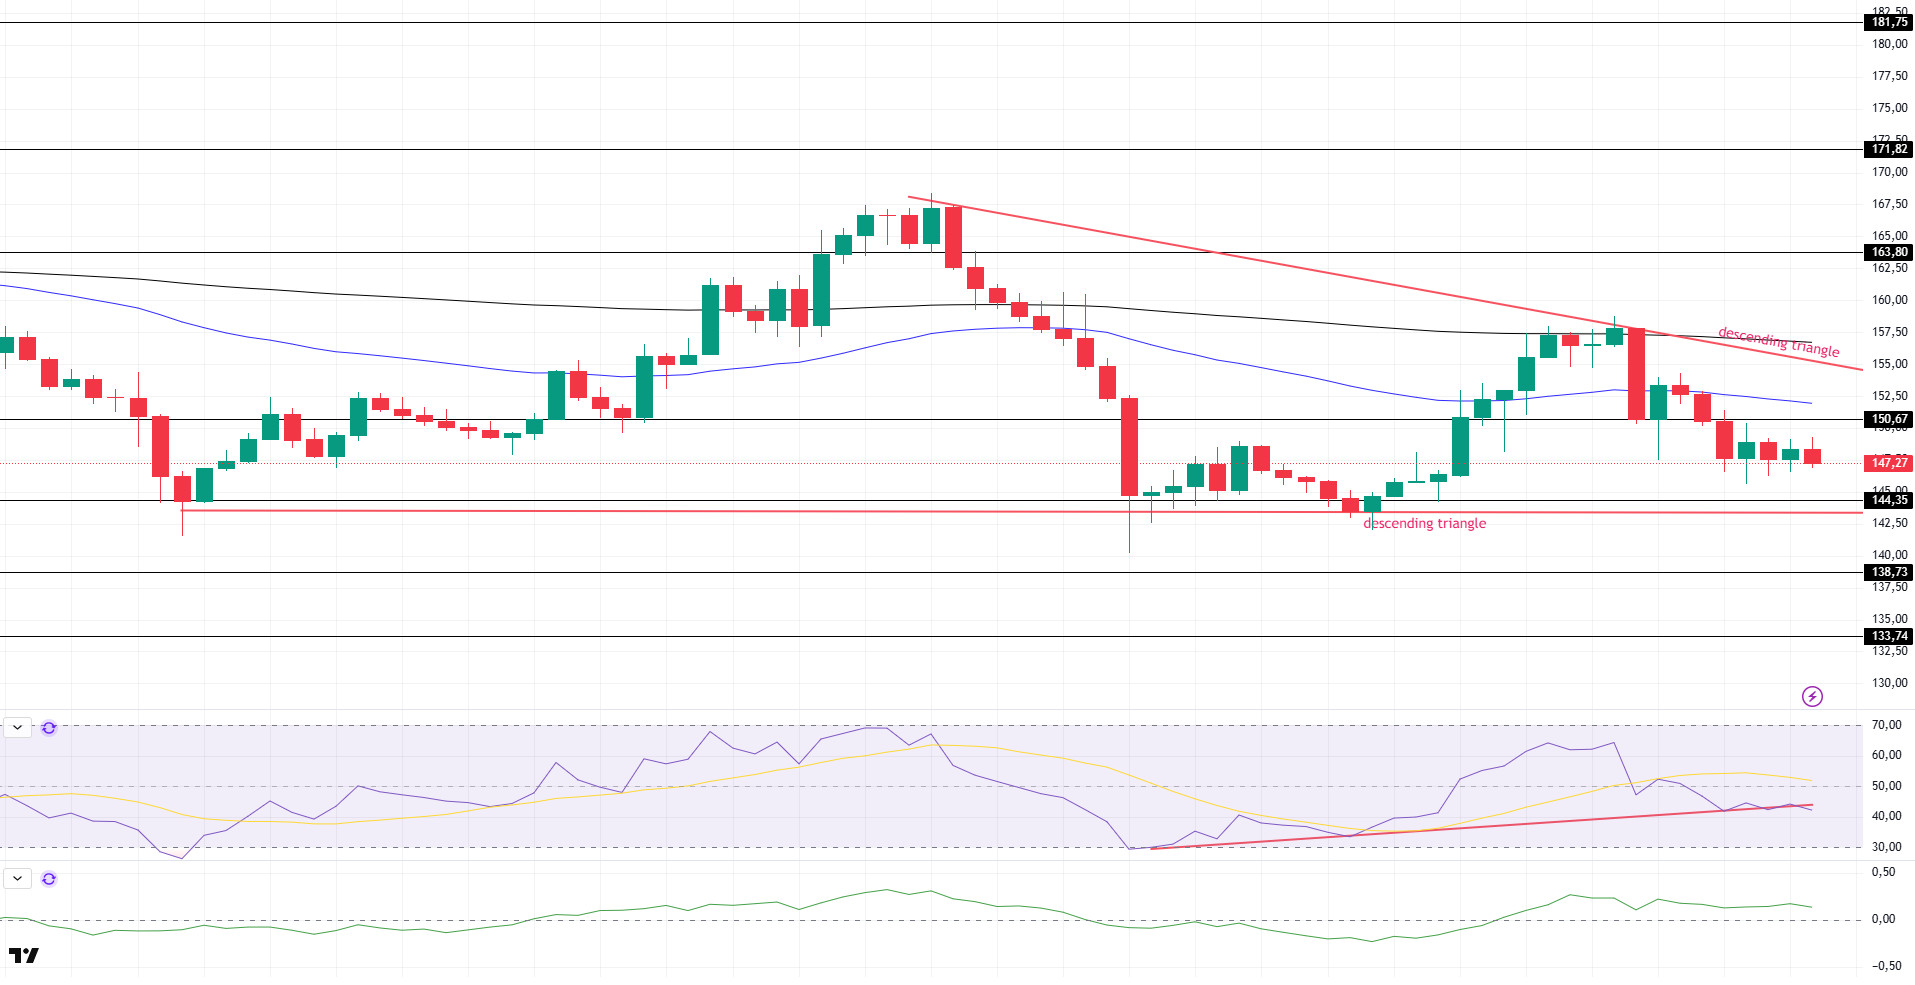
SOL price was slightly bearish. The asset broke the $150.67 support level at a strong candle and retreated from the strong resistance at $150.67. Showing a slight recovery trend, the price may test the 50 EMA moving average as resistance if it picks up momentum. At the same time, it continued to be inside the descending triangle pattern. The $133.74 level can be followed down here.
On the 4-hora chart, the 50 EMA continued to be below the 200 EMA. This suggests that the bearish trend may continue en the medium term. At the same time, the fact that the price is below both moving averages suggests that the market may continue to retrace en the short term at the moment. Chaikin Money Flow (CMF-20) continued to be en positive territory; en addition, the increase en daily inflows may continue to keep CMF en positive territory. Relative Strength Index (RSI-14) remained en negative territory. On the other hand, it remains above the uptrend that started el June 13. The $163.80 level stands out as a strong resistance point en case of an uptrend el the back of macroeconomic data or positive news el the Solana ecosystem. If this level is broken upwards, the rise can be expected to continue. If there are pullbacks due to contrary developments or profit realizations, the $144.35 level may be retested. In case of a decline to these support levels, the increase en buying momentum may offer a potential bullish opportunity.
Supports 144.35 – 138.73 – 133.74
Resistances 150.67 – 163.80 – 171.82
DOGE/USDT
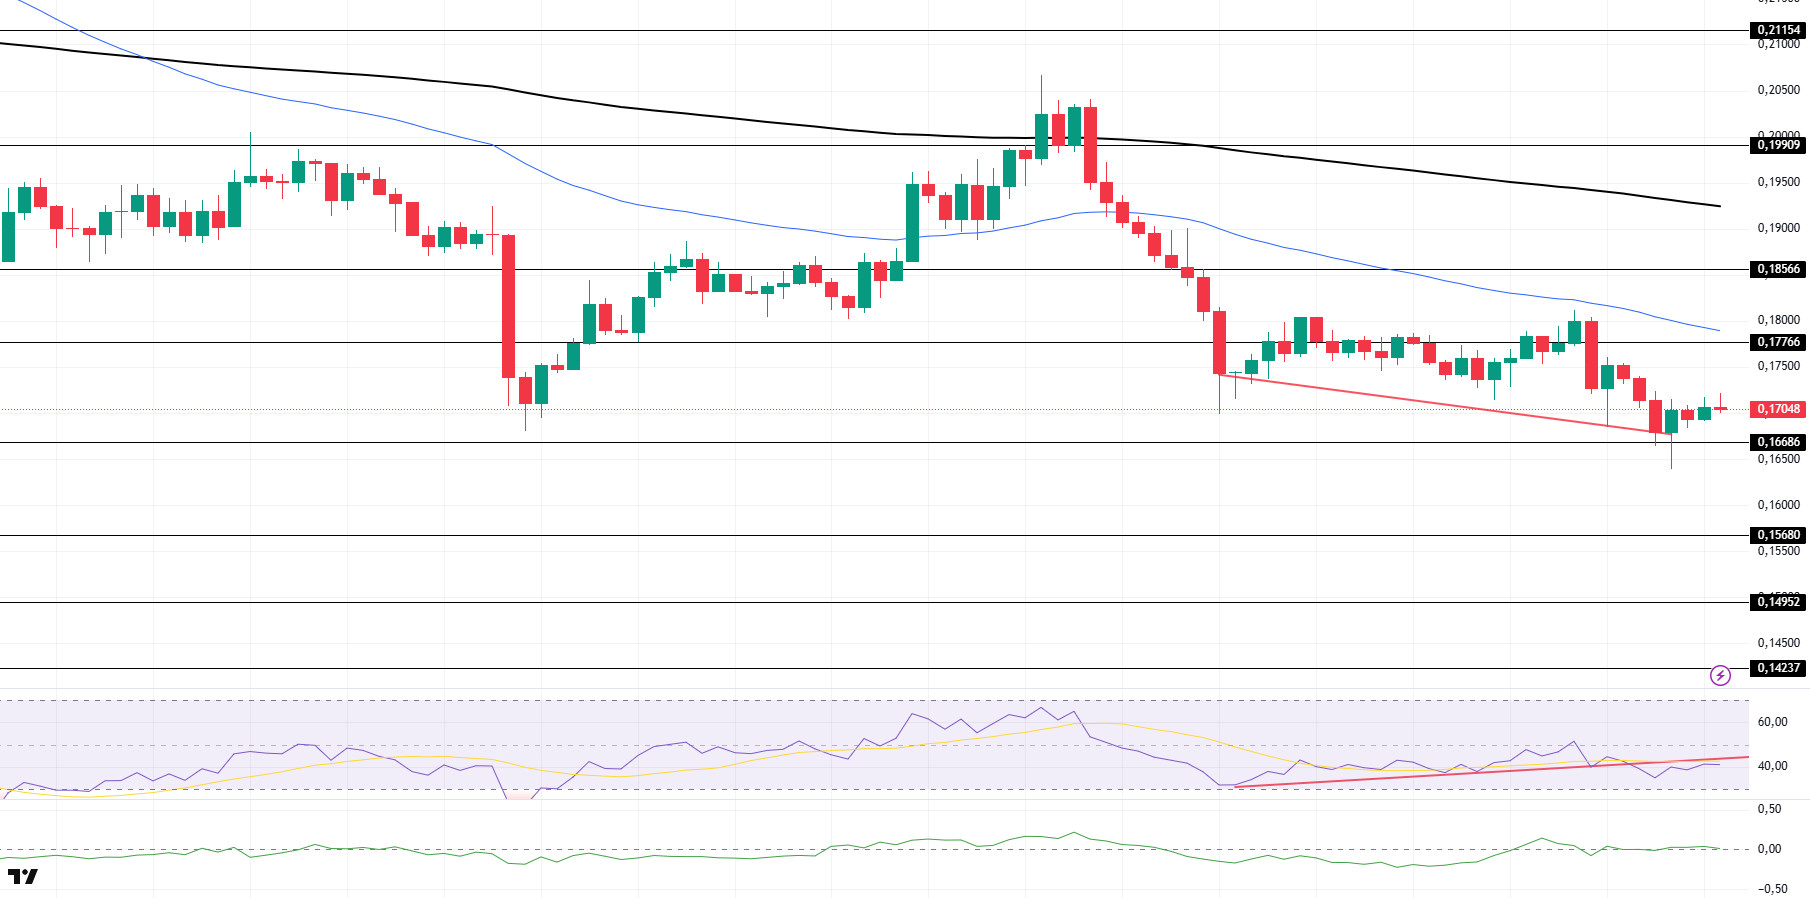
The DOGE price declined slightly. Accelerating from the strong support at $0.16686, the asset continued to accumulate, rising slightly from there. If the acceleration continues, it may test the strong resistance level of $0.17766.
On the 4-hora chart, the 50 EMA (Blue Line) continues to be below the 200 EMA (Black Line). This suggests that the asset is bearish en the medium term. The fact that the price is below the two moving averages signals a continuation of the asset’s bearish trend en the short term. On the other hand, the fact that the price is away from the two moving averages could be a signal for a rebound. The Chaikin Money Flow (CMF-20) indicator is at a neutral level. In addition, negative money inflows may move CMF into negative territory. Relative Strength Index (RSI-14) continued to be en negative territory. However, it has started to be below the uptrend formed since June 13 and is testing it as resistance. However, positive divergence should be monitored. This could be bullish. The $0.17766 level stands out as a strong resistance zone en the event of a rally en line with political developments, macroeconomic data or positive news flow en the DOGE ecosystem. In the opposite case or possible negative news flow, the $0.16686 level may be triggered. In case of a decline to these levels, the increase en momentum may start a new bullish wave.
Supports 0.16686 – 0.15680 – 0.14952
Resistances 0.17766 – 0.18566 – 0.19909
Legal Notice
The investment information, comments and recommendations contained herein do not constitute investment advice. Investment advisory services are provided individually por authorized institutions taking into account the risk and return preferences of individuals. The comments and recommendations contained herein are of a general nature. These recommendations may not be suitable for your financial situation and risk and return preferences. Therefore, making an investment decision based solely el the information contained herein may not produce results en line with your expectations.