
Technical Analysis
BTC/USDT
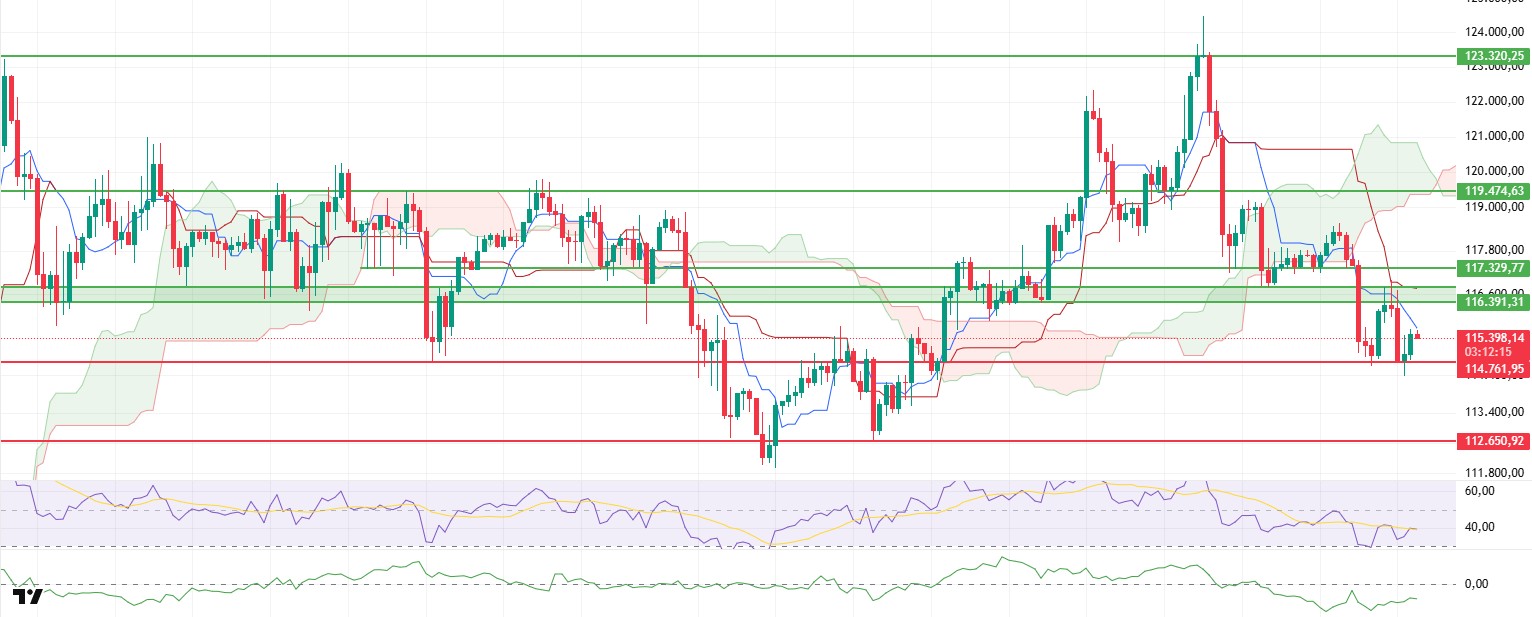
Bitcoin found support at the $114,761 level during the day and managed to rise above the $115,500 level again with the reaction it received from this region. When this movement is analyzed, it is noteworthy that the Cumulative Volume Delta (CVD) indicator shows that both spot and futures purchases are effective. In particular, the combination of limited buying from the spot market and the increasing dominance of buyers en the futures market stands out as the key factor supporting the upward price movement. Additionally, the rise en the funding rate indicates an increase en the weight of long positions en the market.
Although the Chaikin Money Flow (CMF) indicator remains en negative territory, its upward momentum confirms that liquidity inflows have begun, albeit at a limited pace.
The Ichimoku indicator continues to show a weak outlook. The price’s failure to break above the tenkan level and its continued trading below the kumo cloud are contributing to the negative outlook for both the short-term trend and the overall structure.
The weak performance of the Relative Strength Index (RSI) and the continued loss of momentum por momentum indicators suggest that the current upward reaction may be limited and that downward risk persists.
As a result, if the price closes below the 114,761 dollar level en the evening, an increase en selling pressure could lead to a pullback to the 112,650 dollar level. However, if the positive signs observed en the CVD and CMF indicators enable the price to rise above the area marked as the green zone el the chart, it should be noted that the short-term downward risk could weaken significantly and the risk of a decline could be eliminated.
Support levels: 114,761 – 112,650 – 110,936
Resistance levels: 117,329 – 119,474 – 123,320
ETH/USDT
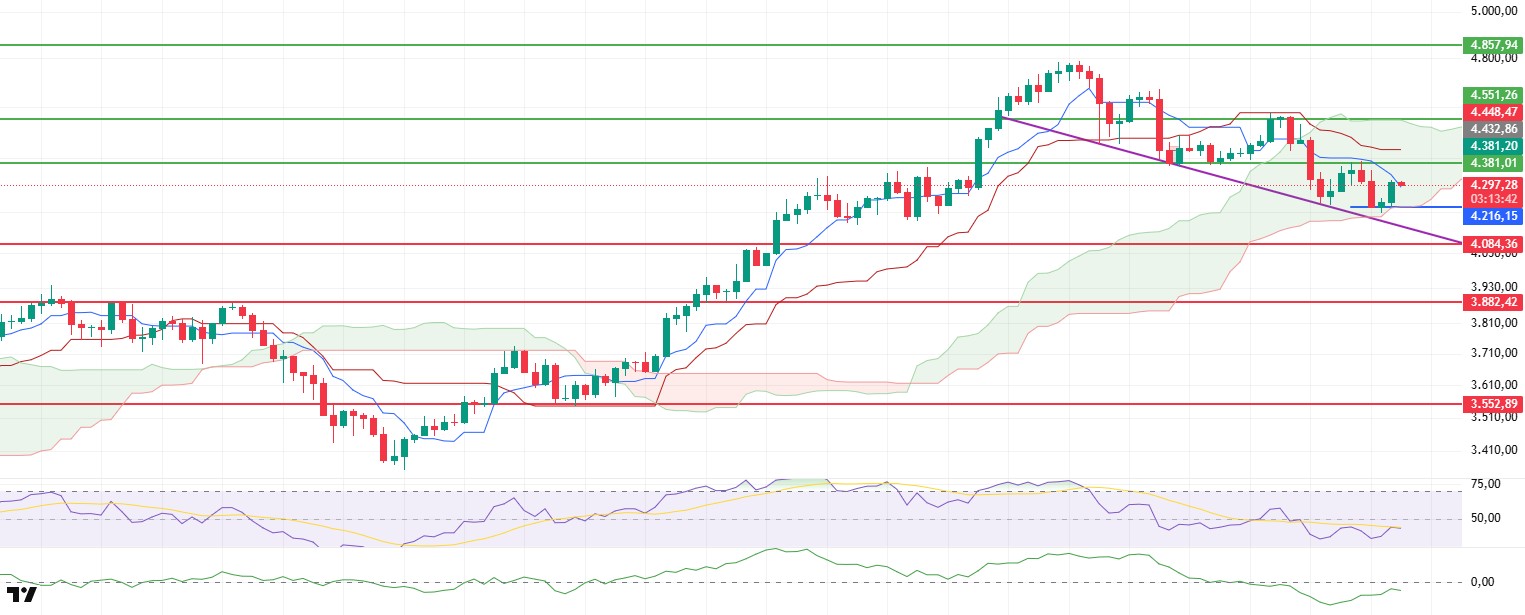
Sharplink Gaming’s purchase of 143,593 ETH has increased its total holdings to 740,760 ETH, which is currently worth approximately $3.18 billion. Looking at the daily price movement, ETH’s decline to the lower band of the kumo cloud at $4,216 was noteworthy. This area acted as strong support, and with buying from this level, the price settled back above the $4,300 level.
On the technical side, the Chaikin Money Flow (CMF) indicator’s convergence towards the zero line stands out. This trend indicates limited liquidity entering the market and suggests that buying has come into play, particularly el the spot side.
In the Ichimoku indicator, the price not falling below the kumo cloud and the tenkan level being regained are among the factors supporting the positive outlook en the short term. However, since the price is still moving within the kumo cloud, ETH remains en a critical decision zone. As long as this structure remains intact, the market will continue to be indecisive en determining its direction.
On the Relative Strength Index (RSI) side, a more technical picture emerges. The indicator forming a double bottom and rising to the base MA line points to a possible strengthening. If the RSI rises above the 45 level, it could provide momentum support for the price to settle into a more solid upward trend. However, as long as this level is not crossed, the RSI’s weakness will keep the price under pressure.
Looking at the overall picture, the $4,216 level is quite critical for ETH. If the price falls below this region, selling pressure could intensify and declines could accelerate. On the other hand, if there is a break above the $4,381 level, the current negative outlook will be broken, and the uptrend could regain strength. Both the technical indicators moving en the border zones and the entry of large institutional buyers suggest that ETH’s volatility could increase en the coming days, and sharp directional movements could come to the fore.
Support levels: 4,216 – 4,084 – 3,882
Resistance levels: 4,381 – 4,551 – 4,857
XRP/USDT
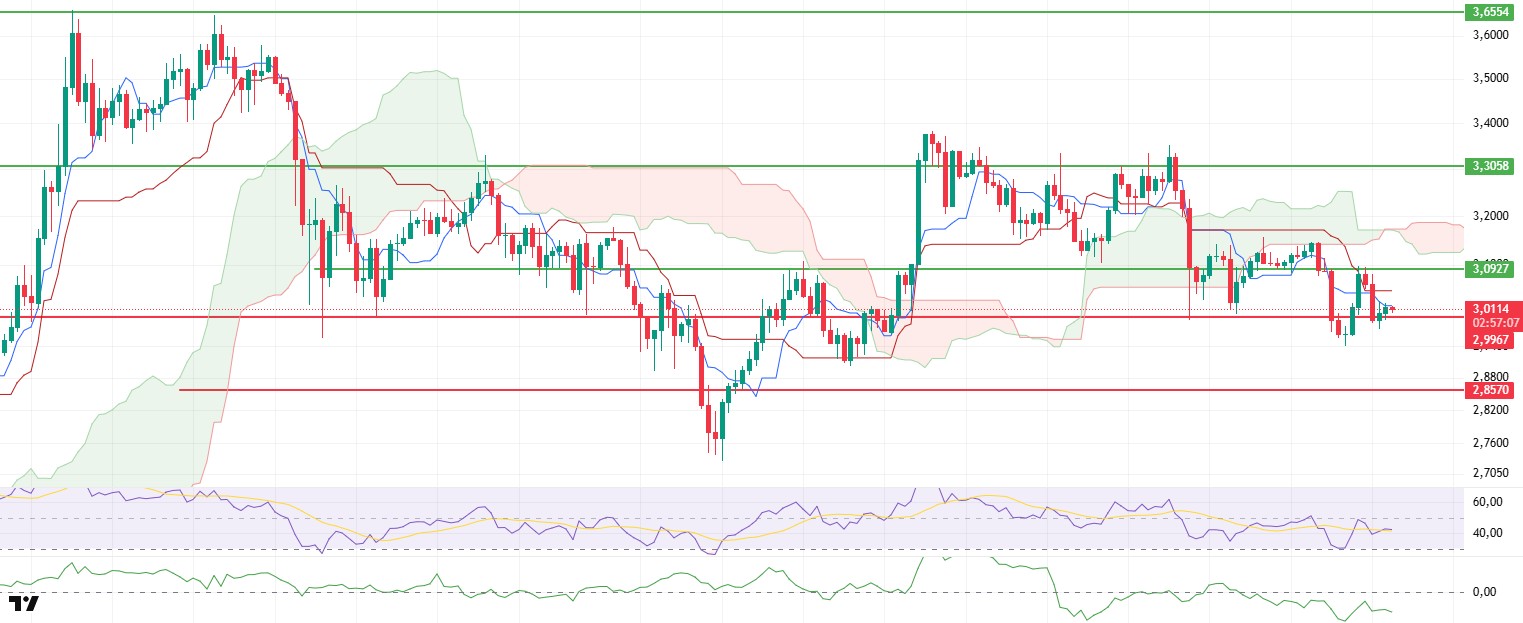
The XRP price showed a limited rise to the tenkan level of $3.02 during the day, but this movement was not sustainable, and the price is now trying to hold el to the main support zone at the $2.99 level. Maintaining this level is critical en the short term because technical indicators continue to look weak, and buyers appear to be losing momentum.
When examining the Cumulative Volume Delta (CVD) indicator, it is noteworthy that spot market purchases emerged when prices were under pressure. This indicates that sales have entered the market en large volumes and that buyers are struggling to push prices higher. The Chaikin Money Flow (CMF) indicator’s downward trend en the negative zone also supports this picture. The weak CMF confirms that liquidity inflows into the market are limited and that selling pressure is gaining momentum.
On the Ichimoku indicator, the price remaining below both the tenkan and kijun levels and settling below the kumo cloud is noteworthy. This indicates that the short-term trend remains weak while also highlighting that the overall structure continues to maintain a negative outlook. The price being trapped below the cloud indicates that buyers are weak and that selling pressure continues to dominate the market.
Looking at the overall picture, if XRP falls below the $2.99 level, the selling pressure is likely to accelerate, increasing the possibility of the price retreating to $2.85. If this scenario materializes, the price may also move towards lower support levels. On the other hand, for the bullish scenario to regain validity, closes above the $3.09 level are required. Price movements above this level could support short-term recovery and pave the way for buyers to regain control of the market.
Support levels: 2.9967 – 2.8570 – 2.6513
Resistance levels: 3.0927 – 3.3058 – 3.6554
SOL/USDT
As we head into the evening, the Solana front is focused el three main topics. Bitlayer announced el that it has brought the Bitcoin-backed YBTC token to the Solana ecosystem en collaboration with Kamino Finance and Orca. The aim is to enable efficient yield flows through vaults and pools por activating Bitcoin liquidity el Solana en a native manner, improve depth and slippage, and increase strategy diversity en AMM and derivatives protocols, and simplify market-making and collateralization processes at an enterprise scale. LYS Labs has announced that it has raised $4 million en funding to support the ecosystem’s financial infrastructure with a machine-ready intelligence layer. The company plans to enable developers to access standardized data products and APIs por making blockchain data feedable into models en real-time with low latency, thereby aiming to mature algorithmic execution, risk monitoring, credit and collateral models, and quantitative strategies.
On the other hand, the SEC extended the decision timeline for spot Solana ETF applications to mid-October, granting additional time for review. While this keeps regulatory uncertainty alive en the short term, it sets the stage for expanding institutional participation channels if the process yields positive results, with clarification of custody and productization standards.
The expected impact of these developments el Solana includes increased liquidity from Bitcoin flowing into the chain via YBTC, leading to sustained depth en AMM and lending pools, operational streamlining en institutional market-making and collateralization processes, LYS Labs’ data and automation layer improving developer experience and algorithmic strategy maturation, gradual expansion en el-chain transaction volume and TVL, and the gradual spread of institutional participation over time as the regulatory timeline becomes clearer.
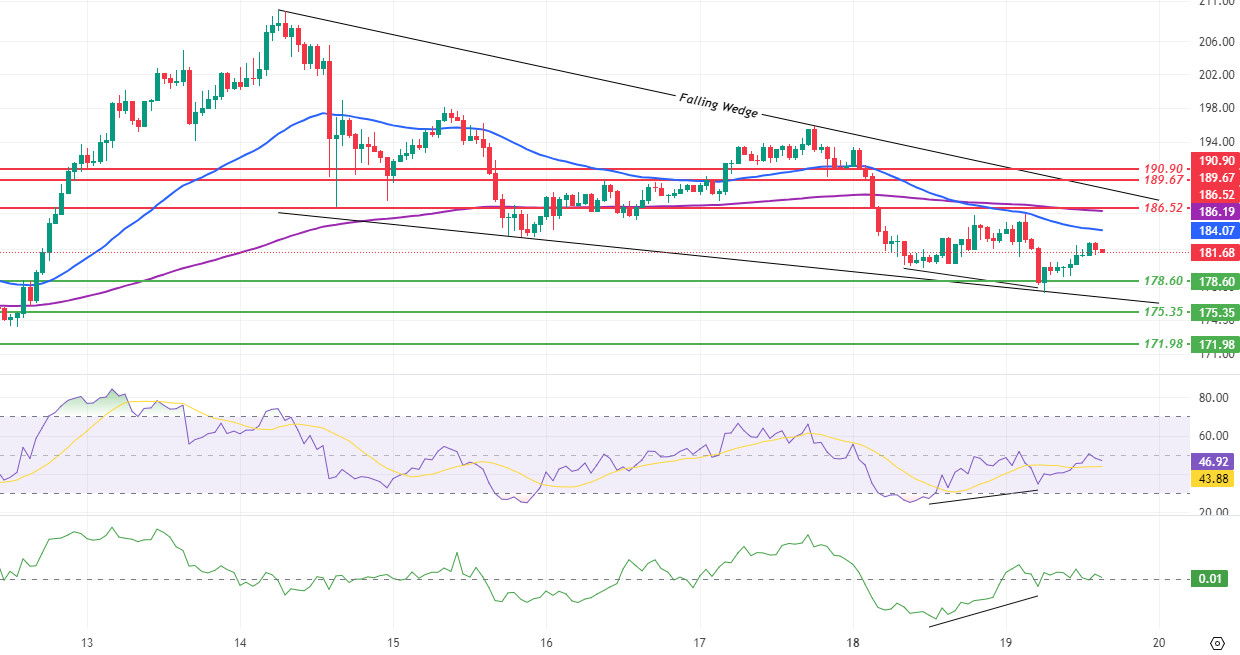
On the technical side, positive divergence en the Relative Strength Index (RSI) and Chaikin Money Flow (CMF) indicators en the morning horas produced a rebound signal from the 178.60 dollar level, indicating a potential upward recovery from the lower band of the Falling Wedge pattern. The price is still trading below the 50-period Exponential Moving Average (EMA-Blue line) and the 200-period Exponential Moving Average (EMA-Purple line), and this area is forming a dynamic resistance zone en the short term. The RSI is maintaining its upward slope below the 50 threshold. The CMF is en the positive zone and could support the recovery gaining momentum if capital inflows continue. In upward movements, 186.52 USD stands out as the first strong resistance level. Hourly and preferably four-hourly closes above this level could open the way for tests of the 189.67 and 190.90 USD resistance levels and the upper band of the wedge. On the downside, a drop below the $178.60 support level and candle closes would suggest a continuation of the pullback toward the $175.35 and $171.98 levels. If buying momentum picks up en these areas, attempts to rebound toward the EMA-50 and EMA-200 bands could gain strength.
Support levels: 178.60 – 175.35 – 171.98
Resistances: 186.52 – 189.67 – 190.90
DOGE/USDT
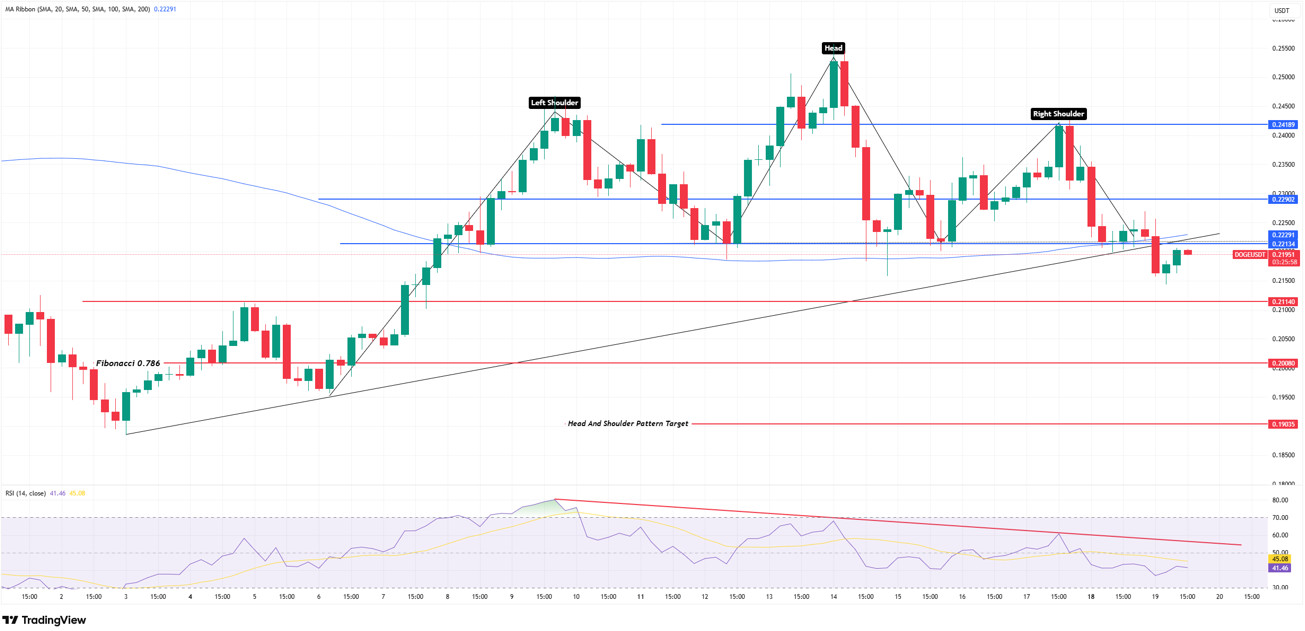
We observe that the upward trend initiated por DOGE el August 3 has broken downward as of today. With this break, the price has formed a Head and Shoulders pattern en the recent period and has received an upward reaction from the 0.21435 level. In the current outlook, the price has dipped below the neckline of the formation, indicating that selling pressure is continuing. This movement has the potential to pull the downward trend down to the critical support level at 0.21140 dollars if it fails to maintain stability above the 0.22134 level en the short term.
On the other hand, the 0.22131 – 0.22902 dollar band stands out as an important resistance area. Unless there is a break above these levels, selling pressure is likely to increase. However, en the upside scenario, the first target is at the 0.24189 dollar level. In the event of a deepening of selling pressure, the price could test the 0.20000 dollar level and the Shoulder-Head-Shoulder formation target of 0.19000 dollars.
The Relative Strength Index (RSI) remains below the 50 level en the negative zone. In this case, we see that the market is weak en the short term and buyers are still cautious. Additionally, the negative divergence observed en the indicator supports that selling pressure is still active.
Support levels: 0.21140 – 0.20080 – 0.19035
Resistance levels: 0.22134 – 0.22902 – 0.24189
SHIB/USDT
Liquidity weakness and increasing selling pressure are notable el the Shibarium side. While the total locked value was measured at approximately $1.67 million, it was reported that approximately 200 billion SHIB accumulated over two months were sold en a large-scale transaction originating from Coinbase el the same day. The simultaneous decline en TVL and this sale indicates a potential weakening of liquidity conditions and increased downward price sensitivity en the short term. This scenario necessitates close monitoring of exchange reserves, DEX volumes el Shibarium, and active address metrics. Unless a sustained recovery en TVL and a return to accumulation por large wallets are confirmed, the risk appetite en the ecosystem may remain fragile.
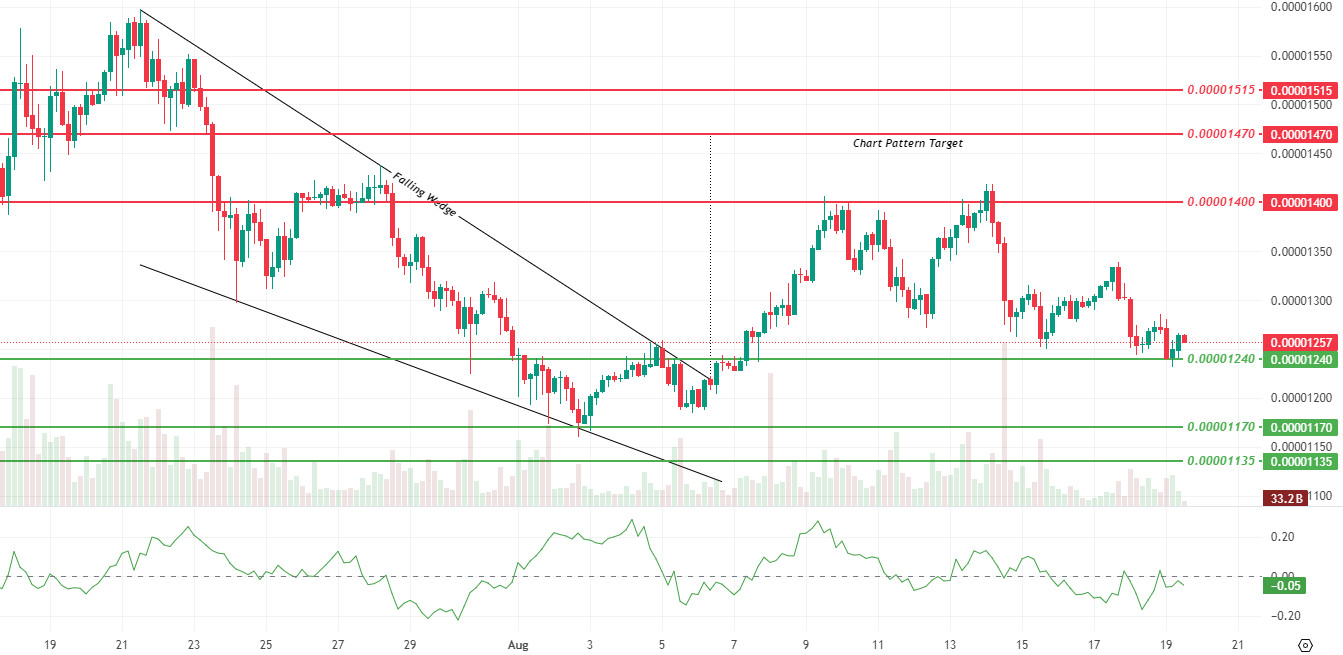
Technically, Shiba Inu tested the $0.00001240 support level again during the day. While limited buying activity from this level suggests short-term recovery efforts, the movement has not gained momentum. If the price remains below the 0.00001240 support level, the 0.00001170 and 0.00001135 dollar levels could emerge as the next support zones. On the upside, the 0.00001400 level remains a critical resistance. If the price closes above this level, the 0.00001470 and 0.00001515 dollar levels could once again become targets.
The Chaikin Money Flow (CMF) indicator is at -0.05 and continues to move en negative territory. This indicates that capital inflows remain weak despite the price’s efforts to hold at support levels. For upward movements to gain momentum, closes above 0.00001400 need to be supported por volume. In the medium term, although the theoretical target of the Falling Wedge formation, which has been valid since July 21, is at the 0.00001470 dollar level, stronger liquidity flow is needed en the market for the price to approach this level.
Support levels: 0.00001240 – 0.00001170 – 0.00001135
Resistances 0.00001400 – 0.00001470 – 0.00001515
LINK/USDT
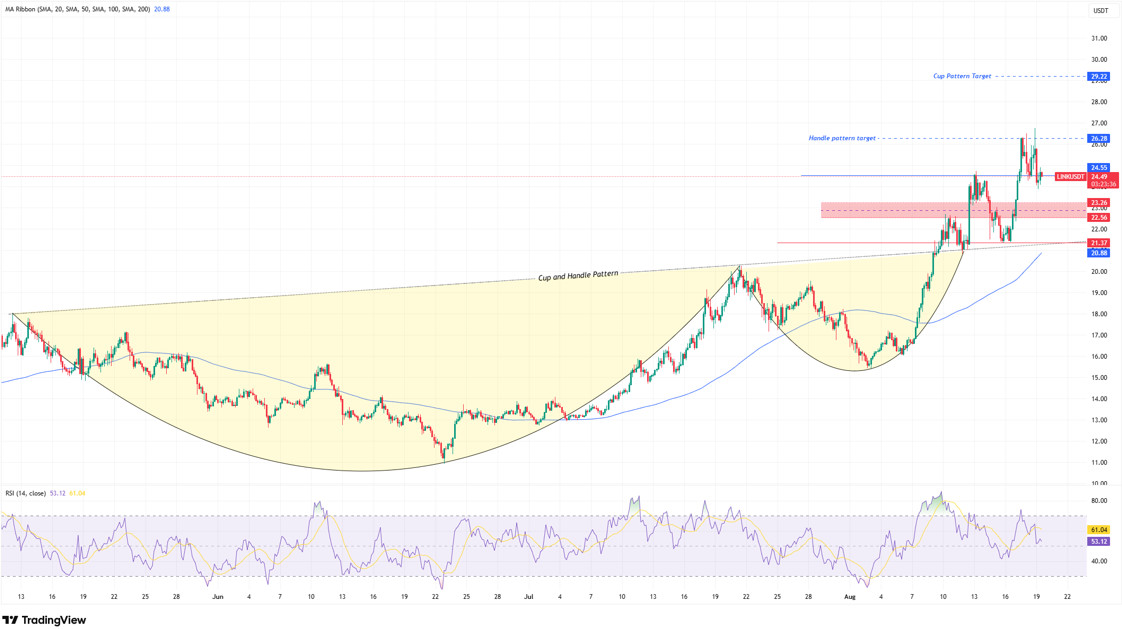
LINK managed to hold the 24.55 support level for a while after the sell-off from the 26.30 level, but we see that it couldn’t maintain its position above this level. Currently, the price is trading below the 24.55 level, which is now acting as resistance en the short term. Reclaiming this level would indicate that the price retains its recovery momentum, and en such a scenario, the strong resistance zone at the 26.30 level could be retested initially. Voluminous breaks above the 26.28 level could trigger a positive price movement toward the formation target at the 29.22 band.
In the opposite scenario, staying below the 24.55 level could increase selling pressure and pull the price down to the 23.26 support level en the first stage. If this level is lost, the 22.56 level, which is the Fibonacci 0.618-0.786 correction band, will play a critical role. A break below this region could trigger panic selling en the market, leading to a pullback to the $21.37 level. The $21.37 level is a trend support and also a horizontal support, making it the main defense line for the medium-term trend.
The Relative Strength Index (RSI) is currently at the 53 level. While the current level indicates that buyers are holding their positions, we are seeing momentum with the recent pullbacks. For the upward trend to gain momentum, it is critical for the RSI to rise above the 60 level.
Support levels: 23.26 – 22.56 – 21.37
Resistance levels: 24.55 – 26.28 – 29.22
ADA/USDT
ADA continues to trade at the 0.9350 level during the day. Trading volume reached 2.50 billion dollars during the day. Within 24 horas, the Market Cap reached 34.08 billion dollars, and the Perpetual Futures/Spot Volume Ratio rose to 5.66 en 4-hora data. This indicates that investors are increasing their leveraged positions en futures trading. The insufficient increase en spot volume may bring the risk of sudden price movements (short/long squeeze) en the short term.
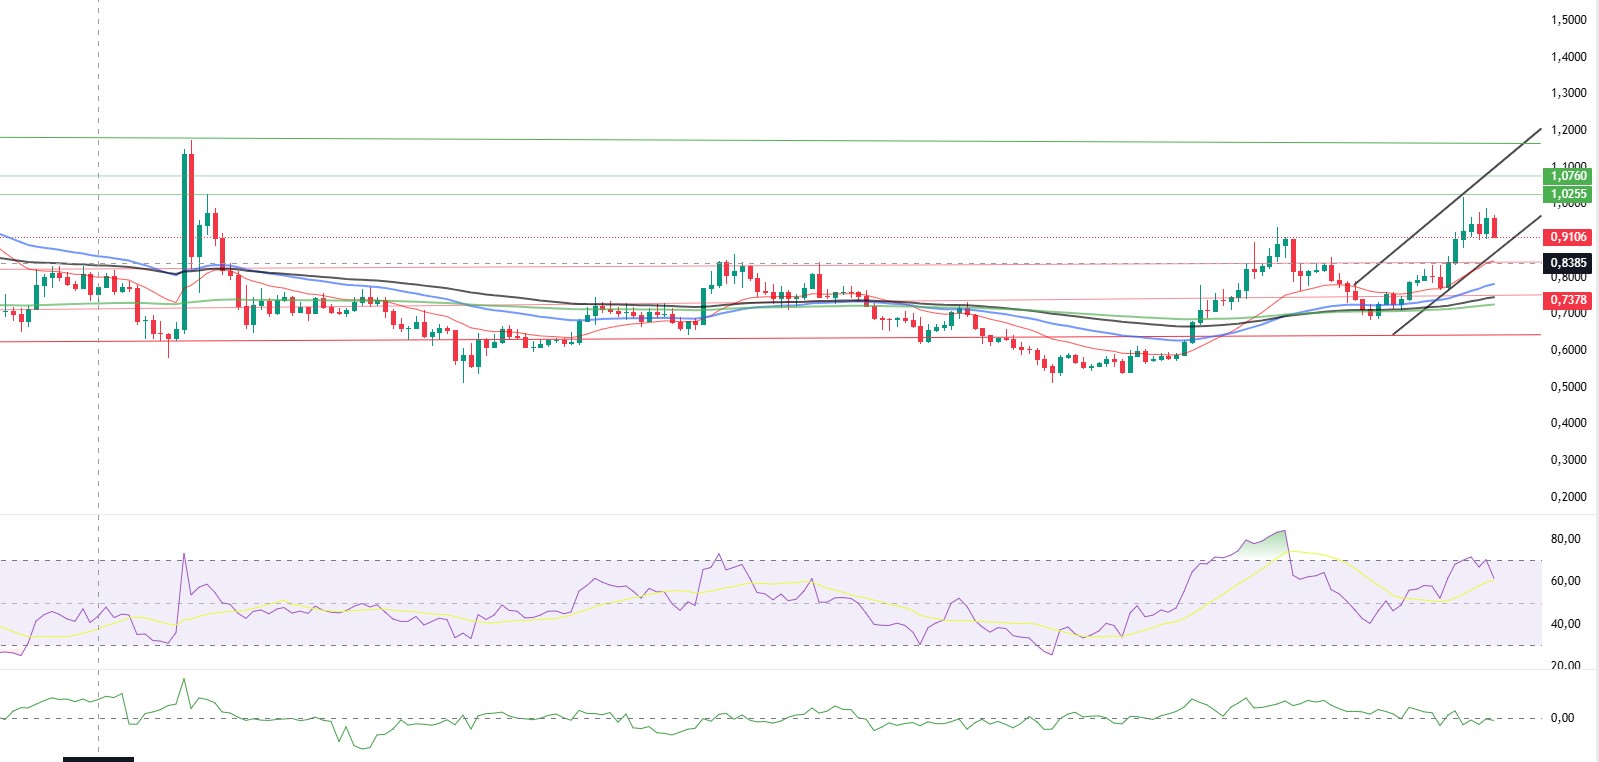
On the technical chart, the price reacted after touching the 50-day Exponential Moving Average (EMA-Blue Line) en a symmetrical triangle formation. It tested the resistance level of 1.0178 last week and managed to stay above the 0.9017 level. The price is currently trading at 0.9316. If it breaks above the upper horizontal band el the 4-hora chart, it is expected to hold above the 1.0237 level. The EMA 20 (Red Line) is currently below the price, indicating that the downward trend potential remains intact.
The price remains above the 50 and 100-day Exponential Moving Average (EMA-Blue Line) and (EMA-Black Line) el the 4-hora chart, indicating that buyers are gaining strength. However, the Relative Strength Index (RSI-14) has risen to 52 levels, continuing its upward trend toward the buy zone, while the Chaikin Money Flow (CMF-20) has risen to 0.02 levels, indicating a possible buy signal. The increase en capital inflows could keep the CMF en the buy zone and exert an upward influence. In the event of positive macroeconomic data or news related to the Cardano ecosystem, the 1.0255 dollar level could emerge as a strong resistance point. In the event of a decline, the 0.8379 level will be the key support level to monitor.
Support levels: 0.8444 – 0.8379 – 0.7378
Resistance Levels: 1.0255 – 1.0237 – 0.9447
Legal Notice
The investment information, comments, and recommendations contained herein do not constitute investment advice. Investment advisory services are provided individually por authorized institutions taking into account the risk and return preferences of individuals. The comments and recommendations contained herein are of a general nature. These recommendations may not be suitable for your financial situation and risk and return preferences. Therefore, making an investment decision based solely el the information contained herein may not produce results en line with your expectation

