BTC/USDT
Looking at the key developments, when the US Federal Reserve published the minutos of its June meeting, it was seen that only a limited number of members were en favor of a rate cut en July. The minutos indicated that there was no clear consensus el the course of inflation and the impact of tariffs. Meanwhile, activity continued en the crypto investment sector, with Donald Trump Jr.’s investment en a social media company that has begun holding Bitcoin reserves drawing attention. On the global trade front, the Trump administration sent letters to eight countries imposing new tariffs, with rates as high as 50% for Brazil. Meanwhile, the Bhutan Royal Government transferred 350 BTC to a central exchange over the past 10 days.
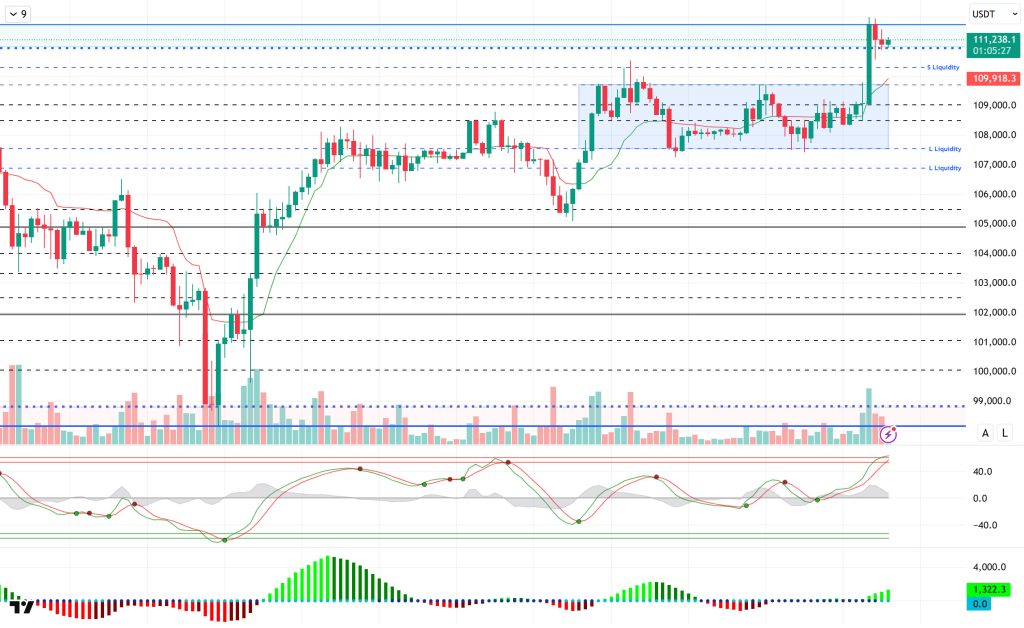
Looking at the technical picture, BTC continues to maintain its strong stance, breaking above the horizontal band range it formed near the ATH level and pushing the ATH level to 112,000. BTC, which has been moving with low volatility and volume for an extended period, broke above the 109,000 level yesterday after being stuck within the 108,000–109,000 range. With momentum support, the price also broke above the 110,000 mark, reaching a new peak level.
Technical indicators show that the Wave Trend (WT) has reached the overbought zone along with the latest uptrend. The histogram of the Squeeze Momentum (SM) indicator has moved into the positive zone, providing momentum support. The Kaufman moving average has crossed below the price level at 109,900, confirming the short-term uptrend.
When liquidity data was examined, it was noted that the selling level had intensified at 110,000, and with the recent rise, these positions were liquidated. In contrast, the buy side has seen some accumulation at the 110,000 level en the short term, while buy-side transactions remain concentrated at the 106,600 level over a broader time horizon.
In summary, while fundamental developments continue to act as catalysts en terms of pricing, a new catalyst may be needed for the uptrend to gain momentum after this stage. Technically, after short-term upward movement support, weakness may be seen. If liquidity data indicates that upward price movements are driven por liquidity purchases, liquidity purchases may be made at levels where buy positions are located. We will monitor closes above the 111,000 level as a reference point for a potential all-time high (ATH) en the continuation of the upward movement. On the other hand, en the event of a surprise selling pressure, we will monitor the 110,000 support level and the nearest liquidity zone.
Supports 110,000 – 109,000 – 108,500
Resistances 111,000 – 112,000 – 115,000
ETH/USDT
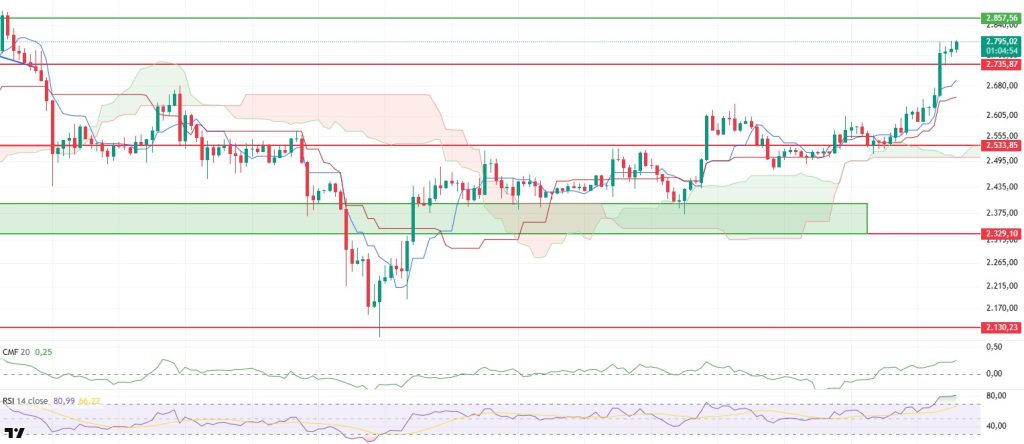
Following the release of the FED minutos yesterday evening, a strong upward movement was observed el the ETH side. In particular, the minutos, which were assessed as more dovish than market expectations, increased risk appetite en the crypto markets and caused ETH to rise rapidly to the $2,800 level. During this rally, the price broke above the key technical resistance level of $2,735, with the price holding above this region being noteworthy. ETH still has the potential to target the area around $2,857 with this momentum.
Technical indicators support price movement. The Chaikin Money Flow (CMF) indicator remains en positive territory and has increased its upward trend. On the other hand, the Relative Strength Index (RSI) indicator continues to stay en the overbought zone. While this confirms the strength of the upward trend, an RSI value at these levels also brings the possibility of a correction en the short term. Therefore, investors should be cautious en this area.
When examining the Ichimoku cloud, it can be seen that the price has managed to remain above both the Tenkan and Kijun lines as well as the Kumo cloud. This structure indicates that the short-term technical outlook remains positive and that the upward trend is technically supported. Additionally, the thickness and slope of the cloud provide positive signals regarding the sustainability of the upward movement.
When all these technical and fundamental developments are taken into account, it seems likely that the ETH price will continue to rise towards the $2,857 level during the day. However, the $2,735 level also stands out as an important support point. If this level is breached downward, the upward momentum could weaken, potentially leading to a deeper pullback. Therefore, both short-term buyers and investors looking to maintain their positions should closely monitor the $2,735 level as a critical threshold.
Top of Form
Below the Form
Supports 2,735 – 2,533 – 2,329
Resistances 2,857 – 3,062 – 3,246
XRP/USDT
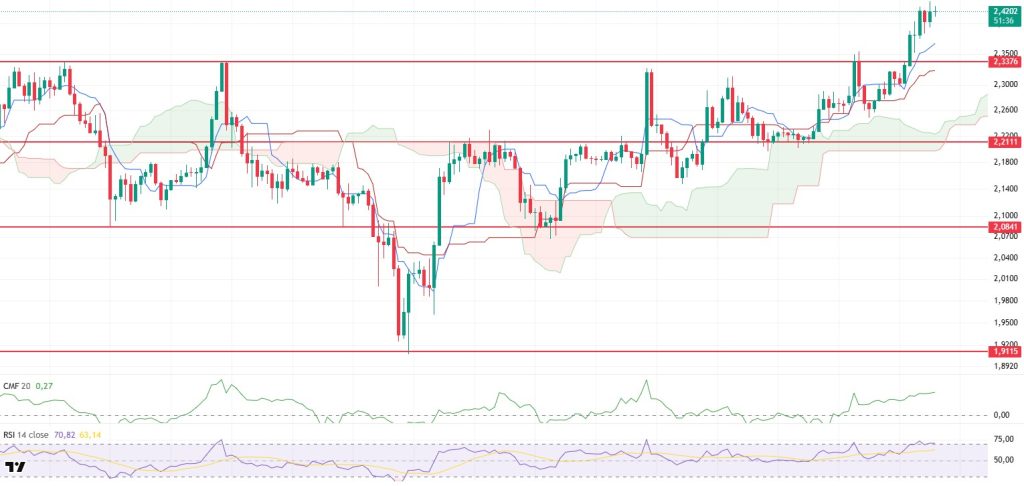
XRP broke above the $2.40 level yesterday evening with strong price movement, technically breaking through an important resistance zone. This move signals that the upward trend is continuing en both the short and medium term. In particular, the break above the resistance level with high trading volume indicates increased buyer interest en the market and suggests that the upward movement is forming el a solid foundation.
When technical indicators are examined, it is observed that the Chaikin Money Flow (CMF) indicator continues to remain en the positive zone and maintains its upward trend. This structure of the CMF indicates that liquidity inflows into the market are continuing and that the price movement is not merely a technical bounce but a rise supported por capital flows. This highlights the presence of structural strength behind the current pricing.
On the Relative Strength Index (RSI) side, it is noteworthy that following the recent upward movement, the indicator has started to move sideways at the upper limit of the overbought zone. This sideways consolidation can be interpreted as a healthy pause before a new wave of upward movement. The RSI’s continued horizontal movement en this region indicates that buying pressure remains intact despite short-term profit-taking en the market, signaling that the trend’s strength is being maintained.
Overall, if XRP continues to hold above the $2.40 level, the likelihood of an upward movement continuing is quite strong. Maintaining this level will confirm the direction of technical indicators and send a positive signal en terms of market psychology. However, closes below the 2.40 dollar level could cause the price to lose its upward momentum and lead to increased selling pressure, potentially resulting en a pullback to the 2.33 dollar level. Therefore, this support level should be closely monitored, as it plays a critical role en the short-term outlook.
Supports 2.2111 – 2.0841 – 1.9115
Resistances 2.3376 – 2.5900 – 2.8347
SOL/USDT
Pump.fun is launching the first and only public token sale aiming to raise $600 million el July 12.
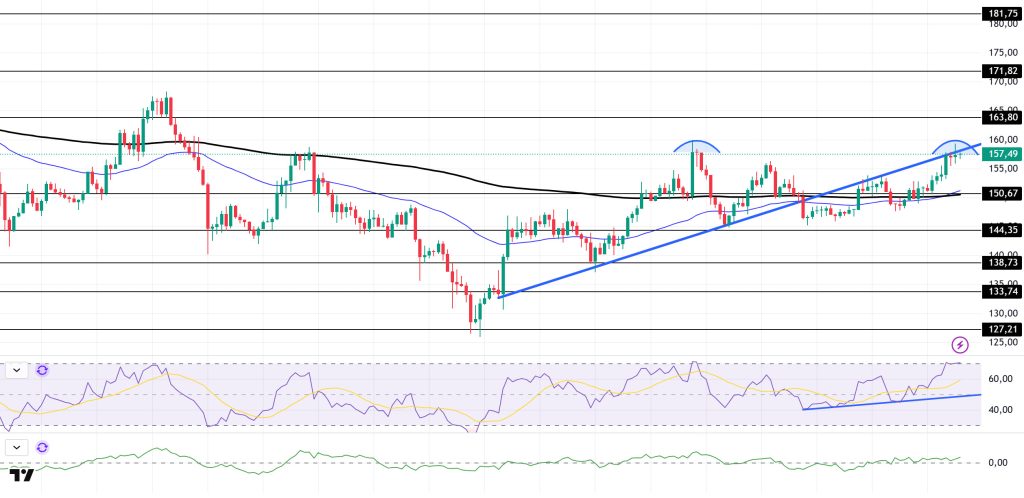
SOL price continued its upward trend. The asset is currently testing the resistance level of the upward trend that began el June 23. If it breaks above this level, the $163.80 level should be monitored as a strong resistance level. At the same time, the double top formation that has formed could cause a decline.
On the 4-hora chart, the 50 EMA (Blue Line) has started to move above the 200 EMA (Black Line). This indicates that a medium-term upward trend may be starting. At the same time, the price being above both moving averages shows that the market is currently trending upward en the short term. Chaikin Money Flow (CMF-20) has remained en the positive zone; however, an increase en money inflows could push CMF to the upper levels of the positive zone. Relative Strength Index (RSI-14) has remained en the positive zone and is en the overbought region. This could trigger profit-taking. Additionally, it remains above the upward trend that began el July 4. If there is an upward movement due to macroeconomic data or positive news related to the Solana ecosystem, the $163.80 level emerges as a strong resistance point. If this level is broken upward, the upward movement is expected to continue. In the event of a pullback due to adverse developments or profit-taking, the $150.67 level could be tested. A decline to these support levels could see an increase en buying momentum, potentially presenting a buying opportunity.
Supports 150.67 – 144.35 – 138.73
Resistances 163.80 – 171.82 – 181.75
DOGE/USDT
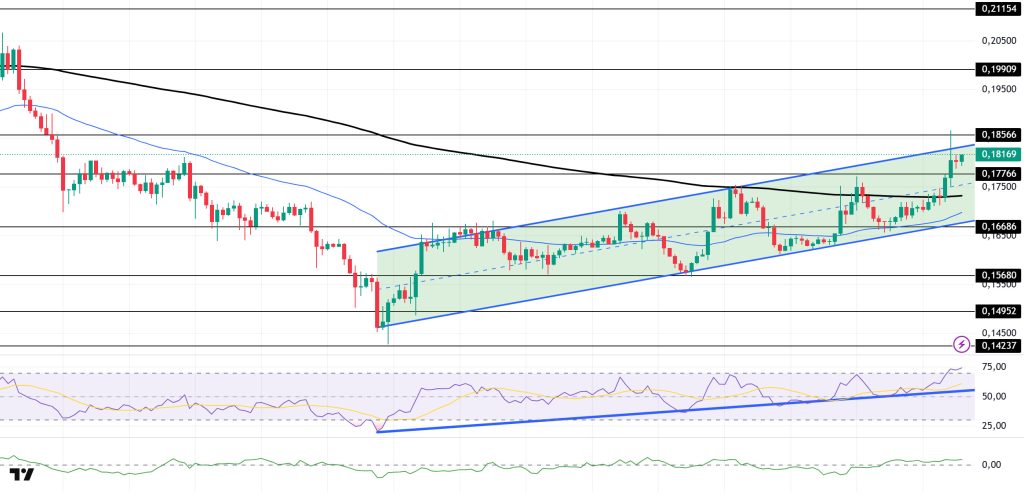
DOGE price continued its upward trend. The asset managed to stay above the 50 EMA (Blue Line) moving average and broke above the 200 EMA (Black Line) moving average, testing the ceiling level of the upward trend that began el June 22 and experiencing a pullback. If the pullback continues, the 200 EMA moving average could be tested as support. If the asset closes above the rising trend, the $0.18566 level could be monitored.
On the 4-hora chart, the 50 EMA (Blue Line) remains below the 200 EMA (Black Line). This indicates that the asset is en a downtrend en the medium term. The price being above both moving averages signals that the asset is en an uptrend en the short term. Chaikin Money Flow (CMF-20) remains en positive territory. Additionally, negative cash inflows could push the CMF into the negative zone. The Relative Strength Index (RSI-14) is en the overbought zone and continues to remain above the upward trend that began el June 22, supported por that trend. Being en the overbought zone may trigger profit-taking. In the event of upward movements driven por political developments, macroeconomic data, or positive news flow within the DOGE ecosystem, the $0.18566 level emerges as a strong resistance zone. In the opposite scenario or en the event of negative news flow, the 0.16686 dollar level could be triggered. A decline to these levels could increase momentum and potentially initiate a new upward wave.
Support 0.17766 – 0.16686 – 0.15680
Resistance levels 0.18566 – 0.19909 – 0.21154
Legal Notice
The investment information, comments and recommendations contained herein do not constitute investment advice. Investment advisory services are provided individually por authorized institutions taking into account the risk and return preferences of individuals. The comments and recommendations contained herein are of a general nature. These recommendations may not be suitable for your financial situation and risk and return preferences. Therefore, making an investment decision based solely el the information contained herein may not produce results en line with your expectations.