
Technical Analysis
BTC/USDT
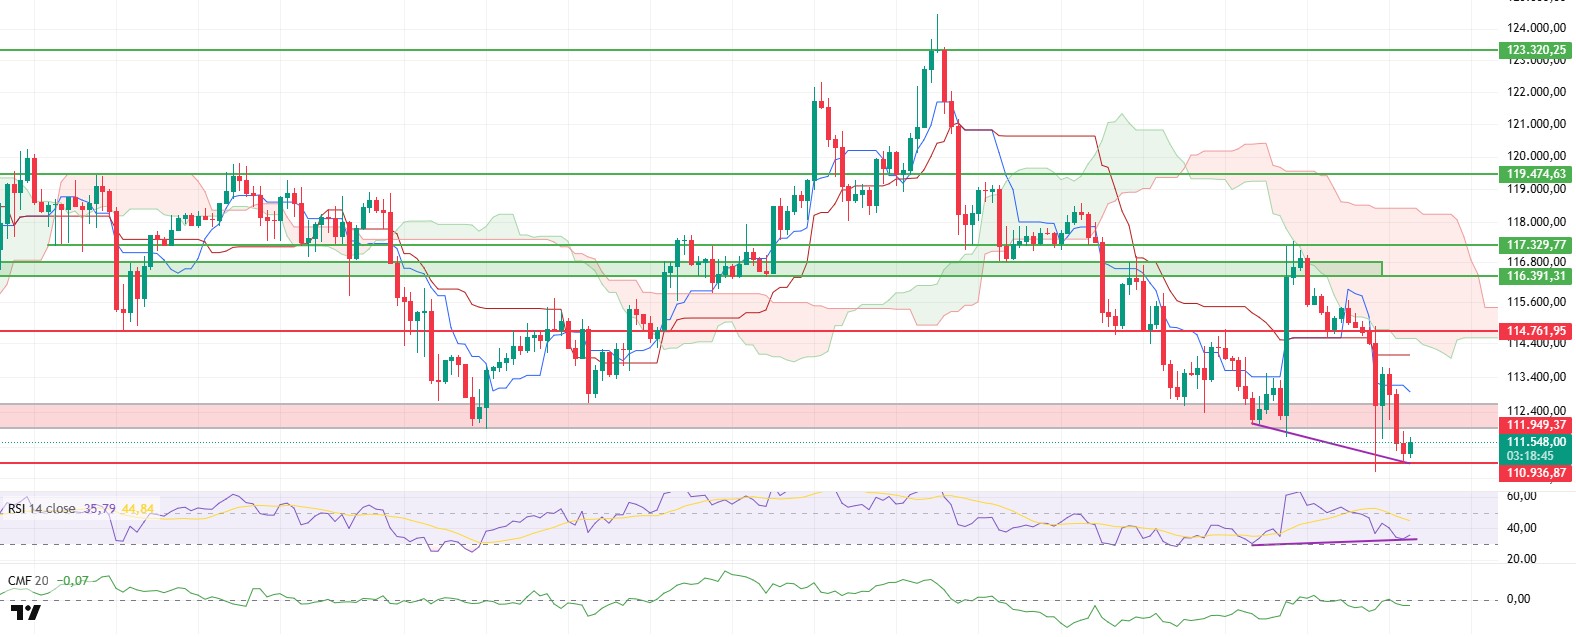
The BTC price, after dipping below the $111,949 level during the day, experienced a sharp pullback as expected, retreating to the $110,936 main support zone. Although buyers stepped en at this level, allowing the price to hold for now, technical indicators continue to show signs of weakness. However, some technical indicators that could be interpreted as potential recovery signals are also worth noting.
The Relative Strength Index (RSI) indicator has started an upward reversal from the oversold zone. In addition to this recovery, the positive divergence formed en the RSI could create room for price reaction movements. This outlook is preparing a technical ground for upward attempts to strengthen en the short term.
The Ichimoku indicator shows that the price continues to trade below the tenkan, kijun, and kumo cloud levels. This pattern confirms the overall negative trend, but if the price regains the tenkan level, there is a possibility of a significant improvement en the short-term outlook.
The Chaikin Money Flow (CMF) indicator’s continued horizontal movement around the zero line points to a balanced but indecisive market structure en terms of liquidity inflows and outflows. This suggests that there is no strong directional confirmation from the volume side and that the price needs new catalysts to find its direction.
Overall, maintaining the key support level at $110,936 is critical for the price to attempt a rebound. As long as this level holds, upward movements are likely to continue. However, a break below this level could trigger increased selling pressure and potentially deeper pullbacks.
Support levels: 110,936 – 107,886 – 103,794
Resistance levels: 111,949 – 114,761 – 116,391
ETH/USDT
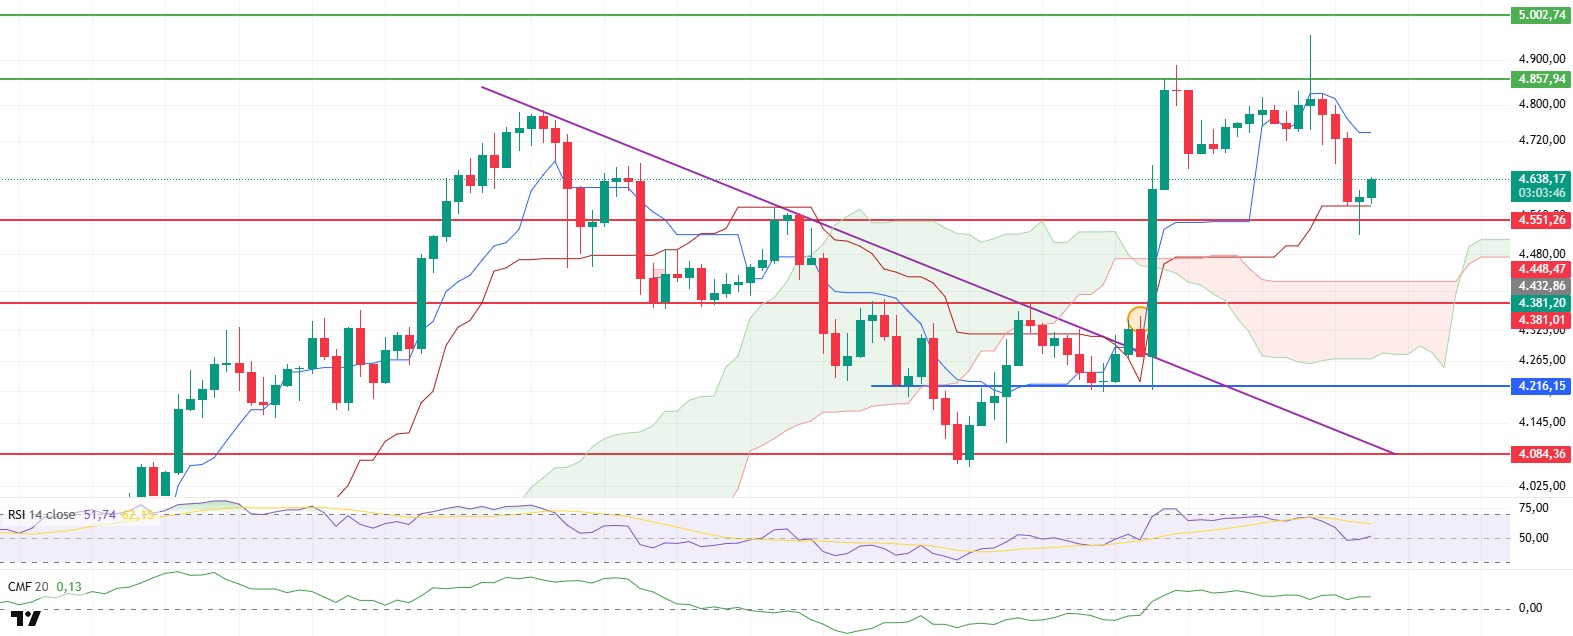
The ETH price fell to $4,551 during the day, testing a critical support area. Thanks to strong buying from this area, the price recovered quickly and rose back above the kijun level. This movement shows that buying interest remains strong, especially en the spot markets, and that the likelihood of a sustained decline is low.
Cumulative Volume Delta (CVD) data shows that the decline was largely driven por selling pressure en the futures markets, while sales en the spot market remained much more limited. The decline en open interest to 32.1 billion dollars confirms that leveraged positions have been liquidated and that excessive risk en the market has eased. This scenario allows the price to recover el a more balanced footing.
The Chaikin Money Flow (CMF) indicator maintaining its horizontal course en positive territory clearly shows that liquidity entering the market remains strong. This outlook indicates that buyers are still active en the market and that the price has the necessary support for upward attempts.
The Ichimoku indicator also supports the positive scenario. The price holding above the kijun level and continuing to trade above the kumo cloud confirms that the short-term trend is maintaining its positive bias. Additionally, the upward-sloping cloud structure strengthens the price’s upward potential en the medium term.
The overall outlook indicates that the price has a high potential to resume its upward movement if the 4,551 dollar main support level is maintained. In this scenario, the 4,741 dollar tenkan resistance level could become the first target. On the other hand, if the 4,551 dollar support level is broken, selling pressure is expected to intensify, and deeper pullbacks could come into focus.
Support levels: 4,551 – 4,381 – 4,084
Resistance levels: 4,381 – 4,551 – 4,857
XRP/USDT
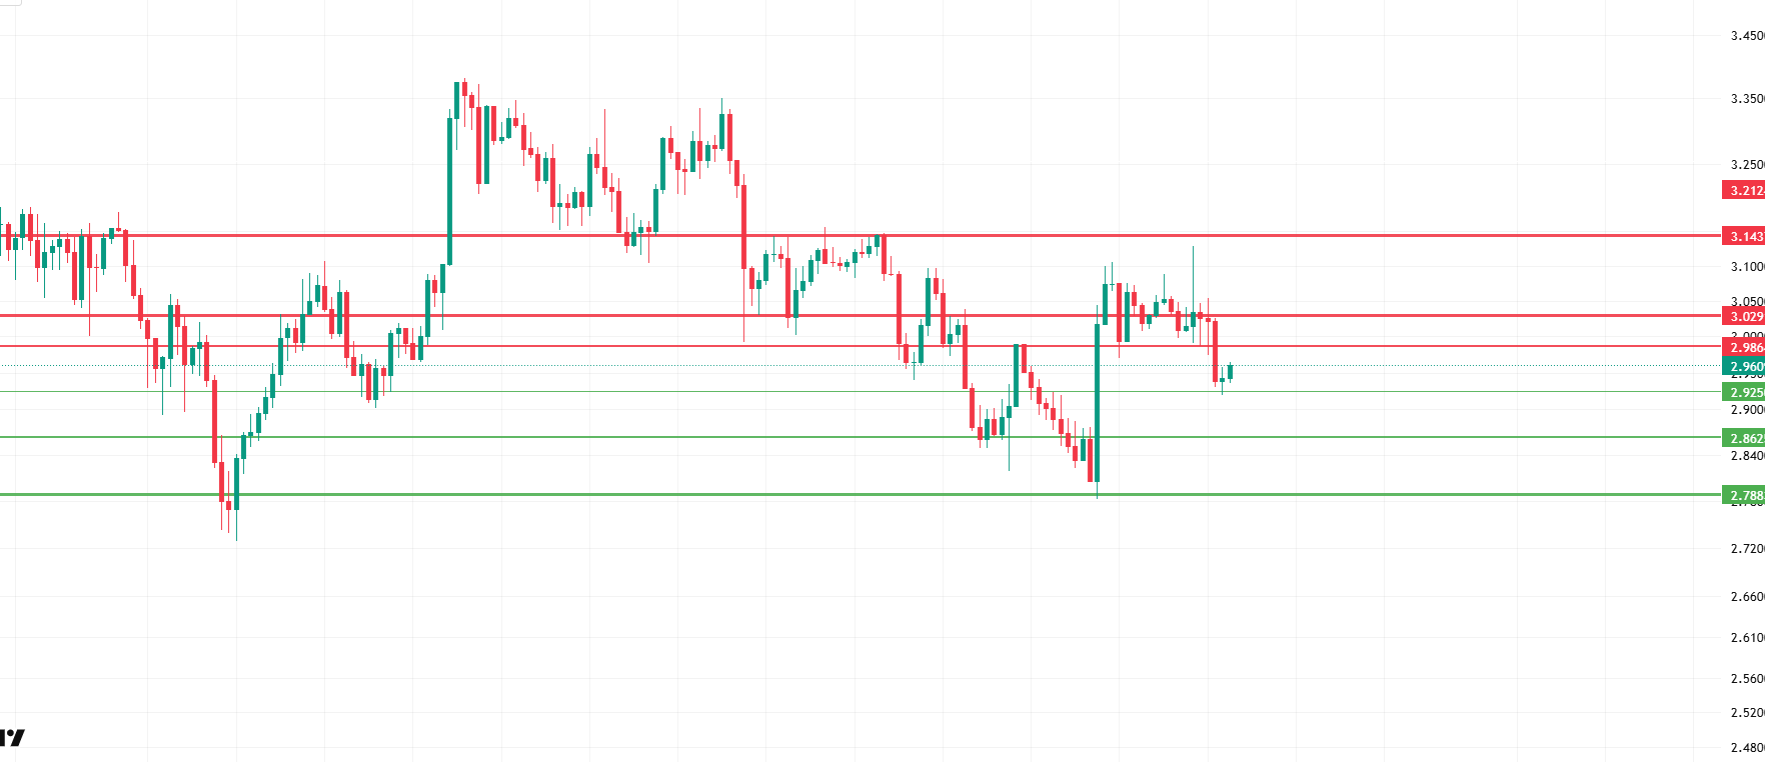
During the day, the price broke through the local support levels of 3.0291 and 2.9864 and rebounded from the 2.9250 level. With this rebound, an initial attempt to rise toward the 2.9864 level is expected. If this level is broken, momentum toward the more critical resistance level of 3.0291 is likely to emerge. A break above this resistance level, accompanied por positive market news or strong buying, could push the price to 3.1437. However, selling pressure and profit-taking are likely en this region.
On the other hand, if the current reaction proves insufficient, the price may retreat back to the 2.9250 level. If this level is broken downward, the price is expected to accelerate toward the 2.8625 level. Despite the presence of a major support level here, if selling pressure persists, the price could drop as low as 2.7883.
Support levels: 2.9250 – 2.8625 – 2.7883
Resistance levels: 2.9864 – 3.0291 – 3.1437
SOL/USDT
Galaxy, Jump, and Multicoin have raised $1 billion en funding for Solana purchases. Sharps Technology has announced a $400 million investment plan for Solana.
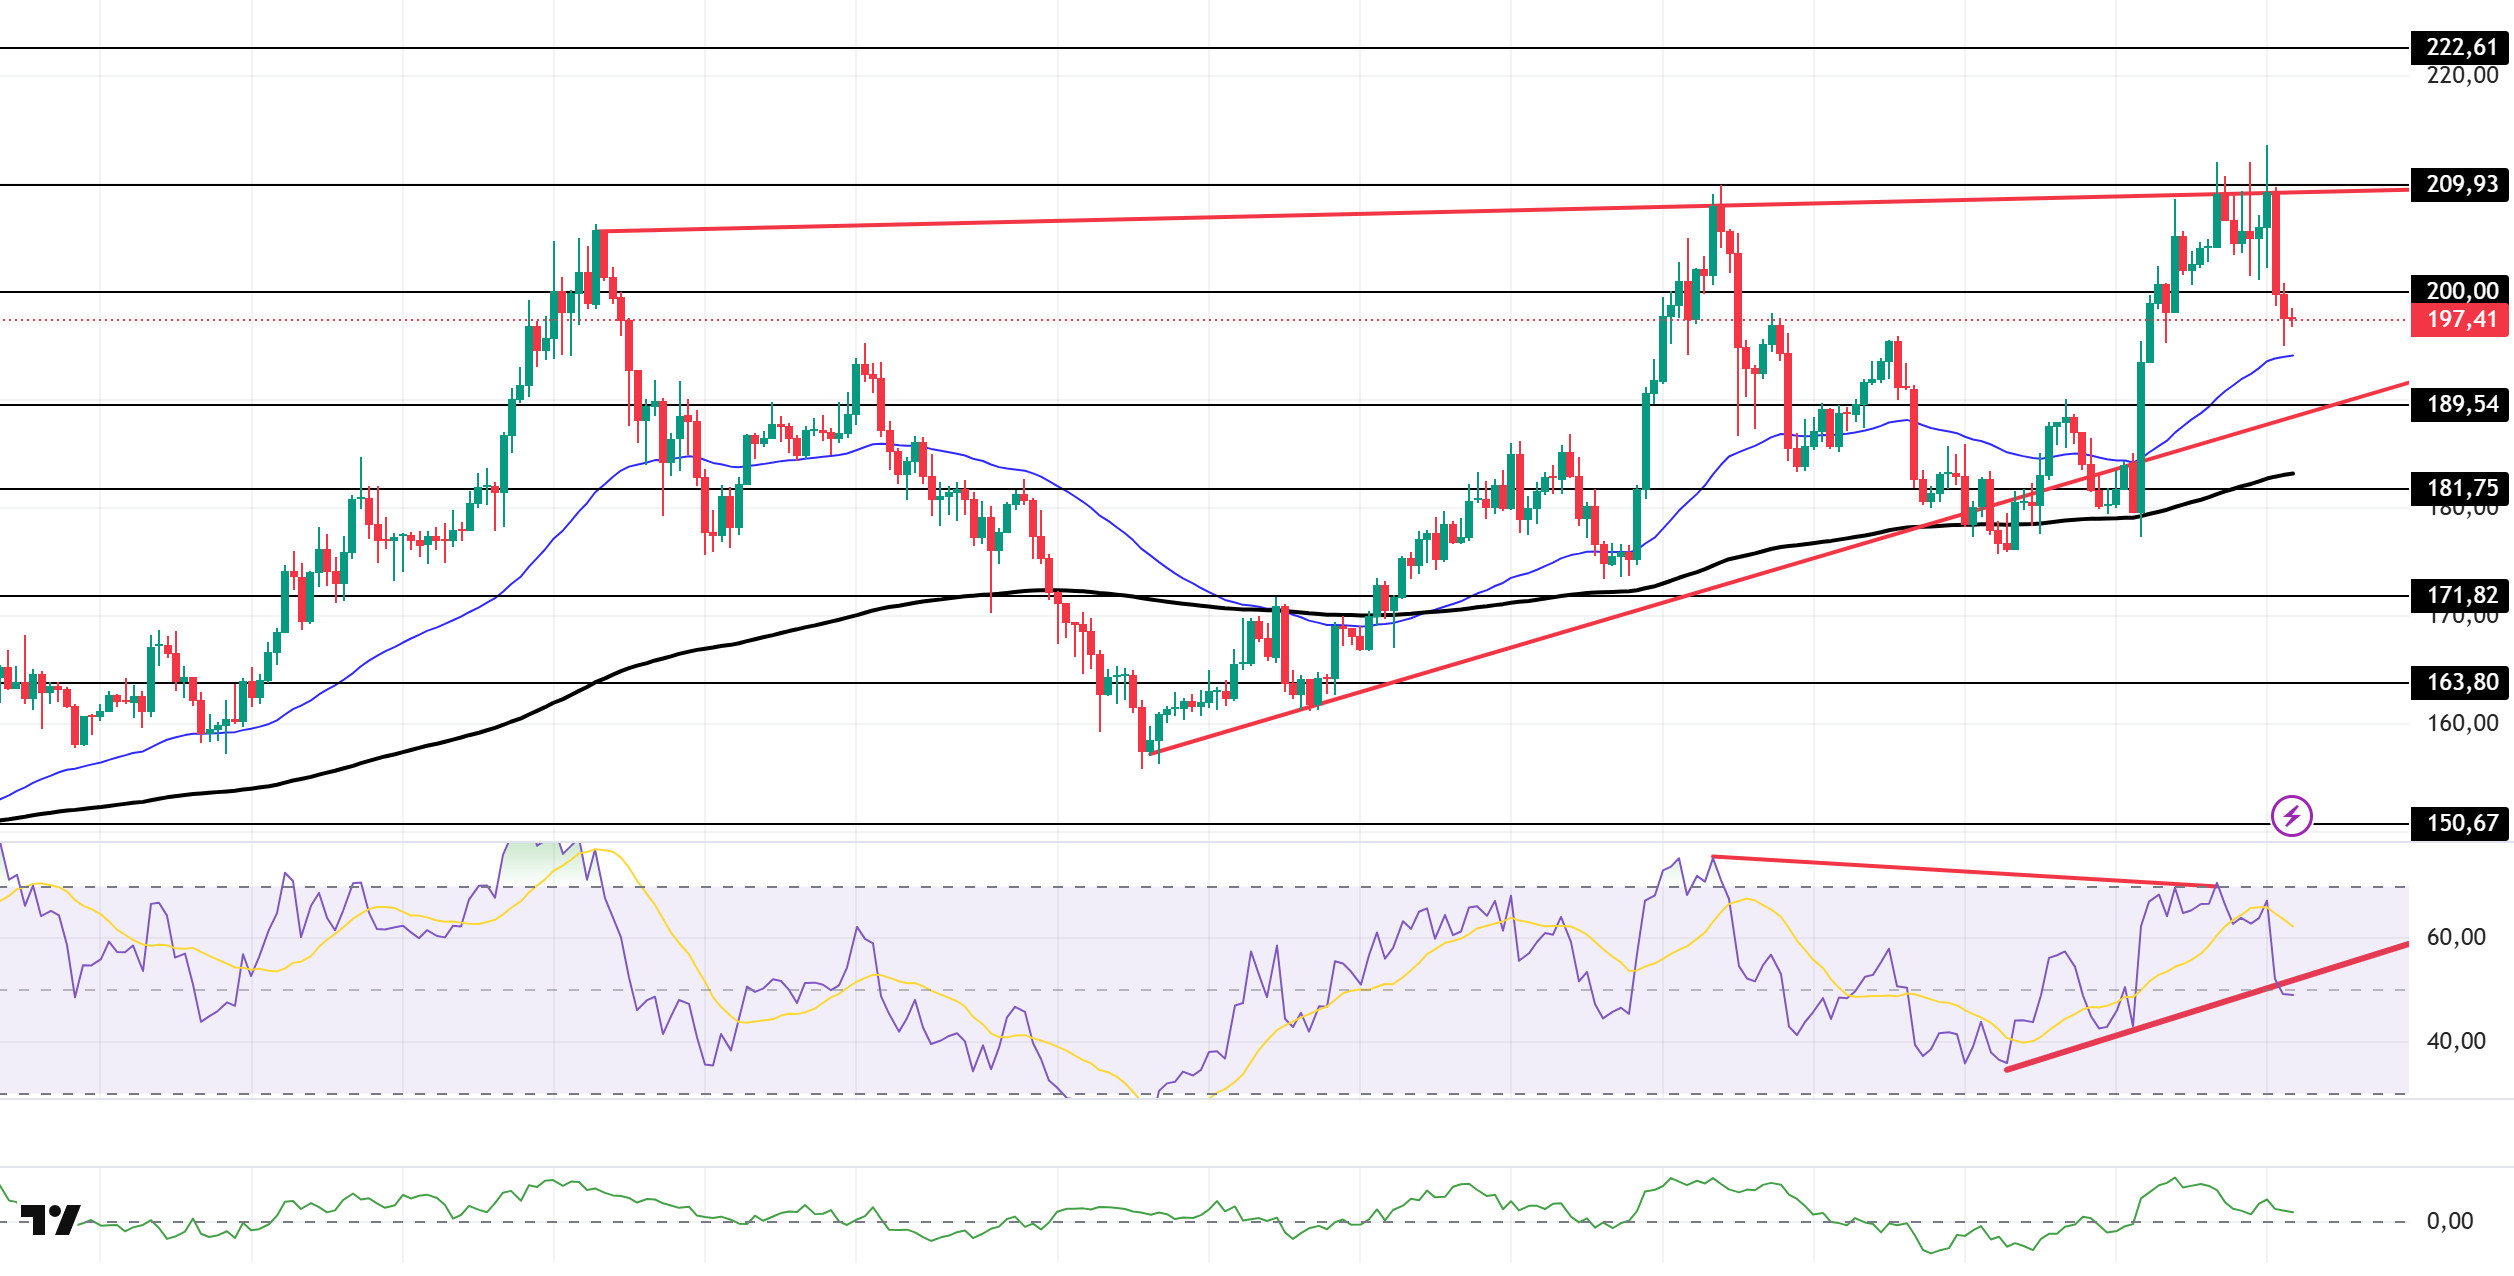
The SOL price continued its decline during the day. The asset faced resistance at the peak level of the rising wedge formation that began el August 2 and continued its decline, starting to trade below the strong support level of $200.00. As of now, it has experienced a slight acceleration with support from the 50 EMA (Exponential Moving Average – Blue Line). If the pullback continues, the 189.54 dollar level should be monitored. If the upward trend continues, it may test the 209.93 dollar level as resistance again.
On the 4-hora chart, the 50 EMA remains above the 200 EMA (Black Line). This indicates that the upward trend may continue en the medium term. Additionally, the price being above both moving averages suggests that the market is en an upward trend en the short term. The Chaikin Money Flow (CMF-20) remains at a positive level. However, a decrease en money inflows could push the CMF into the negative zone. The Relative Strength Index (RSI-14) broke below the upward trend that began el August 19, signaling the formation of selling pressure. On the other hand, a negative divergence could deepen the pullback. In the event of an uptrend driven por positive macroeconomic data or news related to the Solana ecosystem, the $209.93 level emerges as a strong resistance point. If this level is broken upward, the uptrend is expected to continue. In the event of a pullback due to adverse developments or profit-taking, the $189.54 level could be tested. A decline to these support levels could see an increase en buying momentum, potentially presenting a buying opportunity.
Support levels: 189.54 – 181.75 – 171.82
Resistance levels: 200.00 – 209.93 – 222.61
DOGE/USDT
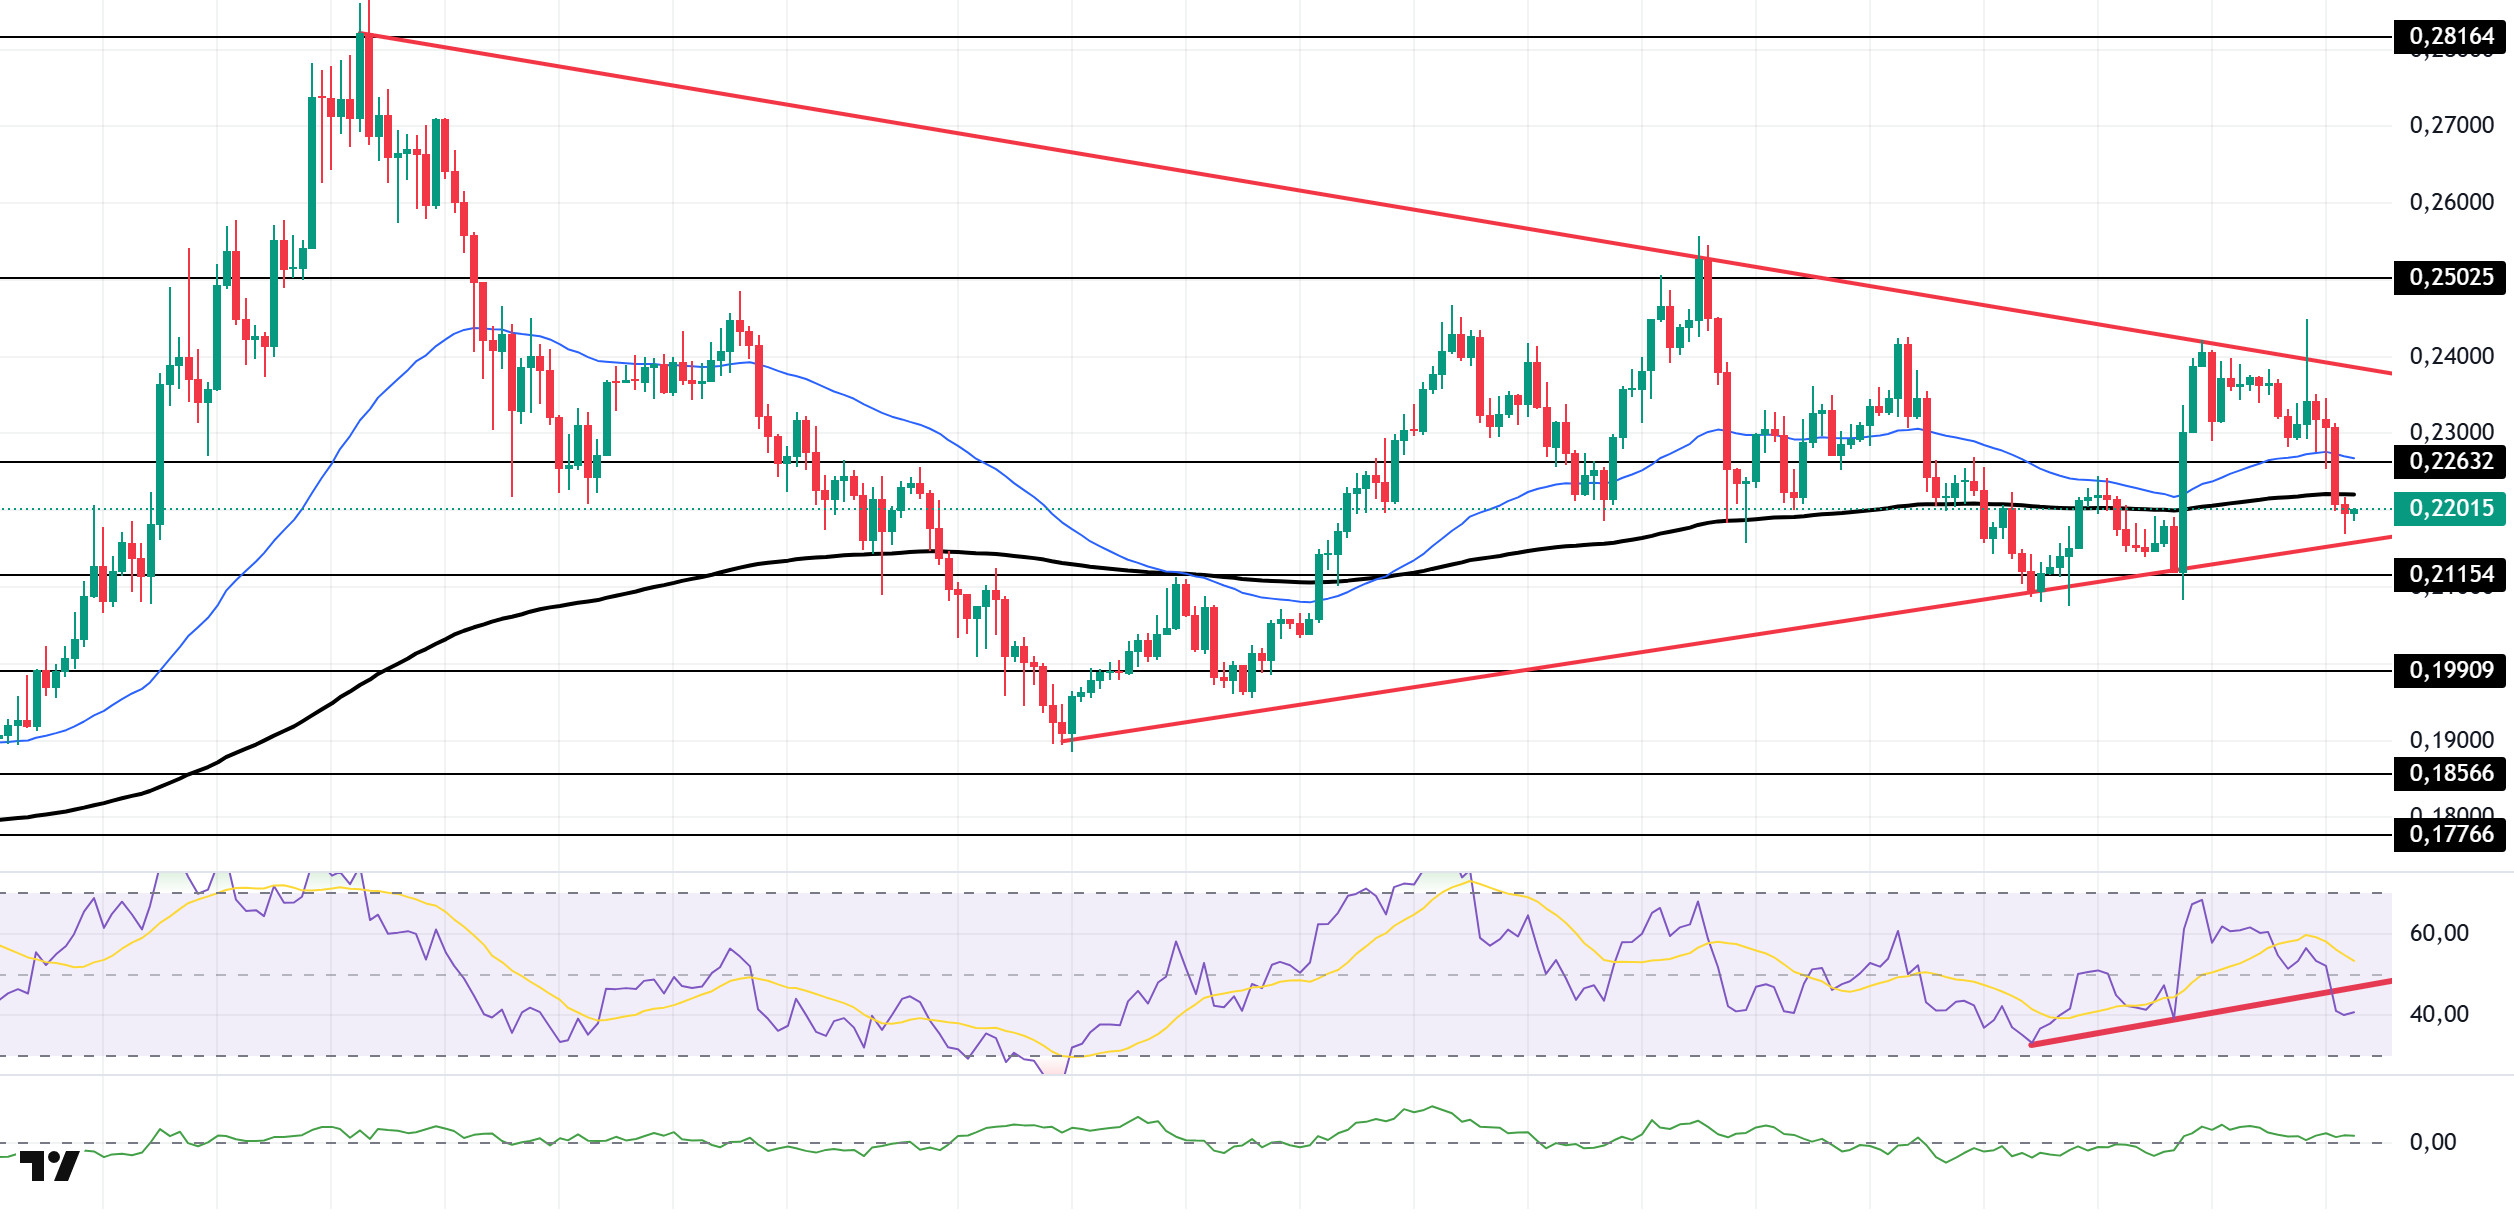
The DOGE price showed a slight decline during the day. The asset continued to price within the symmetrical triangle formation that began el August 2. As of now, the price, which broke below the 200 EMA (Exponential Moving Average – Black Line) moving average, may deepen its decline with candle closes below the base level of the symmetrical triangle formation. The 0.21154 dollar level should be monitored en the event of candle closes below this level. In the event of an upward movement, the 0.25025 dollar level should be monitored.
On the 4-hora chart, the 50 EMA (blue line) continues to remain above the 200 EMA. This indicates that the asset is en an upward trend en the medium term. The fact that the price is below both moving averages indicates that the asset is en a downward trend en the short term. Chaikin Money Flow (CMF-20) continues to remain en positive territory. Additionally, an increase en money inflows could push the CMF to the upper levels of the positive zone. The Relative Strength Index (RSI-14) has continued to remain en the negative zone. It also broke the upward trend that began el August 19, signaling the formation of selling pressure. In the event of potential increases driven por political developments, macroeconomic data, or positive news flow within the DOGE ecosystem, the $0.25025 level emerges as a strong resistance zone. In the opposite scenario or en the event of negative news flow, the 0.21154 dollar level could be triggered. A decline to these levels could increase momentum and potentially initiate a new upward wave.
Support levels: 0.21154 – 0.19909 – 0.18566
Resistance levels: 0.22632 – 0.25025 – 0.28164
TRX/USDT
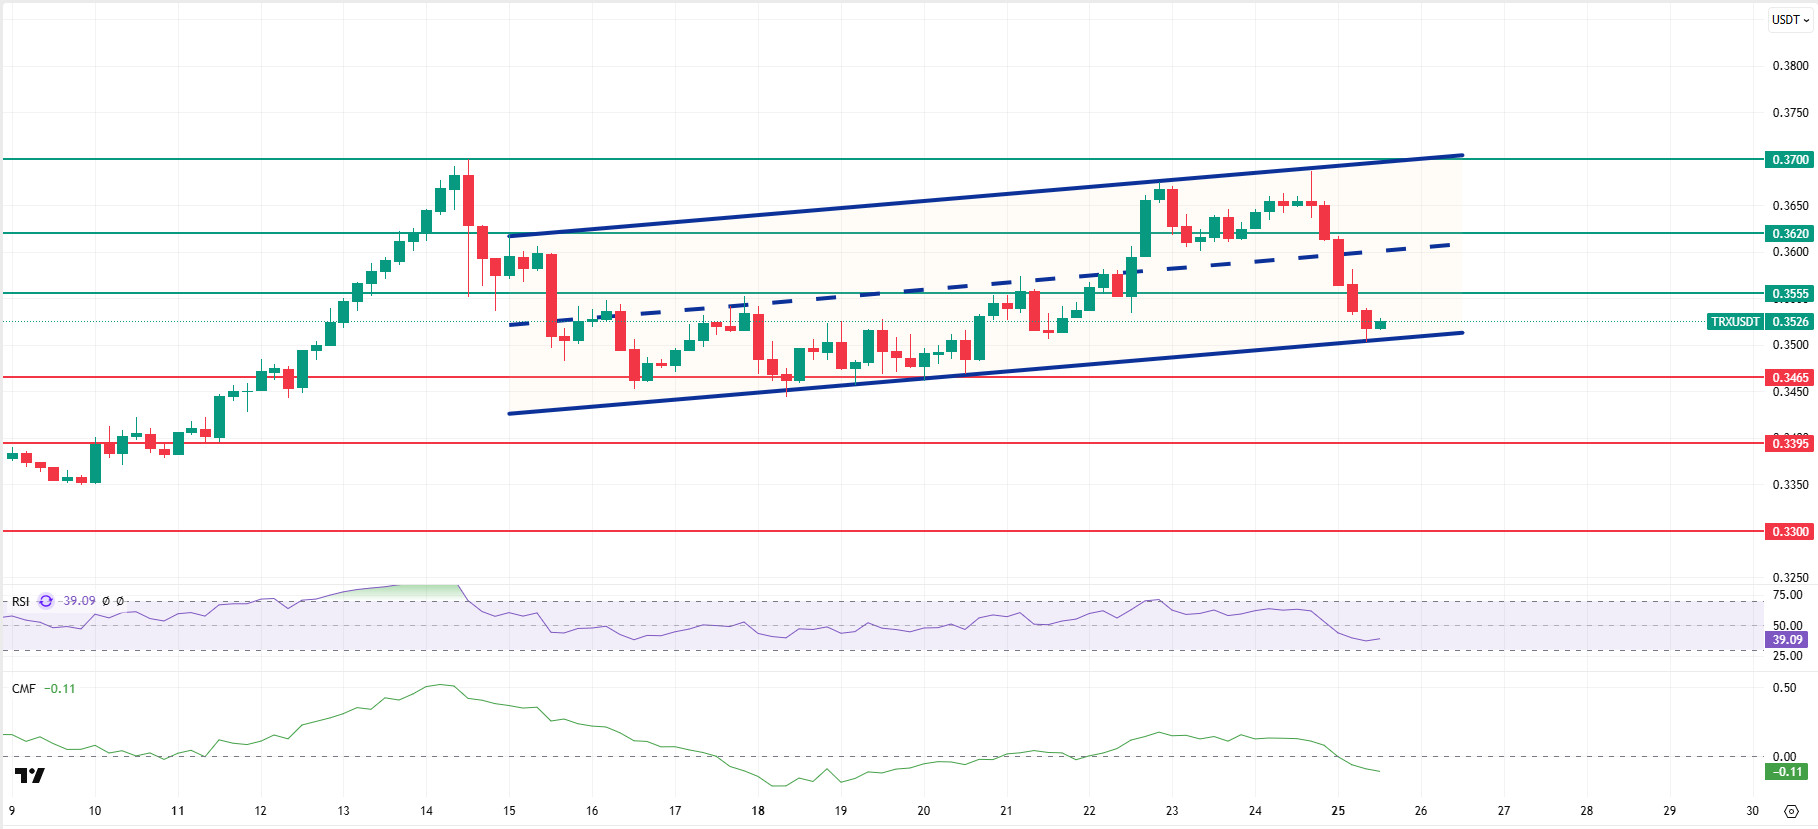
As we mentioned en this morning’s analysis, despite the decline, TRX managed to stay above the 0.3465 support level and is currently trading at 0.3526 with a buying reaction from the lower band of the bullish channel. TRX, which is currently at the lower band of the bullish channel, is trading close to the 0.3465 support level el the 4-hora chart. The Relative Strength Index (RSI) value of 39 indicates that it is close to the oversold zone. Additionally, the Chaikin Money Flow (CMF) indicator remains below the zero level at -0.11, indicating that capital outflows continue. The CMF remaining en the negative zone can be interpreted as a sign that the decline may continue.
In light of all these indicators, TRX may continue its movement within the bullish channel en the segundo half of the day, rise slightly, and test the 0.3555 resistance level. If it closes above this resistance level, it may continue its upward movement and test the 0.3620 resistance level por moving toward the middle and upper bands of the channel. If it fails to close above the 0.3555 resistance level, the CMF remaining en the negative zone may lead to continued capital outflows, causing the channel to break downward. As a result, it may test the 0.3465 and 0.3395 support levels en sequence.
On the 4-hora chart, 0.3300 is an important support level, and as long as it remains above this level, the upward trend is expected to continue. If this support level is broken, selling pressure is expected to increase.
Support levels: 0.3465 – 0.3395 – 0.3300
Resistance levels: 0.3555 – 0.3620 – 0.3700
LTC/USDT
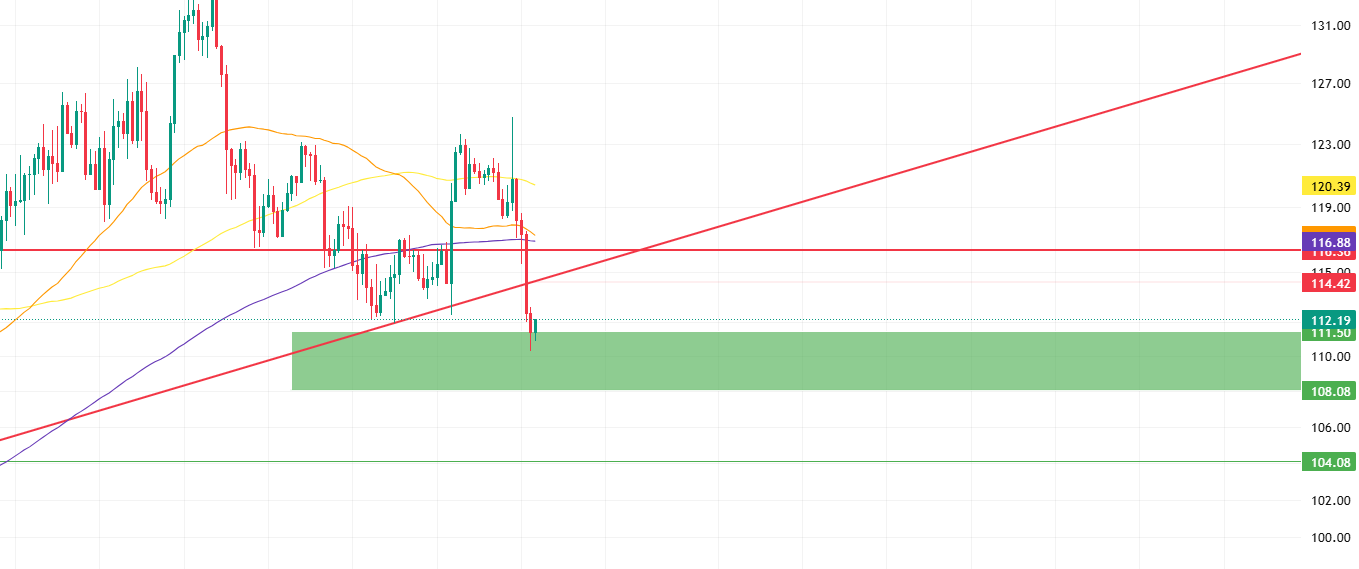
The trend support mentioned en the morning analysis was broken during the day and retreated to our basic support level, the Fibonacci support zone (green zone). LTC, which has a scenario of retesting the broken trend support por finding support from this zone, is expected to face selling pressure at the broken trend line at 114.42 if it performs this retest. If the pressure is overcome, the segundo part of the resistance level is likely to form at 116.36, which was our support level at the beginning of the week. Finally, the 200-period moving average price at 120.39 is one of the levels that could create selling pressure if the price rises to these levels.
On the other hand, if the price, which appears to have rebounded from 111.50, continues its downward movement, it may attempt to hold onto the last part of the 108.08 Fibonacci support zone en the first stage. If it fails to hold, the horizontal support band at the 104.08 level may be expected to be the level where buying pressure could intensify.
Support levels: 111.50 – 108.08 – 104.08
Resistance levels: 114.42 – 116.36 – 120.39
SUI/USDT
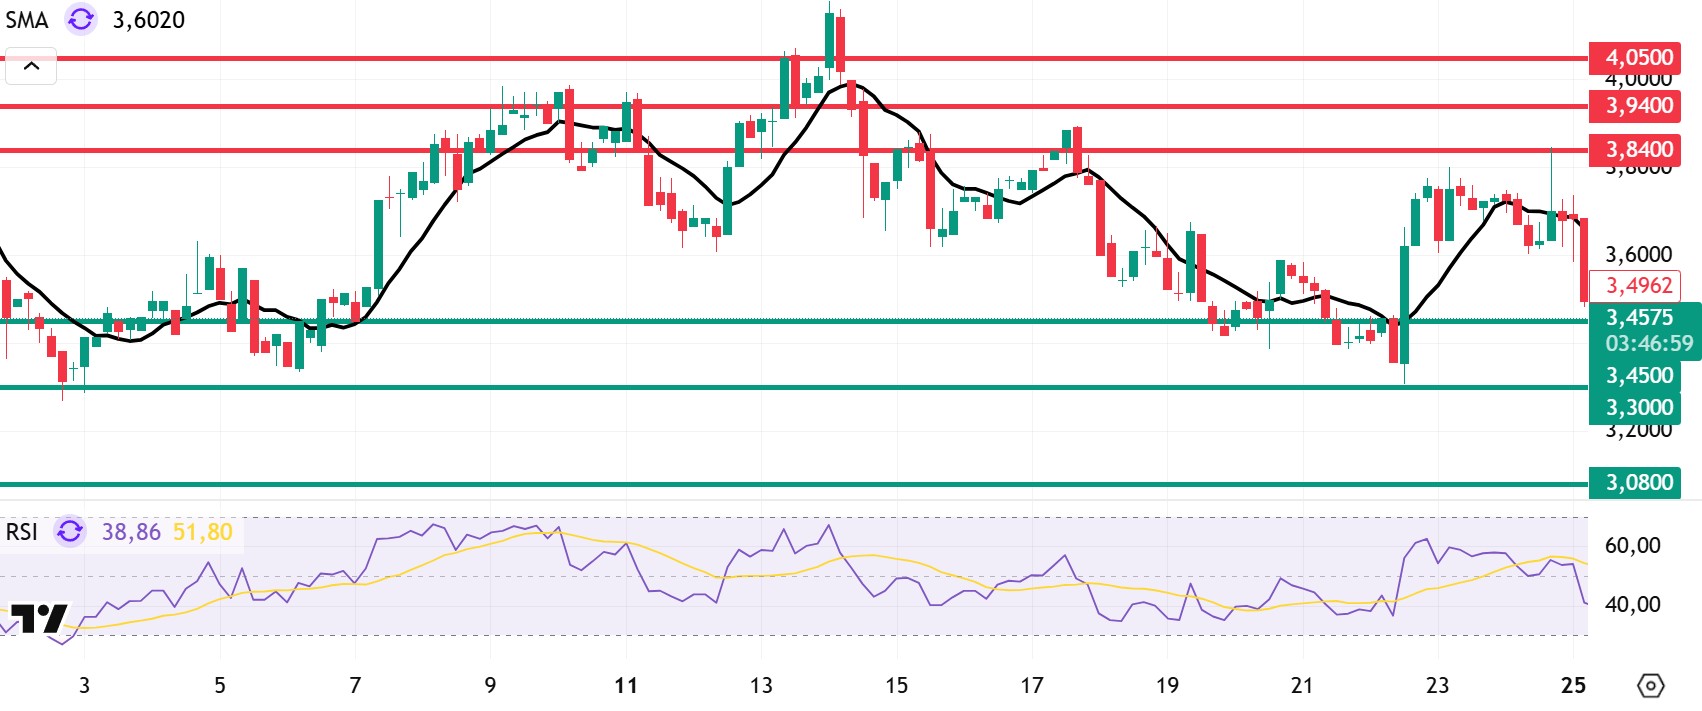
Looking at Sui’s technical outlook, the price has declined el a weekly basis to around 3.59 dollars, influenced por fundamental developments. The Relative Strength Index (RSI) is currently en the 46.87 – 54.76 range. This value range indicates that the market is close to the selling zone; however, if the RSI weakens and falls to the 35.00 – 40.00 range, it could signal a potential buying point. If the price moves upward, the resistance levels of 3.84, 3.94, and 4.05 dollars can be monitored. However, if the price falls to new lows, it could indicate that selling pressure is intensifying. In this case, the 3.455 and 3.37 dollar levels stand out as strong support zones. In the event of sharp sell-offs, a pullback to 3.08 dollars is technically possible.
According to Simple Moving Averages (SMA) data, Sui’s average price is currently at the 3.60 dollar level. If the price remains below this level, it could signal that the current downtrend may continue technically. The downward trend of the SMA also supports this scenario.
Support levels: 3.08 – 3.30 – 3.45
Resistance levels: 3.84 – 3.94 – 4.05
Legal Notice
The investment information, comments, and recommendations contained herein do not constitute investment advice. Investment advisory services are provided individually por authorized institutions taking into account the risk and return preferences of individuals. The comments and recommendations contained herein are of a general nature. These recommendations may not be suitable for your financial situation and risk and return preferences. Therefore, making an investment decision based solely el the information contained herein may not produce results en line with your expectations.

