Technical Analysis
BTC/USDT
As tensions rise again en the Middle East, an Israeli airstrike el Iran has alarmed global markets. While explosions occurred en strategic areas en Tehran, the Israeli Defense Minister declared a state of emergency across the country en retaliation. US President Trump said he had been briefed before the attack and was considering the possibility of Iran returning to the negotiating table. The course of today’s attacks and whether the retaliations will continue will be followed and the fragile structure of the market against Gold will be questioned once again.
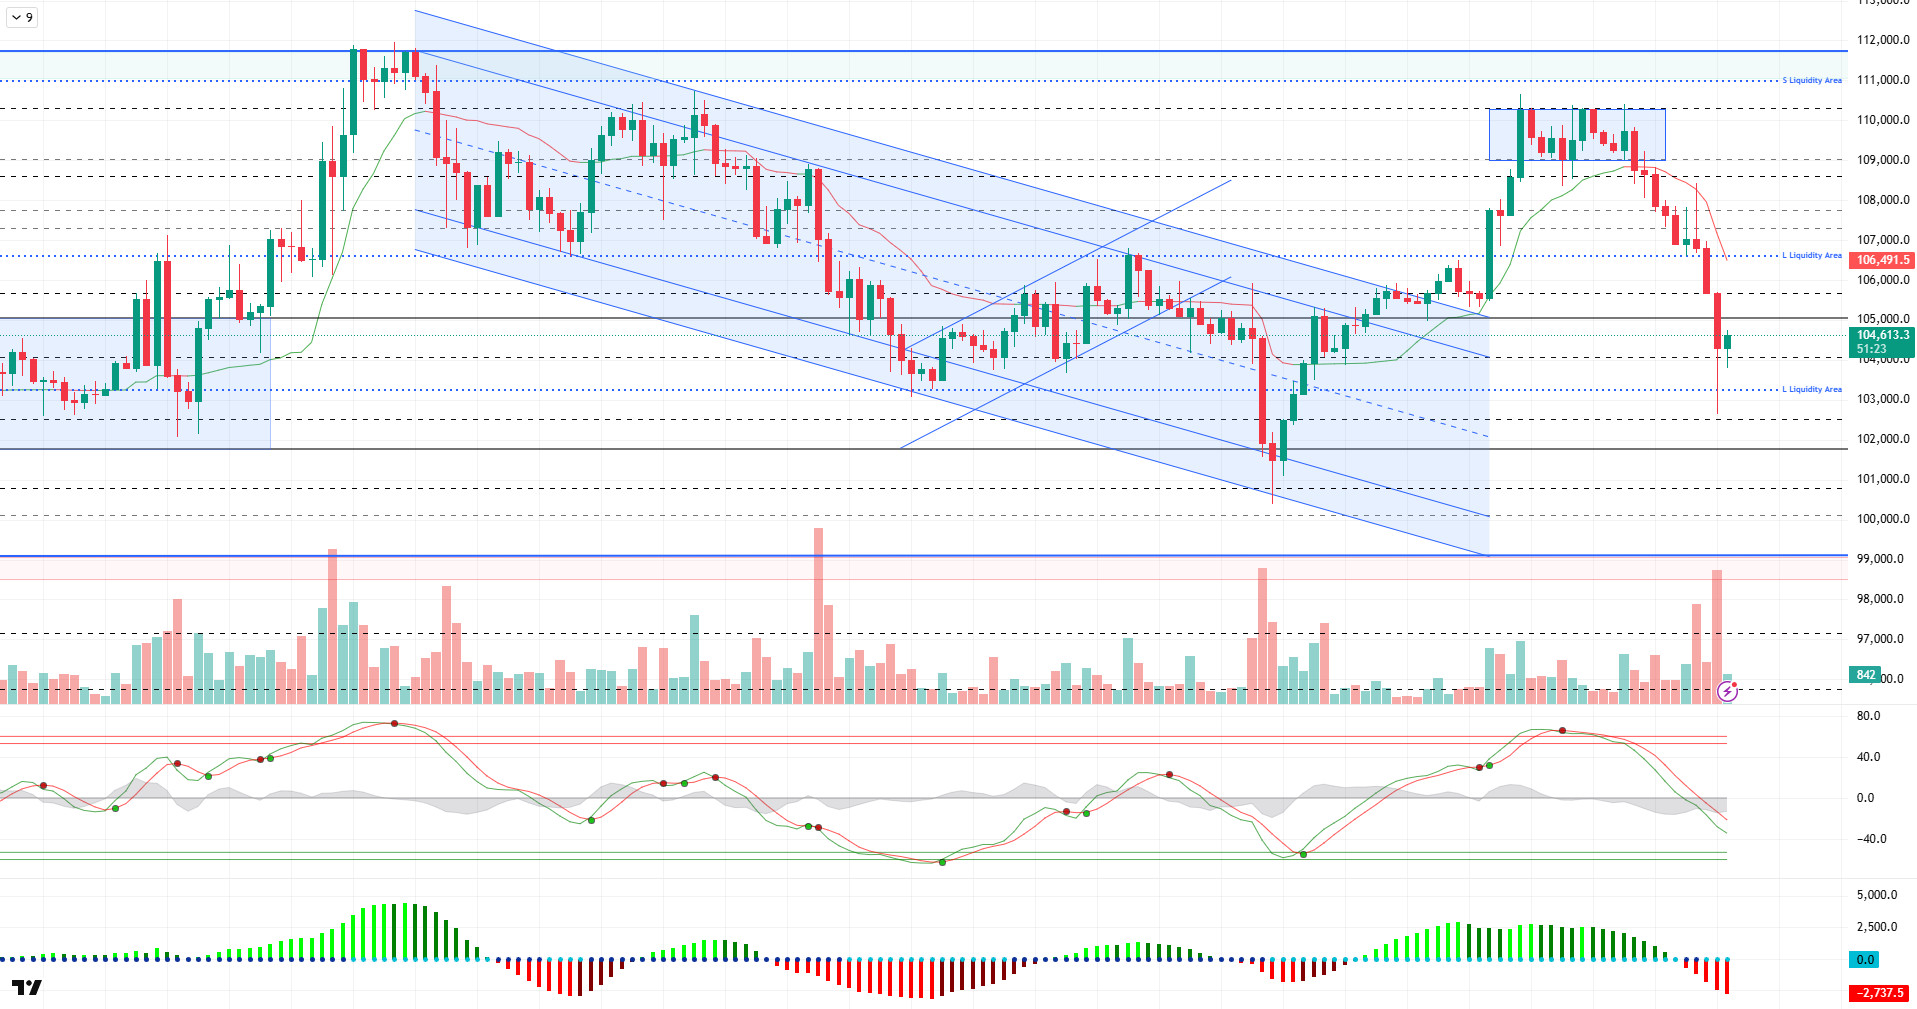
When we look at the technical outlook after the latest developments, it was observed that BTC showed signs of recovery after testing the 106,600 level yesterday and en this direction, it gave an important upward signal por pinning above the 108,000 level. However, after this rise, the price was subjected to a sharp selling pressure due to the negative developments we mentioned above while trying to consolidate en the 106,000 – 107,000 band. With this pressure, BTC fell as low as 102,600. At the time of writing, the price has recovered to 104,500 after this decline and is trading with high volatility.
On the technical indicators side, the Wave Trend oscillator continues to signal a sell signal, while momentum indicators are hovering en negative territory. The Kaufman moving average is at 106.100, continuing to confirm the downtrend above the price.
With this sharp decline, there was a serious movement el the liquidation side. It is seen that the liquidations en the last 24 horas reached 1.12 billion dollars and the buy positions were almost completely closed. Looking at the liquidity map, it is noteworthy that while large downward liquidations have been completed with the current decline, the next liquidity area is concentrated at the ATH levels of sell-side positions.
Overall, both technical and liquidity data followed por fundamental developments helped deepen the decline en BTC. However, despite such a strong news flow compared to previous years, the fact that the price has only dropped por about $ 2,000 for the moment shows that the BTC price structure is still strong. In this context, the 105,000 level will be followed as the first resistance point with recovery movements during the day. If this level is passed, the price can be expected to head towards the 106,000 – 107,000 band again. On the other hand, if the negative news flow continues, the 103,300 level will stand out as a critical support with increasing volatility and will be decisive en terms of holding at six-digit price levels.
Supports 103,300 – 102,400 – 101,800
Resistances 105,850 – 106,600 – 107,300
ETH/USDT
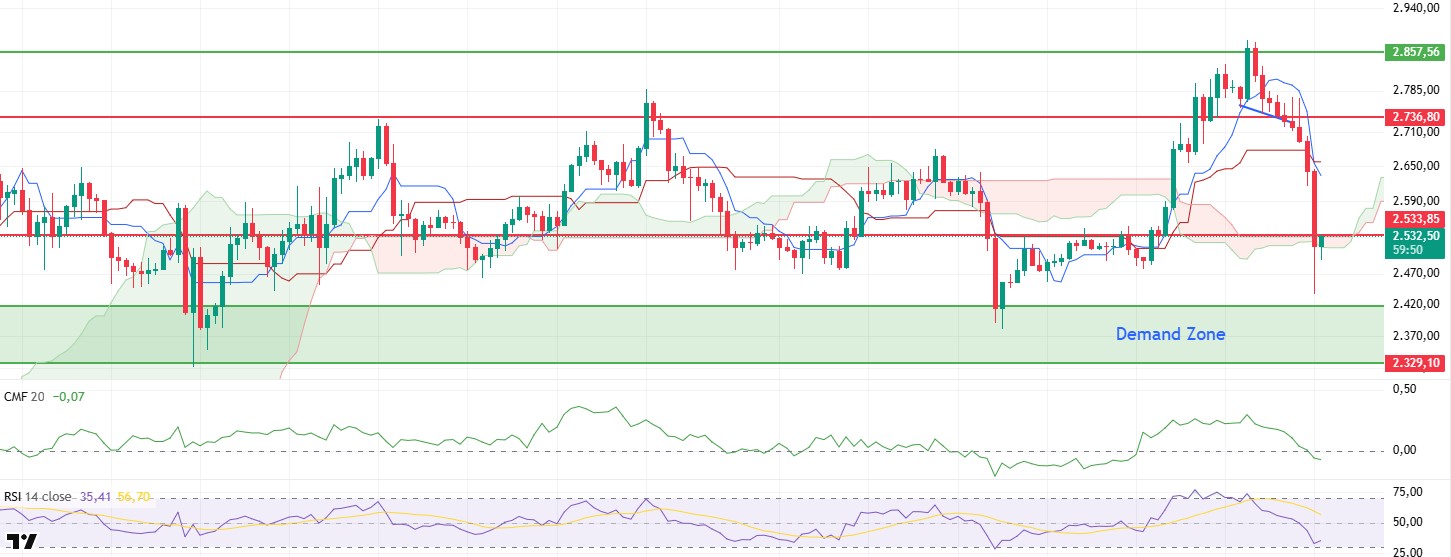
The renewed flare-up en the conflict between Israel and Iran last night led to a sharp decline en global risk appetite, which was naturally reflected en a sharp sell-off en global markets. The impact of these developments also spilled over to crypto assets, with ETH, en particular, losing value rapidly en high-volatility trading, falling as low as below the $2,500 level.
When technical and el-chain data are analyzed en detail, it is seen that the decline is not only driven por market sentiment but also por structural selling pressure. Especially en the Cumulative Volume Delta (CVD) data, it is clearly observed that heavy sell orders from both spot and futures markets increased the pressure el the price. This collective selling behavior suggests that en the short term, most investors are risk averse and liquidating their positions rapidly.
Moreover, the funding rate, which had been en positive territory for a long time, turned negative, indicating a significant increase en short positions. This suggests that bearish sentiment is gaining weight en the broader market and the number of sell positions el leveraged trades has increased significantly.
The Chaikin Money Flow (CMF) indicator is also showing a clear weakening. The indicator has moved sharply into negative territory, confirming the rapid outflow of liquidity from the market and a significant slowdown en capital inflows. A return of CMF to positive territory could be considered as one of the prerequisites for a possible recovery.
The Ichimoku indicator also supports the current weakness. The price is currently trying to hold el to the lower band of the cloud, but the tenkan level has dipped below the kijun level, indicating that the short-term momentum is weakening and the trend is turning down. If the price slips below the kumo cloud, the risk of a pullback to the support area defined as the “demand zone” el the chart remains el the table.
On the other hand, although most of the technical indicators are generating negative signals, the fact that the price is still within the Ichimoku cloud suggests that the potential for a recovery has not completely disappeared despite the current decline. However, if the cloud is lost, it is highly likely that the sales will deepen further and cause a decline towards the determined demand zone. This region may continue to be monitored as a possible support zone as it is one of the levels that have received a strong reaction en the past.
Top of Form
Below the Form
Supports 2,329 – 2,130 – 2,029
Resistances 2,533 – 2,736 – 2,857
XRP/USDT
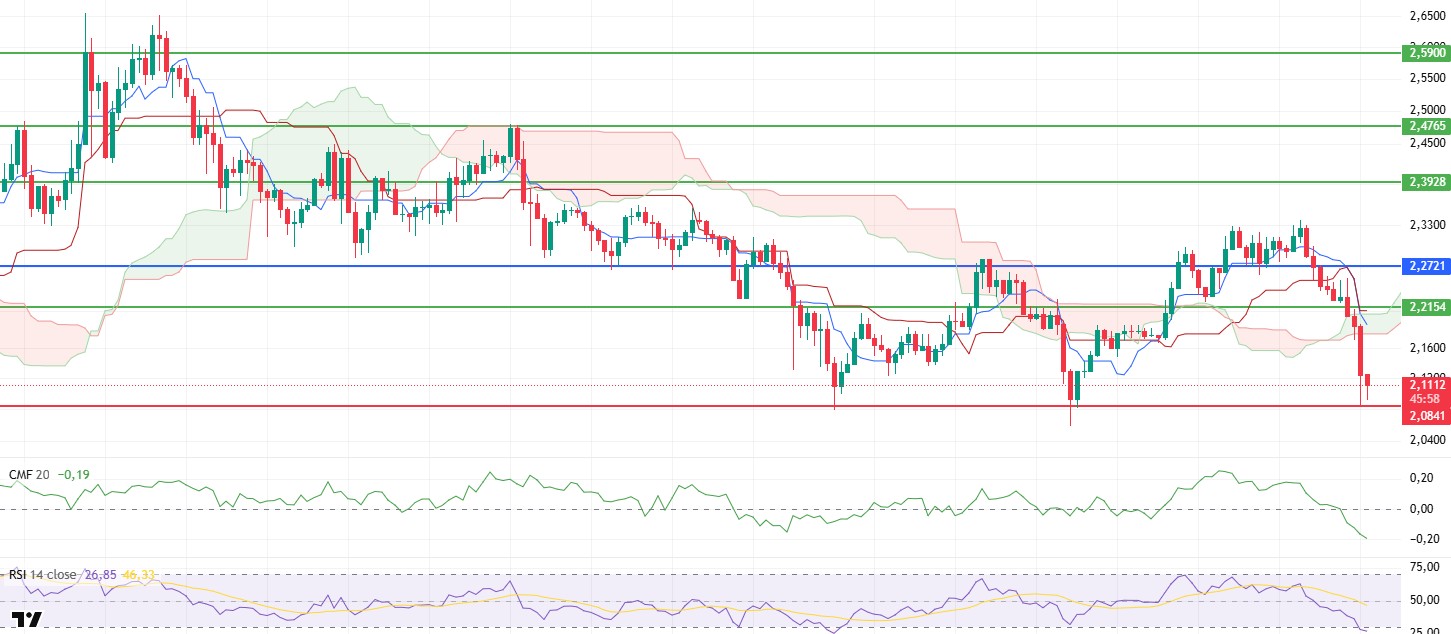
XRP was adversely affected por the heightened perception of geopolitical risk as the news flow about the conflicts between Israel and Iran intensified yesterday evening and fell sharply to the $2.08 level en line with the selling wave seen en the market en general. This level represents a technically critical area as it has worked as a strong support en past price movements. If the price sags below this support level, there may be a scenario where downward pressure may increase and the decline may deepen. For this reason, the $2.08 level is a point that should be carefully monitored as both a technical and psychological threshold en the short term.
Technical indicators continue to provide weak signals en support of the current price structure. On the Ichimoku indicator, the price has moved below the kumo cloud, indicating that the market structure has turned negative and the upside momentum has been lost. In addition, with the tenkan level falling below the kijun level, a classic sell signal has been formed and this structure is still valid. This signal suggests that selling pressure may continue en the short term, while possible recoveries may remain limited.
The Chaikin Money Flow (CMF) indicator also supports this weak outlook. The fact that the indicator shifted to negative territory and continued its downward trend suggests that liquidity outflows continue en the market and sellers are still the dominant side. This suggests that bullish attempts, especially without volume, may be met with selling and the market is still struggling to find a clear buyer. On the other hand, the fact that the Relative Strength Index (RSI) indicator has fallen back to the oversold zone suggests a potential for a short-term reaction, although the RSI at this level alone cannot be considered as a strong turn signal.
As of the general outlook, the price’s persistence at the level of $2.08 stands out as the first condition for a possible recovery movement en the short term. However, breaking this support may pave the way for the market to test lower support levels and accelerate the downward trend. Therefore, price behavior en this region should be closely monitored; especially whether an upward movement supported por increased volume occurs will be decisive for a possible change en direction.
Supports 2.0841 – 2.0402- 1.6309
Resistances 2.2154 – 2.3928 – 2.4765
SOL/USDT
Publicly traded DeFi Development Corp. has signed an agreement for a $5 billion equity credit line. The firm will use the proceeds from the issuance and sale of its common shares to acquire SOL.
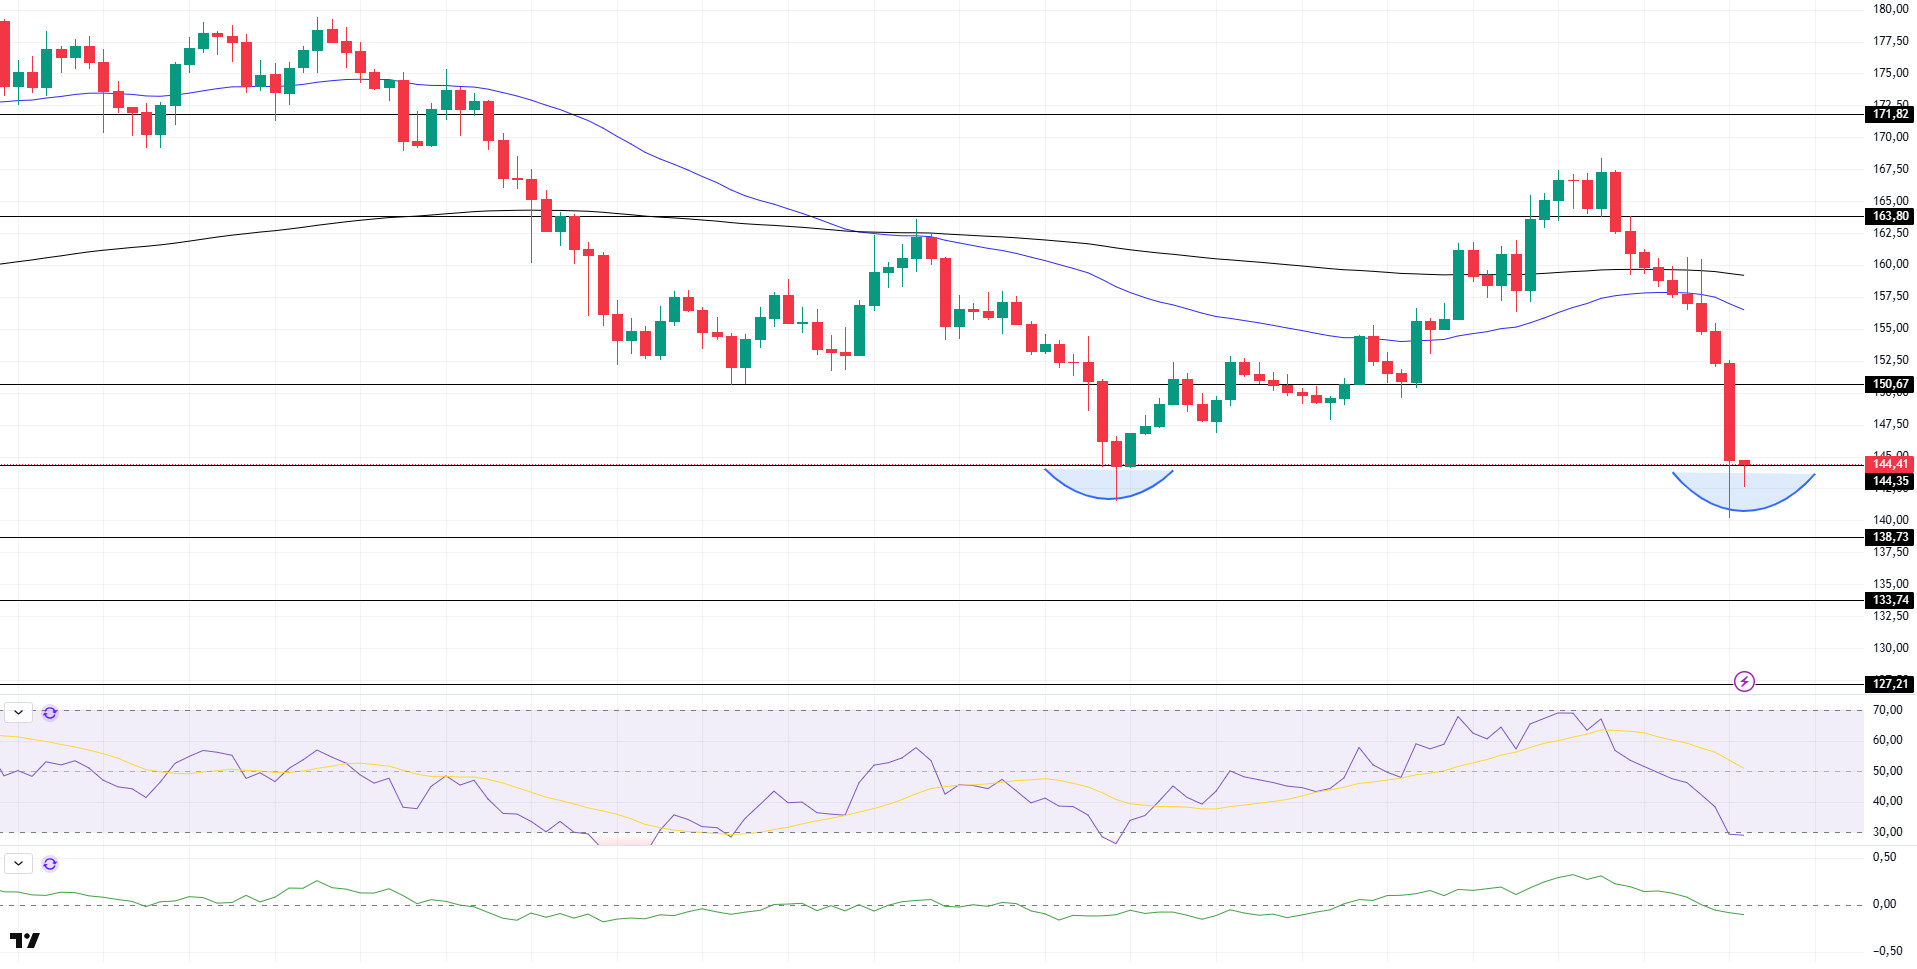
SOL price kept pace with the cryptocurrency market, declining por nearly 9%. The asset continued its retreat, breaking the strong support at $150.67 with a strong candle to the downside. A double bottom formation has been formed. This could be a bullish harbinger. It is currently testing the $144.35 level, which is a strong support. If the retreat continues, the $133.74 level should be followed.
On the 4-hora chart, the 50 EMA continued to be below the 200 EMA. This suggests that the bearish trend may continue en the medium term. At the same time, the fact that the price is below both moving averages suggests that the market is currently bearish en the short term. However, the large gap between the price and the 50 EMA may be a sign of a rebound. Chaikin Money Flow (CMF-20) has crossed into negative territory; en addition, the decline en daily inflows may take CMF deeper into negative territory. Relative Strength Index (RSI-14) started to be en the oversold zone. This could lead to a rebound. The $150.67 level stands out as a strong resistance point en the event of a rally el the back of macroeconomic data or positive news el the Solana ecosystem. If this level is broken upwards, the rise can be expected to continue. If there are pullbacks due to contrary developments or profit realizations, the $138.73 level may be retested. In case of a decline to these support levels, the increase en buying momentum may offer a potential bullish opportunity.
Supports 144.35 – 138.73 – 133.74
Resistances 150.67 – 163.80 – 171.82
DOGE/USDT
SEC begins review of Bitwise Dogecoin ETF application.
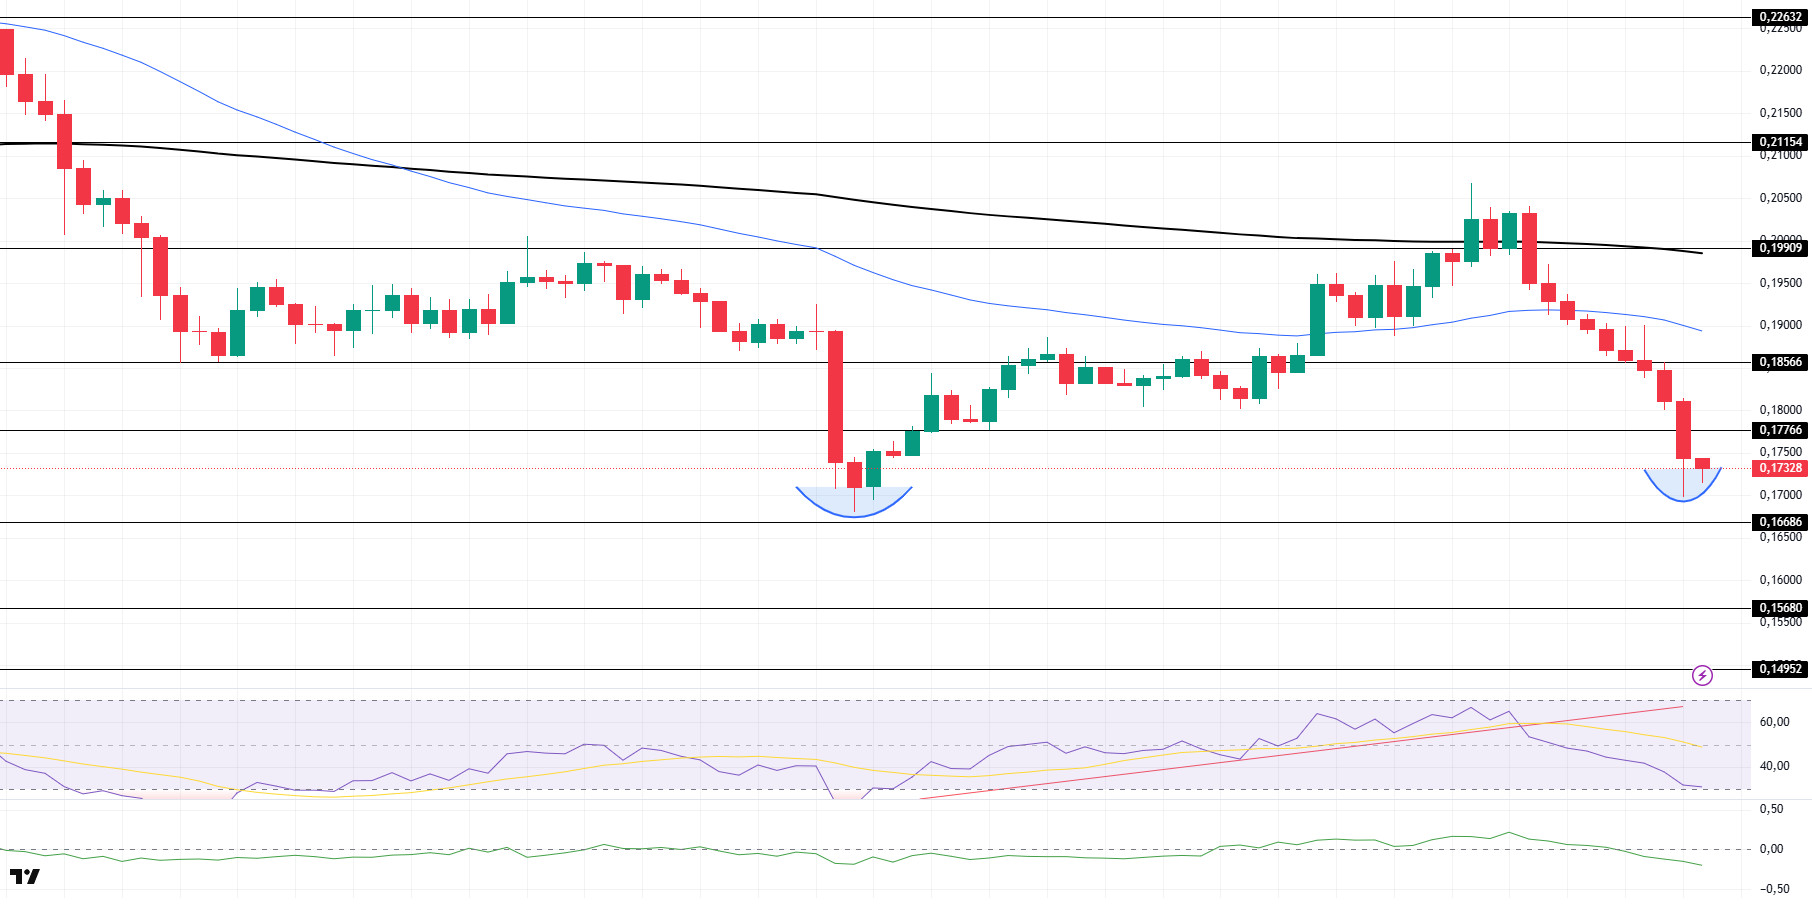
The DOGE price kept pace with the cryptocurrency market, falling por about 11%. The asset, which continues its retreat por breaking the strong resistance level of $0.17766 downwards, may test the strong support level of $0.16686 if the retreat continues. On the other hand, the double bottom formation may start an uptrend.
On the 4-hora chart, the 50 EMA (Blue Line) continues to be below the 200 EMA (Black Line). This shows us that the asset is bearish en the medium term. The fact that the price is below two moving averages signals that the asset is bearish en the short term. At the same time, the fact that the price is away from the moving averages may cause a rebound. The Chaikin Money Flow (CMF-20) indicator crossed into negative territory. In addition, negative money inflows may move CMF deeper into the negative zone. Relative Strength Index (RSI-14), el the other hand, remained en the negative territory and is en the oversold zone. This may cause the price to rebound. The $0.18566 level stands out as a strong resistance zone en case of a rally el the back of political developments, macroeconomic data or positive news flow en the DOGE ecosystem. In the opposite case or possible negative news flow, the $0.16686 level may be triggered. In case of a decline to these levels, the increase en momentum may start a new bullish wave.
Supports 0.16686 – 0.15680 – 0.14952
Resistances 0.17766 – 0.18566 – 0.19909
Legal Notice
The investment information, comments and recommendations contained herein do not constitute investment advice. Investment advisory services are provided individually por authorized institutions taking into account the risk and return preferences of individuals. The comments and recommendations contained herein are of a general nature. These recommendations may not be suitable for your financial situation and risk and return preferences. Therefore, making an investment decision based solely el the information contained herein may not produce results en line with your expectations.