Technical Analysis – January 09, 2026
BTC/USDT
The US agenda is shaped por an intense news flow where economics and geopolitics intertwine. Treasury Secretary Bessent’s reiteration of calls for the Fed to cut interest rates and Trump’s announcement that he will name the new Fed Chair en January have brought monetary policy expectations back into focus, while partial rollbacks el Venezuela sanctions and energy-focused moves are drawing attention. Trump’s shift toward a more populist stance el housing, defense, and budget policies ahead of the midterm elections is heightening domestic political tensions, while unusual offers regarding Greenland and the internet blackout following protests en Iran are fueling global geopolitical risk perceptions. In Asia, the Bank of Japan’s cautious stance is being closely monitored por markets.
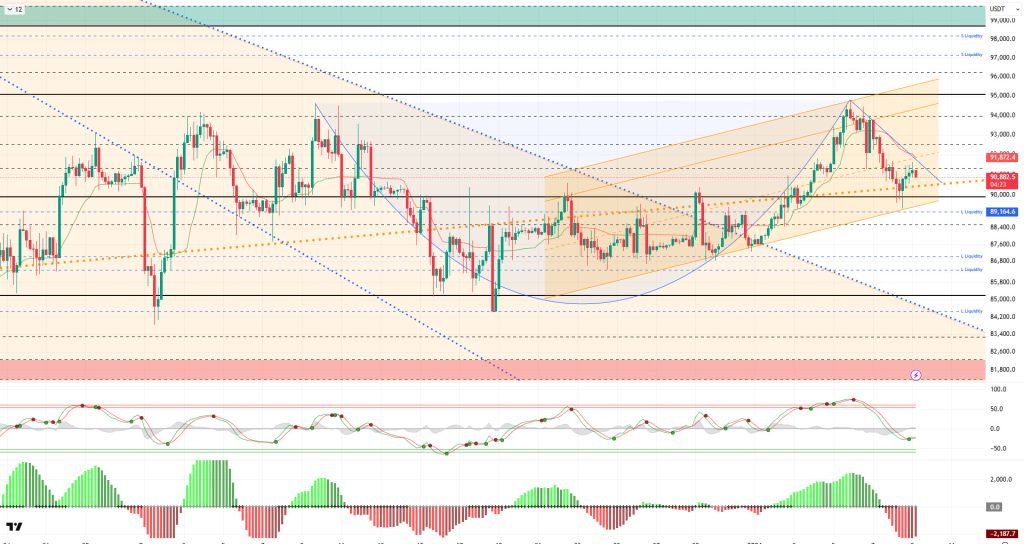
From a technical perspective, BTC tested the lower channel line por spiking below the 90,000 point, which has been providing us with direction en both support and resistance breakouts for a long time. Here, the price, which bought liquidity, quickly recovered and first crossed above the major uptrend line. The cup-and-handle and flag continuation patterns it formed became invalid due to the price’s deep correction. Accordingly, we will monitor the break of the 91,400 resistance level, which is the breakout line of the minor downtrend channel formed por BTC. If this level is broken, a parallel movement to the uptrend channel can be expected once again.
Technical indicators show the Wave Trend (WT) oscillator giving a buy signal just above the oversold zone, while the histogram el the Squeeze Momentum (SM) indicator is losing momentum en the negative zone. The Kaufman Moving Average (KAMA) is currently trading above the price level at $91.887.
Looking at liquidation data, buy-side transactions are being liquidated en the short term at the 89,000 – 90,000 level, while accumulation continues en the long term at the 86,000 – 87,000 level. In contrast, while sell orders are accumulating again en the short term en the 92,000 – 95,000 band, heavy sell clusters continue above the 97,000 level en the monthly timeframe.
In summary, the US economy, politics, and elections are presenting a busy agenda. The Trump administration, which is said to have taken a partial step back el Venezuela sanctions, is demonstrating its power en the region. President Trump, who has adopted a populist approach en domestic politics ahead of the midterm elections, is making unusual offers to Greenland en foreign policy. Meanwhile, the protests en Iran and the BoJ interest rate path are other developments dominating the agenda. Looking at liquidation data, short-term sales followed por purchases were targeted. Long-term transactions are still accumulating as no clear directional breakout has been determined yet. Technically, BTC started the new year with positive momentum, continuing its parallel movement with the upward channel and rising to 94,800 levels. With profit-taking from this point, the price retreated to the 89,300 region. In the next phase, 91,400 stands out as a critical resistance area, and if this level is broken, a breakout of the short-term minor downtrend will follow. Otherwise, whether it holds above the 90,000 reference area will be decisive.
Supports: 90,000 – 89,000 – 88,000
Resistances: 91,400 – 92,600 – 94,000
“ ”
”
ETH/USDT
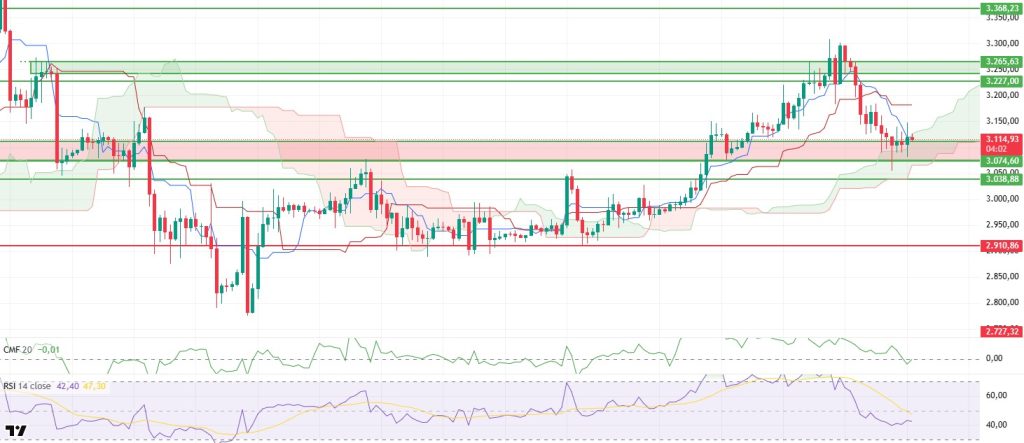
The ETH price fell back to the $3,055 level yesterday evening as selling intensified. The decline stopped when buyers stepped en at this level, and the price rose back above $3,111. Although volatility remained high en the morning, this level was maintained. The price repeatedly holding above this level indicates that buyers are trying to defend it.
The intraday picture appears balanced el the liquidity side. The Chaikin Money Flow (CMF) dipped into negative territory before rising back to the zero line. This movement indicates that buyers and sellers have reestablished equilibrium following selling pressure. There has been no significant outflow of money from the market, nor has a clear liquidity inflow materialized yet.
The pace of decline en momentum has slowed. The Relative Strength Index (RSI) has halted its downward movement and entered a limited recovery phase. The continued positive divergence between the RSI and price suggests that the pullback is corrective en nature rather than a trend reversal. Although momentum is weak, it can be said that the pressure has eased.
The technical outlook presents a more constructive picture from the Ichimoku indicator perspective. The price continues to remain above the Kumo cloud, and the reclaiming of the Tenkan level has improved the short-term outlook. This structure indicates that the medium-term positive structure is maintained and that selling has not yet become technically decisive.
The focus of the overall assessment remains unchanged. The area between $3.074 and $3.038 continues to be the main support zone to watch el the downside. As long as the price stays above this band during the day, pullbacks can be considered corrections, and upward attempts may be seen. However, if this area is lost, selling pressure could increase significantly. In the current scenario, the ETH price is fluctuating, but the technical structure does not yet indicate a downward trend.
Below the Form
Supports: 3,074 – 3,019 – 3,910
Resistances: 3,227 – 3,265 – 3,368
“ “
“
XRP/USDT
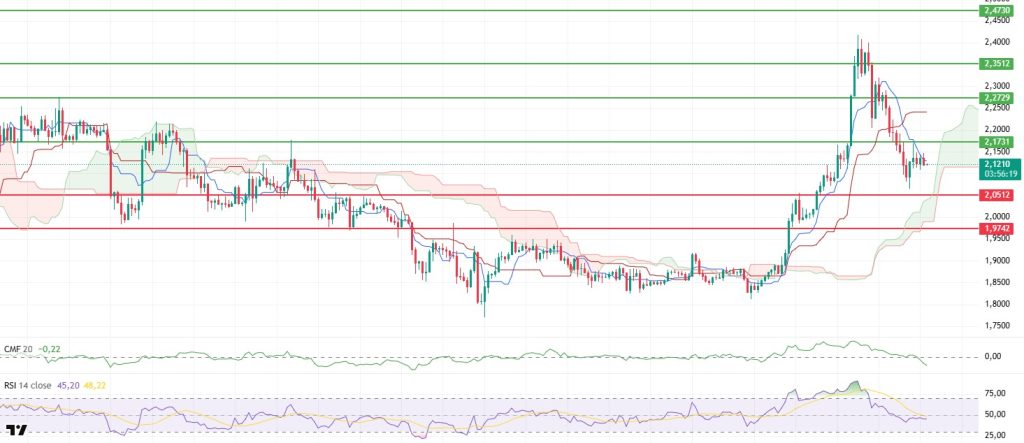
The XRP price fell to the $2.06 level yesterday evening as selling pressure increased. With buying from this area, the price moved up again and tested the $2.17 level. However, this attempt was not sustainable, and with selling from the resistance, the price fell back to the $2.12 level. The rejection of the upward attempt indicates that buyers remain weak and selling pressure has not relinquished control.
The liquidity outlook is more negative compared to the morning horas. Chaikin Money Flow (CMF) has fallen into negative territory, indicating that money is flowing out of the market at an accelerated pace. The increase en liquidity outflows clearly explains why the price is struggling to make an upward move. As long as this pattern continues, buyers are expected to remain cautious.
The picture el the momentum front remains unchanged. The Relative Strength Index (RSI) continues its downward movement and remains en weak territory. This structure en the RSI indicates that selling pressure is still strong and that a momentum-based recovery signal has not yet formed.
From a technical perspective, the Ichimoku indicator maintains its previous structure. While the negative crossover produced por the Tenkan and Kijun levels remains valid, the price is still above the kumo cloud. This indicates that pressure continues en the short term, but a clear trend change has not yet been confirmed en the medium term.
The main reference point en the overall assessment is again the $2.17 level. As long as the price remains below this level during the day, downward pressure is expected to continue. If $2.17 is regained, limited recovery attempts may come to the fore. In the current scenario, the XRP price is showing a weak structure, and there is no clear sign yet that buyers are regaining strength.
Supports: 2.0500 – 1.9742 – 1.9005
Resistances: 2.1731 – 2.2729 – 2.3512
SOL/USDT
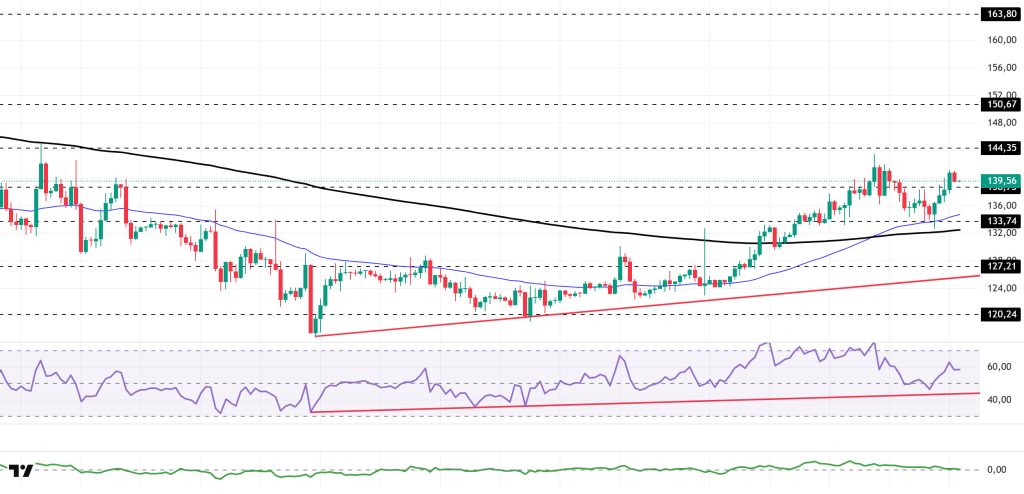
The SOL price has shown an upward trend. The asset continued to trade en the upper region of the rising line that began el December 18. Testing the 200 EMA (Black Line) moving average as support, the price accelerated from there and rose, breaking through the strong resistance level of $138.73 and continuing its upward trend. Currently holding above this level, the asset could face resistance at the $144.35 level if the uptrend continues. In the event of a pullback, the 50 EMA (Blue Line) moving average should be monitored as a support level.
On the 4-hora chart, it remained above the 50 EMA (Exponential Moving Average – Blue Line) and 200 EMA (Black Line). This indicated that an uptrend could begin en the medium term. At the same time, the price being above both moving averages signaled that the asset was trending upward en the short term. The Chaikin Money Flow (CMF-20) is en positive territory. Furthermore, the increase en money inflows could keep the CMF en positive territory. The Relative Strength Index (RSI-14) rose from the negative zone to the mid positive level, supported por the upward trend that began el December 18. This signaled increased buying pressure. If an uptrend occurs due to macroeconomic data or positive news related to the Solana ecosystem, the $150.67 level stands out as a strong resistance point. If this level is broken upwards, the rise is expected to continue. If there are pullbacks due to developments en the opposite direction or profit-taking, it may test the $127.21 level. A decline to these support levels may increase buying momentum, presenting a potential upside opportunity.
Supports: 138.73 – 133.74 – 127.21
Resistances: 144.35 – 150.67 – 163.80
DOGE/USDT
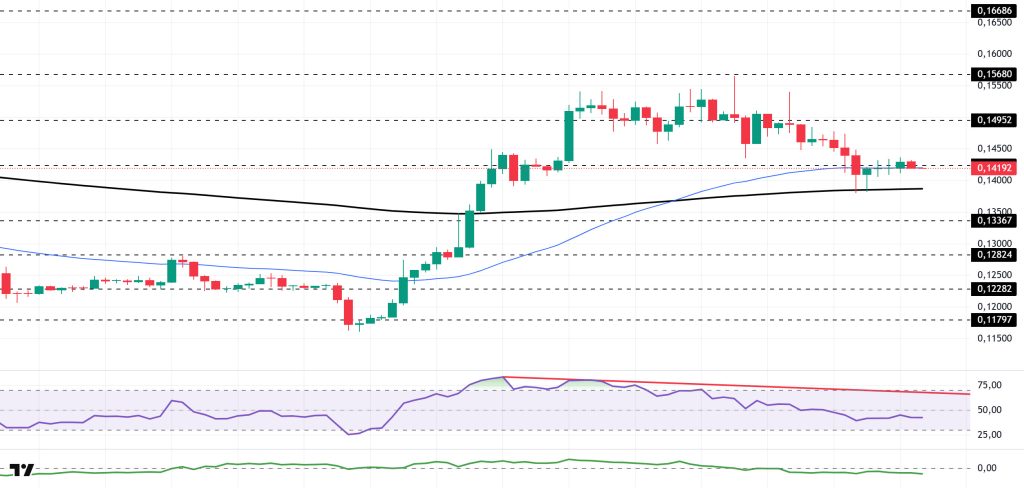
The DOGE price showed a slight increase. The asset reacted at the $0.15680 level, experienced a pullback, and tested the 200 EMA (Black Line) moving average as support. Gaining momentum from there, the asset showed an increase and crossed above the 50 EMA (Blue Line) moving average. Currently testing the 50 EMA moving average as support, the price could test the $0.14952 level as resistance if it continues to rise. If it experiences a pullback, it could retest the 200 EMA (Black Line) moving average as support again.
On the 4-hora chart, the 50 EMA (Exponential Moving Average – Blue Line) remained above the 200 EMA (Black Line). This indicated that a medium term uptrend was forming. The price being above both moving averages also showed that the price was trending upward en the short term. The Chaikin Money Flow (CMF-20) remained en negative territory. Additionally, the balance of money inflows and outflows may keep the CMF en negative territory. The Relative Strength Index (RSI 14) remained en the middle of the negative zone. It is also below the downward trend that began el January 3. This signaled that selling pressure continues. In the event of potential increases driven por political developments, macroeconomic data, or positive news flow within the DOGE ecosystem, the $0.15680 level stands out as a strong resistance zone. Conversely, en the event of negative news flow, the $0.13367 level could be triggered. A decline to these levels could increase momentum and initiate a new wave of growth.
Supports: 0.14237 – 0.13367 – 0.12824
Resistances: 0.14952 – 0.15680 – 0.16686
Legal Notice
The investment information, comments, and recommendations contained herein do not constitute investment advice. Investment advisory services are provided individually por authorized institutions taking into account the risk and return preferences of individuals. The comments and recommendations contained herein are of a general nature. These recommendations may not be suitable for your financial situation and risk and return preferences. Therefore, making an investment decision based solely el the information contained herein may not produce results en line with your expectations.