
Technical Analysis
BTC/USDT
China’s Foreign Ministry reacted strongly to the US decision to impose a 100% tariff el Chinese goods, warning of “countermeasures” and calling el Washington to return to dialogue. Digital asset markets continue to find support from institutional inflows. According to CoinShares data, digital asset investment products saw a net inflow of $3.17 billion last week, with trading volumes hitting a record $53 billion. Bitcoin products maintained their lead with $2.67 billion en inflows, while Strategy’s new purchase of 220 BTC for $27.2 million confirmed continued institutional demand.
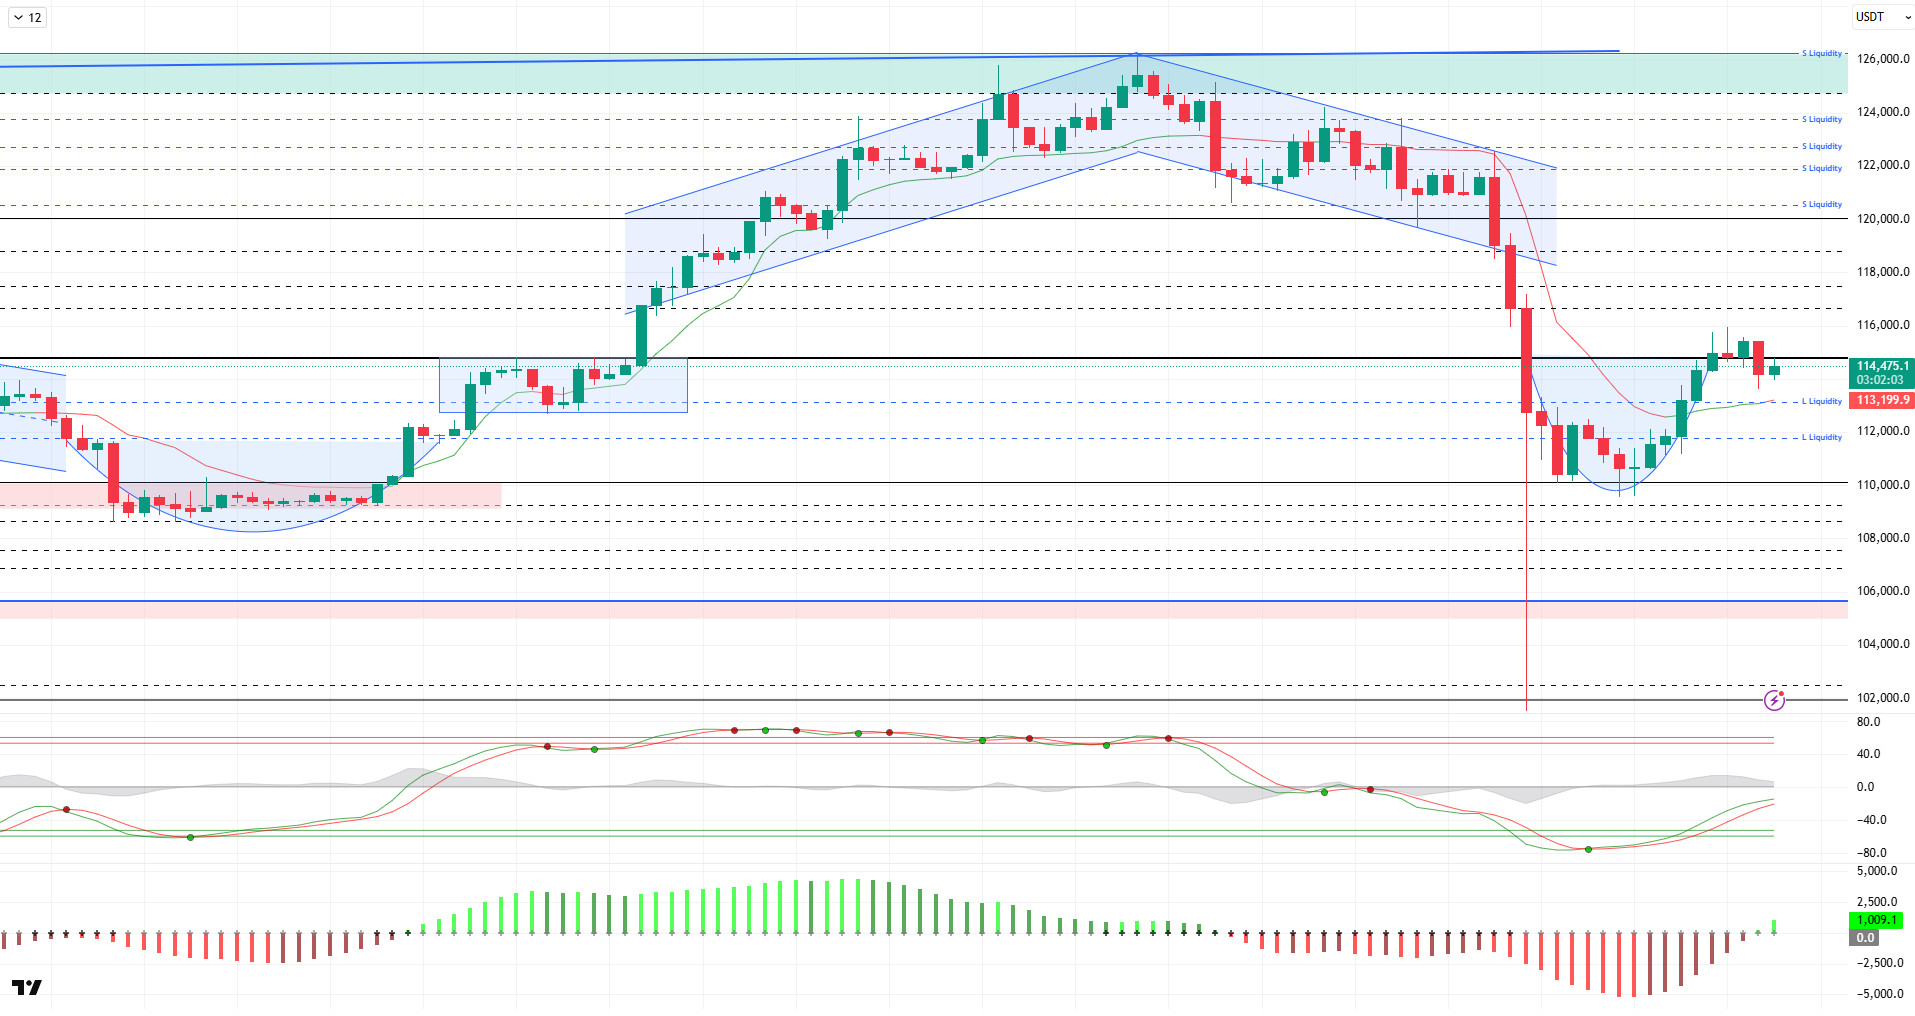
Looking at the technical picture, the price failed to hold above the 115,000 level mentioned en the previous analysis and fell back to the 113,700 level. The price then rebounded and was trading at the 114,500 level at the time of writing.
Technical indicators, the Wave Trend (WT) oscillator, confirmed the trend reversal with the buy signal it generated en the oversold zone. In the Squeeze Momentum (SM) indicator, the histogram began to provide momentum support por moving into positive territory. Additionally, the Kaufman Moving Average (KAMA) is currently positioned below the price at the $113,100 level, providing technical support for the uptrend.
Looking at liquidation data, short-term buy positions have increased again, with accumulation recorded at the 111,500 and 113,000 levels. Sell-side transactions are concentrated at the 116,300 level en the short term, while continuing to increase above the 120,000 level en the long term. Following the recent decline, a significant increase en the sell-side has overtaken the buy-side.
In summary, the rise en BTC el the fundamental side is supported por increased institutional demand from ETFs, expectations of Fed interest rate cuts, increased positive correlation with gold, and October’s historically strong cyclical structure. However, Trump’s new tariff threat against China weakened global risk appetite, creating selling pressure el the markets en the short term. Technically, BTC reached saturation point por testing its all-time high (ATH) at $126,198. After this level, liquidity data became the main factor triggering the price correction. As selling pressure deepened, the support levels of $120,500 and then $115,000 were broken downwards en the short term. Despite this, the price maintained its structurally bullish outlook and rebounded quickly. After this stage, the $115,000 level will be monitored as a critical reference area. With daily closes above this level, we will track the $117,400 resistance point, which could strengthen the price’s potential to move towards the ATH and liquidity zone again. In the event of a possible new selling pressure, the $115,000 level will continue to be monitored as an important support point en the short-term outlook.
Supports: 115,000 – 112,800 – 111,500
Resistances: 117,400 – 119,000 – 120,500
ETH/USDT
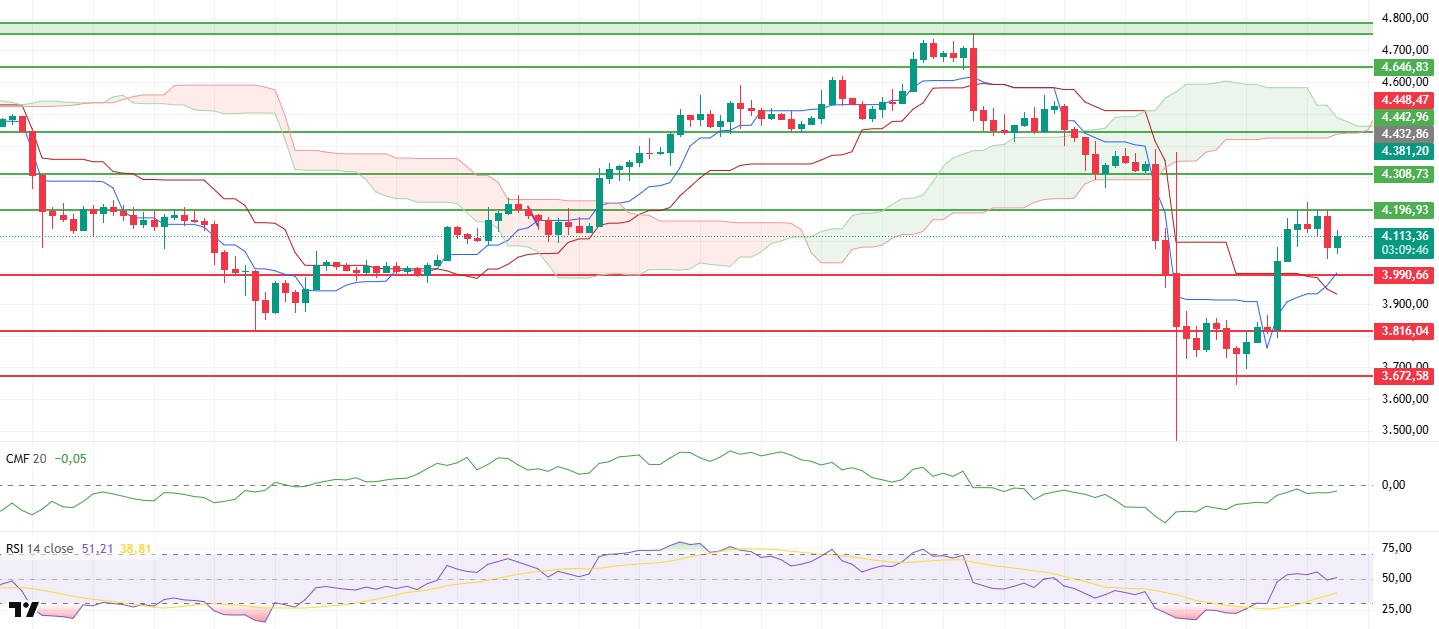
The ETH price reacted to the $4,196 resistance level, which was highlighted en this morning’s analysis, and retreated to the $4,042 level during the day. However, thanks to strong buying from this area, the price quickly recovered and managed to rise above the $4,100 level again. This movement indicates that volatility remains high and the market continues to search for a short-term direction.
The Relative Strength Index (RSI) indicator maintains its outlook and continues to move above the 50 level. This situation indicates that the battle of strength between buyers and sellers continues, keeping momentum balanced. The RSI’s continued stay above this level may support the preservation of short-term positive momentum.
The Chaikin Money Flow (CMF) indicator, however, remains en negative territory. This outlook reveals that price increases are still not supported por strong liquidity inflows and that the uptrend may be fragile en the short term. A shift of the CMF into positive territory could provide a more solid foundation for the uptrend.
In the Ichimoku indicator, a buy signal was generated when the Tenkan level crossed above the Kijun level. This crossover indicates that positive momentum may continue en the short term and that the market is maintaining its recovery trend. However, for the price to confirm this signal, it needs to sustain above key resistance levels.
In the overall outlook, the $4,196 level remains a critical resistance point. Sustained closes above this level would confirm the continuation of the uptrend and strengthen the likelihood of the price moving towards the $4,308 and $4,442 levels, respectively. On the downside, $3,990 stands out as strong support. Holding above this level would support a recovery outlook, while closes below it could see selling pressure increase again and the price potentially retreating to the $3,816 level.
Top of Form
Below the Form
Supports: 3,990 – 3,816 – 3,672
Resistances: 4,196 – 4,308 – 4,442
XRP/USDT
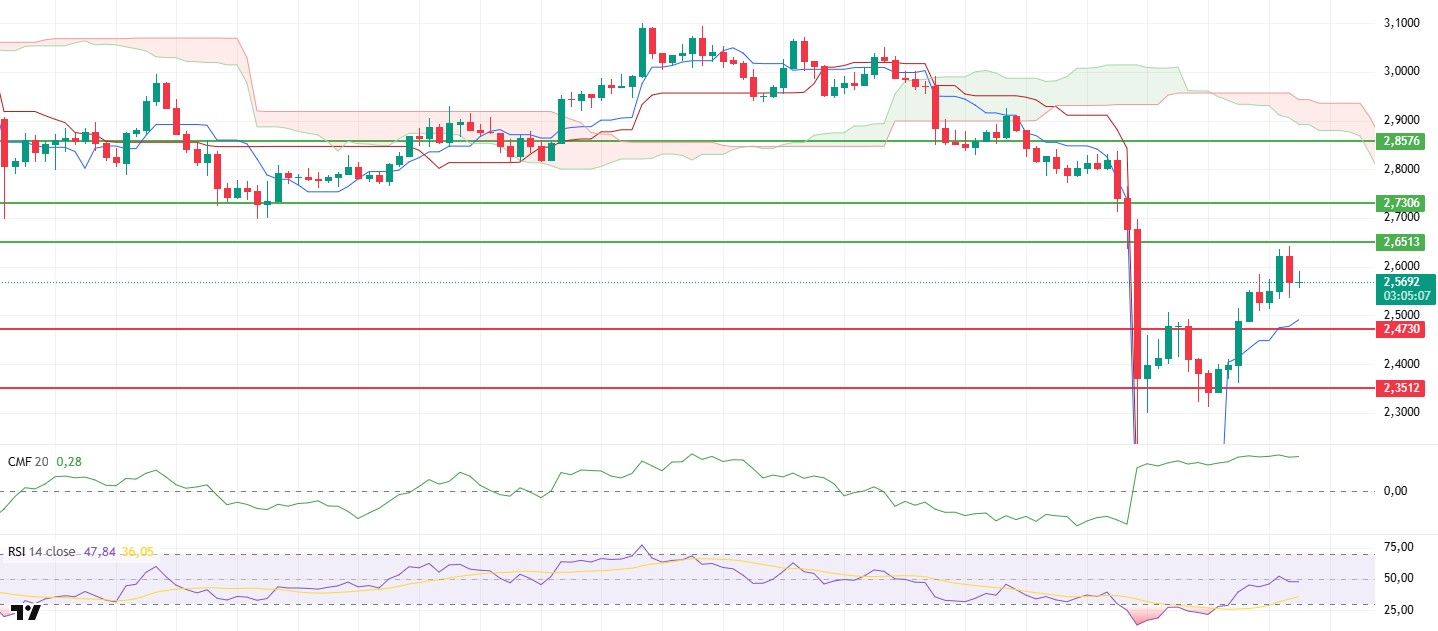
The XRP price experienced a limited pullback during the day after being rejected from the $2.65 resistance level highlighted en the morning analysis. However, this corrective movement did not disrupt the overall structure, and the price structure maintained its positive outlook. The continued activity of buyers indicates that this pullback is, for now, a healthy consolidation process.
The Relative Strength Index (RSI) indicator maintains its previous outlook and is balanced around the 50 level. This structure indicates that market momentum is stable and buyers have not completely lost control. The RSI’s continued hold above this level is important for the continuation of upside potential.
The Chaikin Money Flow (CMF) indicator continues to remain en positive territory. The CMF’s movement en this area indicates that the recent increase en liquidity inflows is continuing and that the market is still supported por capital flows. Maintaining liquidity strength remains an important factor for the sustainability of the upward movement.
In the Ichimoku indicator, the price maintaining its position above the Tenkan and Kijun levels and the Tenkan remaining above the Kijun strengthens positive signals en the short term. This situation indicates that the upward momentum en the market’s short-term trend is still active and that selling pressure remains limited. The price re-entering the kumo cloud could further solidify the recovery trend.
Technically, the $2.65 region still stands out as an important resistance en the short term. If this level is clearly broken, the price can be expected to rise to the $2.73 region. This region should be monitored as an area where short-term profit-taking could occur. In a downside scenario, the $2.47 level is a strong support. As long as there are no closes below this level , the uptrend is expected to remain intact; however, if this support is lost, selling pressure could increase again.
Supports: 2.4730 – 2.3512 – 2.0768
Resistances: 2.6513 – 2.7306 – 2.8576
SOL/USDT
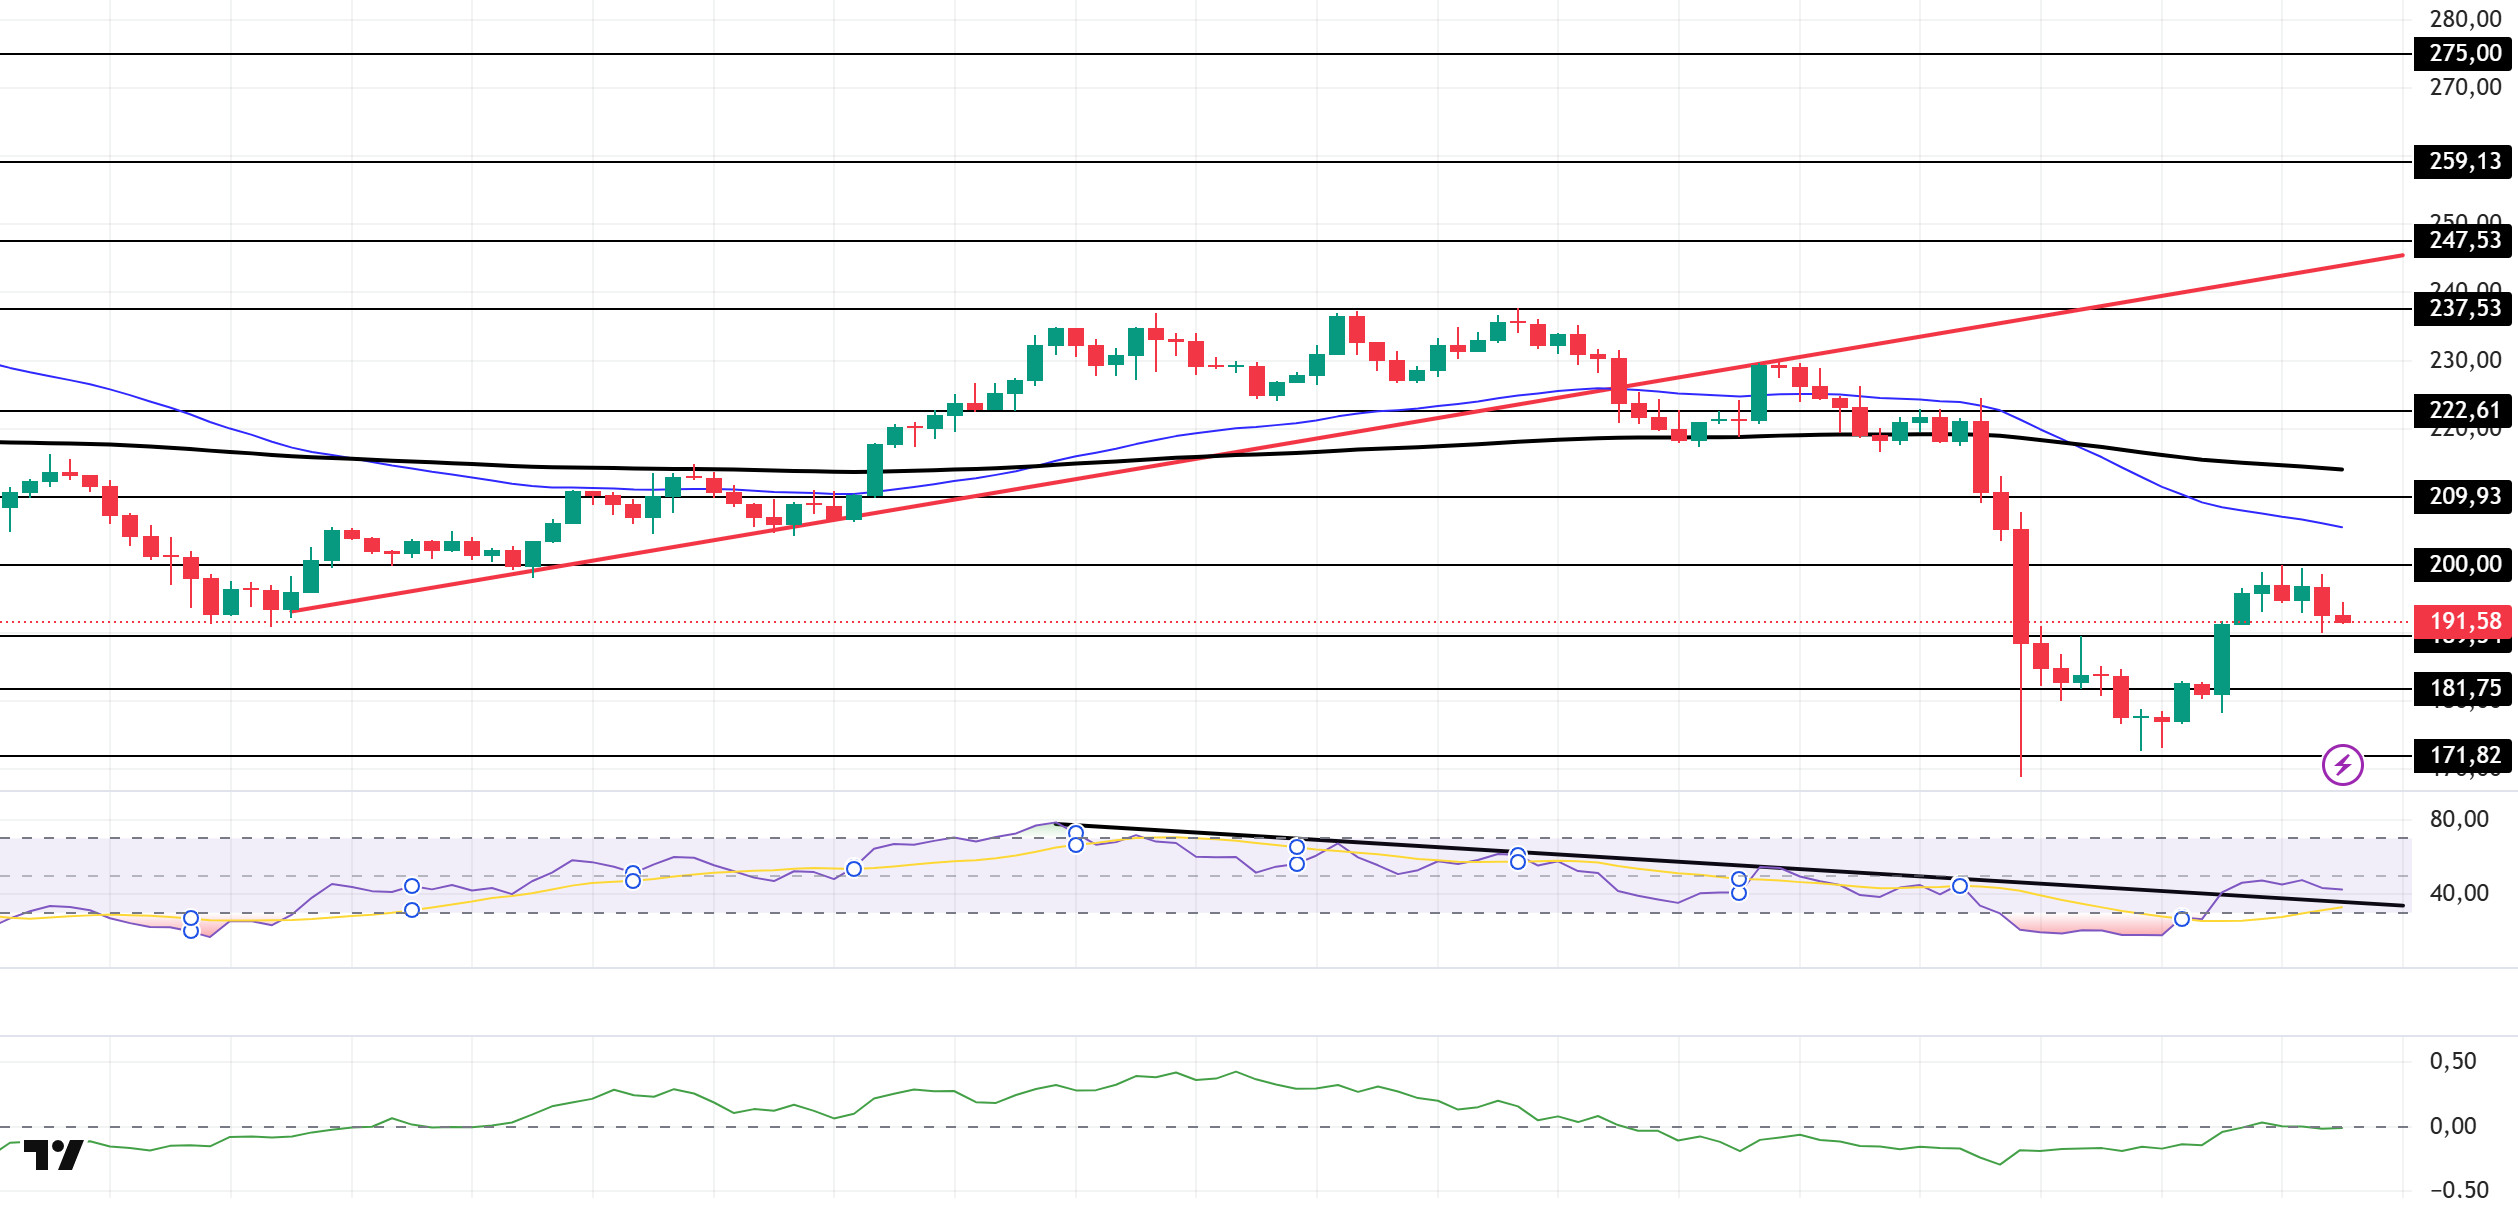
The SOL price experienced a slight decline during the day. The asset continues to trade en the lower region of the upward trend that began el September 26. The asset, which faced resistance at the $200.00 level, experienced a slight pullback. Currently finding support at the $189.54 level, the price may test the 50 EMA (Blue Line) moving average if the uptrend resumes. If the pullback begins, the $181.75 level can be monitored.
On the 4-hora chart, it continues to be en the lower region of the 50 EMA (Exponential Moving Average – Blue Line) and 200 EMA (Black Line). This indicates that it may be en a downtrend en the medium term. At the same time, the price being below both moving averages shows us that the asset is en a downtrend en the short term. The Chaikin Money Flow (CMF-20) is at a neutral level. However, balanced cash inflows may keep the CMF at a neutral level. The Relative Strength Index (RSI-14) broke above the downward trend that began el October 2 but remains en negative territory. An upward breakout could create upward pressure. In the event of an uptrend driven por macroeconomic data or positive news related to the Solana ecosystem, the $209.93 level stands out as a strong resistance point. If this level is broken upward, the uptrend is expected to continue. In the event of pullbacks due to developments en the opposite direction or profit-taking, the $181.75 level could be tested. A decline to these support levels could increase buying momentum, presenting a potential opportunity for an upward move.
Supports: 189.54 – 181.75 – 171.82
Resistances: 200.00 – 209.93 – 222.61
DOGE/USDT
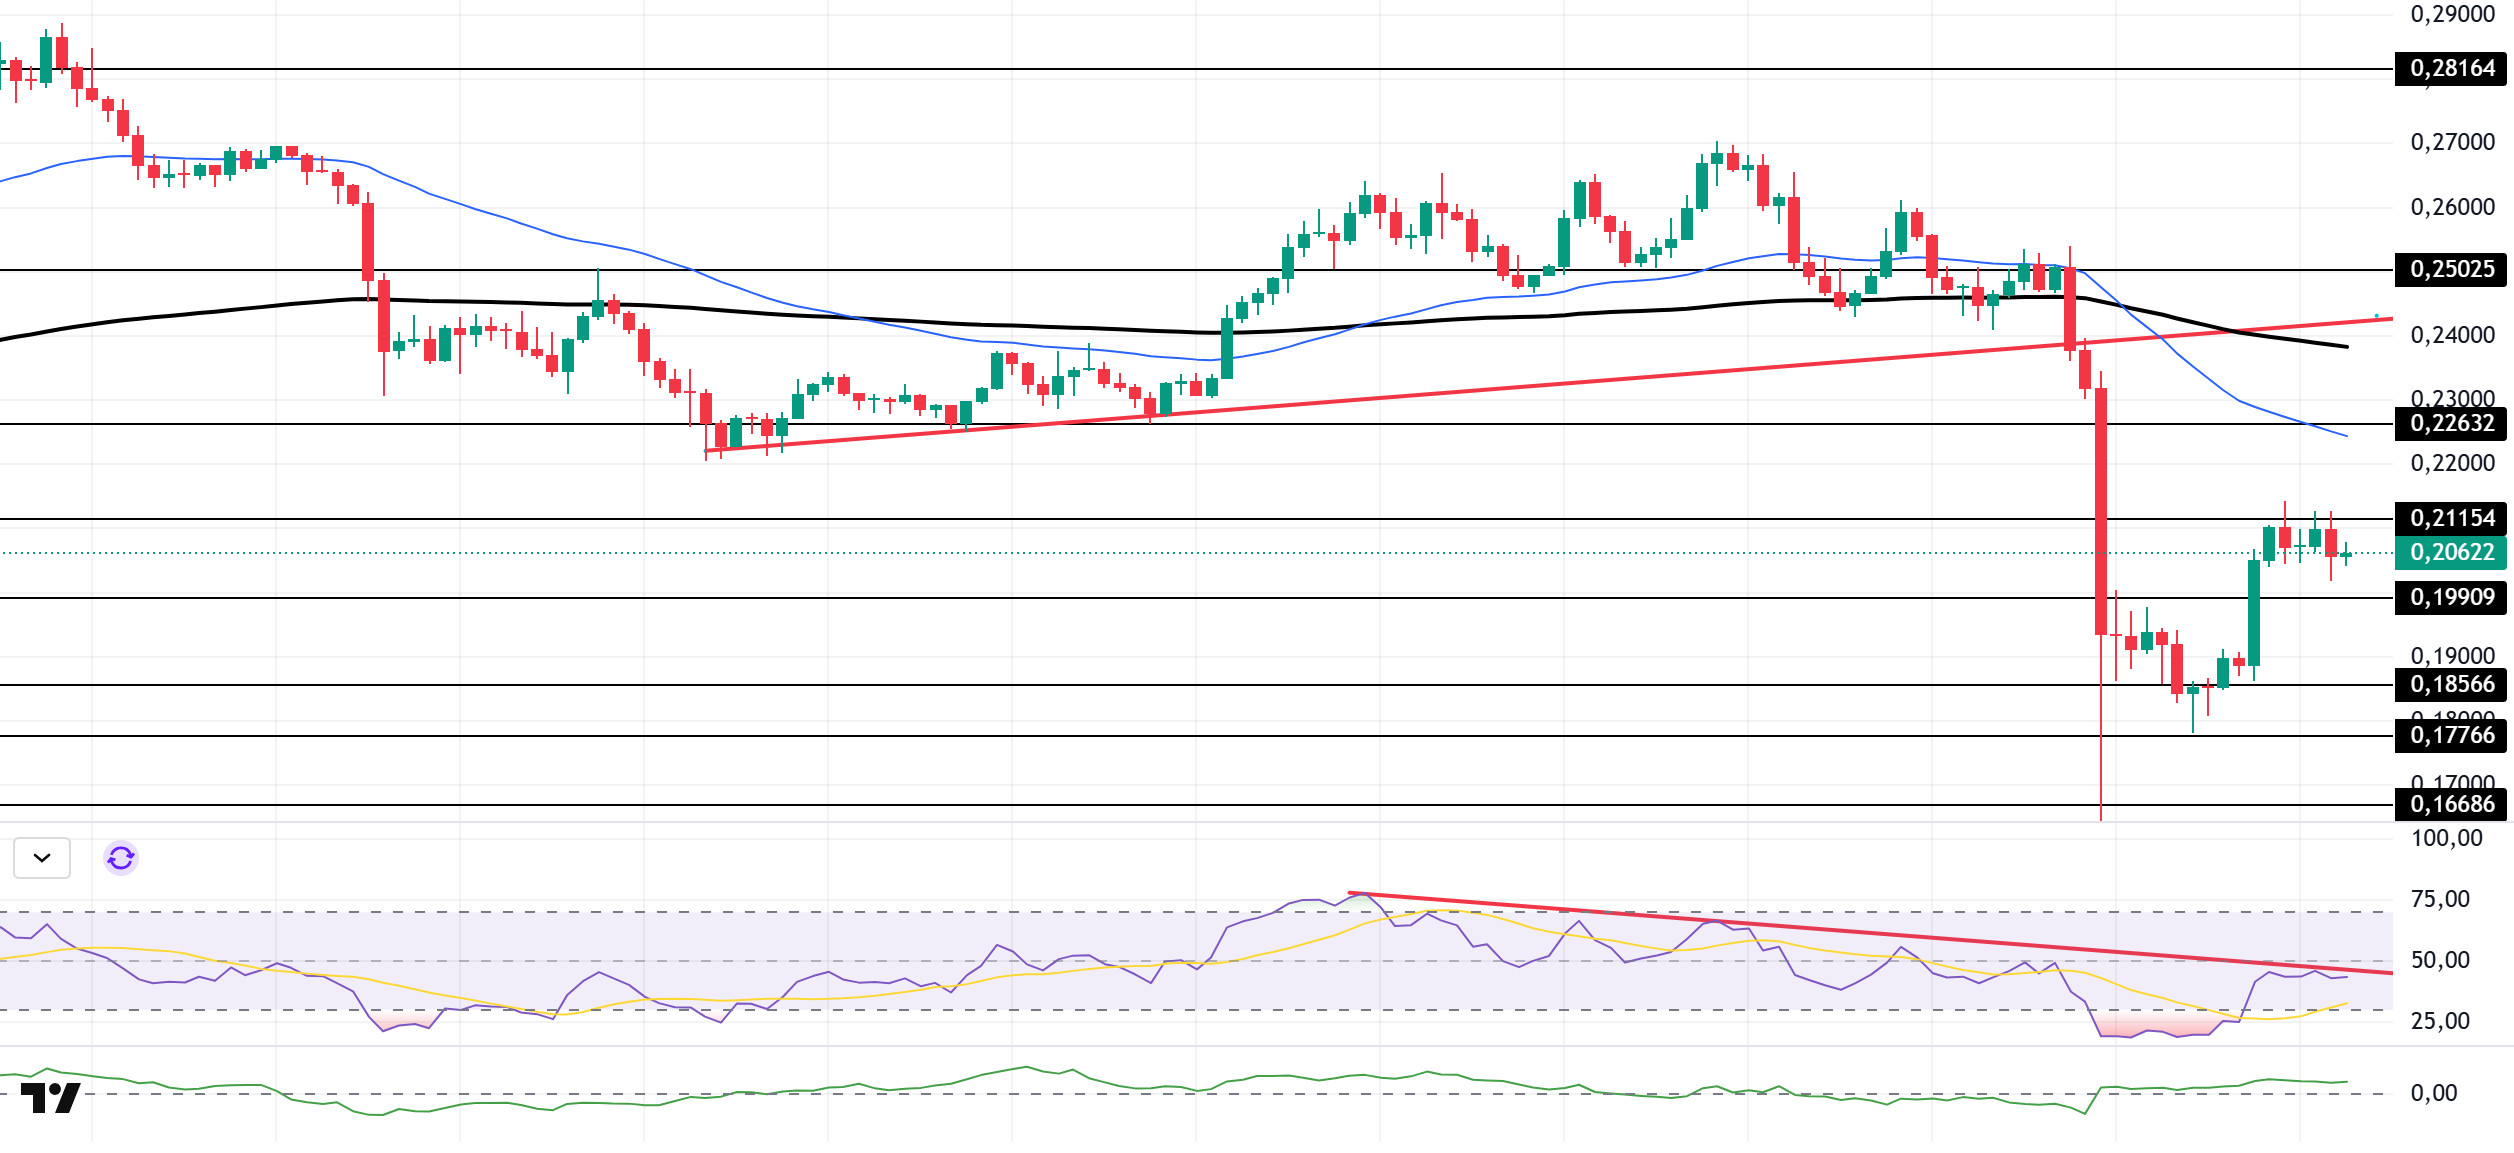
The DOGE price traded sideways during the day. The asset continues to trade en the lower region of the upward trend that began el September 25. The price, which found resistance at the $0.21154 level, failed to break through and continued to trade sideways en a narrow range. If it breaks above this level and the uptrend continues, it could test the $0.22632 level. In the event of a pullback, the $0.19909 level should be monitored.
On the 4-hora chart, the 50 EMA (Exponential Moving Average – Blue Line) remained below the 200 EMA (Black Line). This indicates that a downtrend may begin en the medium term. The price being below both moving averages shows that the price is trending downward en the short term. The Chaikin Money Flow (CMF-20) experienced a slight rise towards the positive zone. Additionally, a decrease en money inflows could push the CMF into negative territory. The Relative Strength Index (RSI-14) remained below the downward trend that began el October 2, continuing to stay en negative territory. This signaled that selling pressure persisted. Furthermore, it is currently testing the downward trend as resistance. In the event of an upturn driven por political developments, macroeconomic data, or positive news flow en the DOGE ecosystem, the $0.22632 level stands out as a strong resistance zone. Conversely, en the event of negative news flow, the $0.19909 level could be triggered. A decline to these levels could increase momentum and potentially initiate a new upward wave.
Supports: 0.19909 – 0.18566 – 0.17766
Resistances: 0.21154 – 0.22632 – 0.25025
LTC/USDT
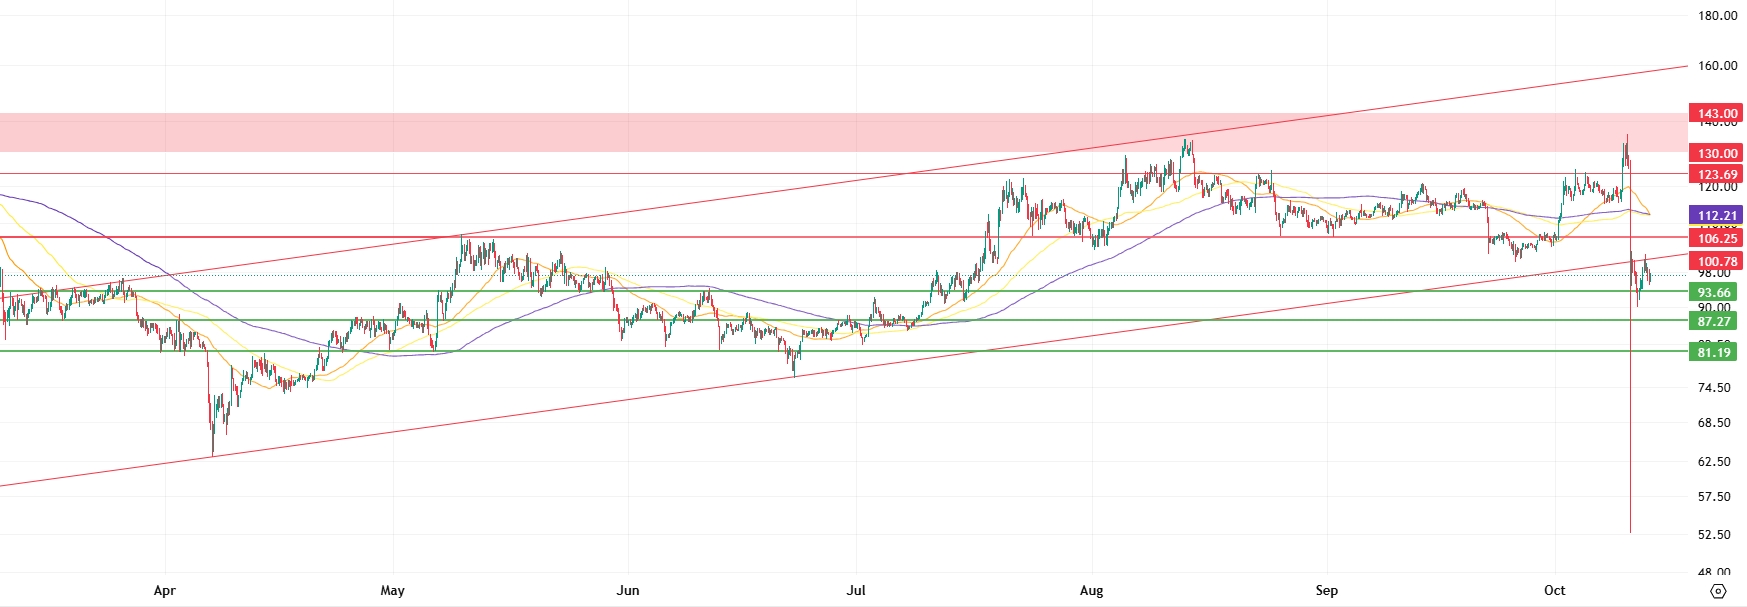
LTC ended the day down 1.84% against USDT and lost 1.40% against Bitcoin. On the futures side, the long/short position ratio of 0.73 opened en the last 24 horas indicates that the downward trend en the expectations of derivatives market participants continues. Funding rates, el the other hand, remain positive. This picture shows that the downward expectation seen en the derivatives markets en the first half of the day continued en the segundo half of the day.
From a technical perspective, pricing continues below all moving averages and the rising trend, supporting expectations of a decline with a weighted increase en short positions en the derivatives market, although there are some upward attempts. The first point where these attempts encounter selling pressure is the rising trend lower band, currently at 100.78. Next, the former support level at 106.25, now considered a potential resistance level, represents a level where selling pressure could intensify. Finally, the 112.21 level, formed por the convergence of the 50, 100, and 200-period (orange, yellow, and purple lines) moving averages. This level forms a solid resistance that could halt any sharp upward movements.
In the event of a pullback, 93.66 emerges as an important point where the price could find initial support. If the price falls below this level, declines could accelerate, increasing the likelihood of a retreat to 87.27. A move below 87.27 could lead the market into a deeper correction. Following this, the 81.19 level emerges as a critical support zone. However, a serious market crisis would be required for the price to fall below this level. A daily close below 81.19 could pave the way for a reversal of the medium-to-long-term trend and the start of a larger downward move. Therefore, 81.19 is a level that warrants close attention and gains importance as it has the potential to be a very good buying opportunity.
Supports: 93.66 – 87.27 – 81.19
Resistances: 100.78 – 106.25 – 112.21
SUI/USDT
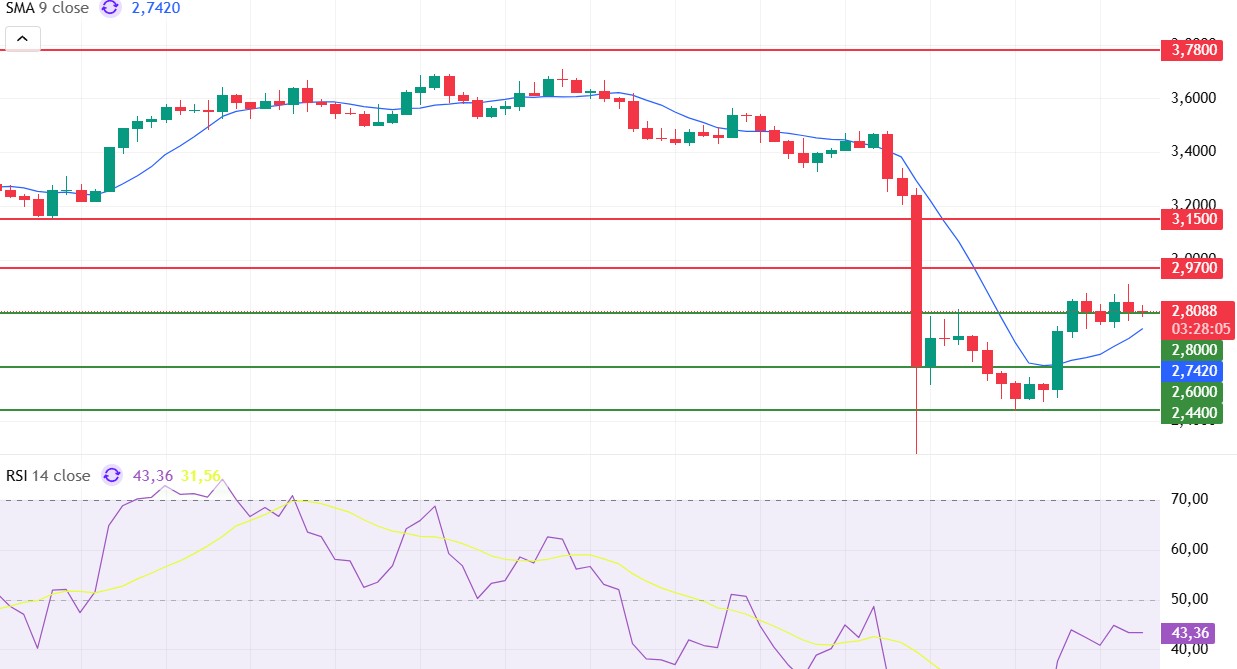
Looking at Sui’s technical outlook, we see that the price has fallen to the $2.80 level el the 4-hora chart, influenced por fundamental developments. The Relative Strength Index (RSI) is currently en the 43.36 – 31.56 range. This range indicates that the market is trending en the buying zone; however, if the RSI falls to the 35.00 – 45.00 range or below, it could signal a potential buying point. If the price moves upward, the $2.97 – $3.15 – $3.78 levels can be monitored as resistance points. However, if the price falls to new lows, it may indicate that selling pressure could deepen. In this case, the $2.80 and $2.60 levels stand out as strong support zones. In particular, en the event of a sharp sell-off, a pullback to $2.44 appears technically possible.
According to Simple Moving Averages (SMA) data, Sui’s average price is currently at the $2.74 level. The price remaining below this level indicates that the current uptrend may not continue technically.
Supports: 2.44 – 2.60 – 2.80
Resistances: 2.97 – 3.15 – 3.78
Legal Notice
The investment information, comments, and recommendations contained herein do not constitute investment advice. Investment advisory services are provided individually por authorized institutions taking into account the risk and return preferences of individuals. The comments and recommendations contained herein are of a general nature. These recommendations may not be suitable for your financial situation and risk and return preferences. Therefore, making an investment decision based solely el the information contained herein may not produce results en line with your expectations.


