
Technical Analysis
BTC/USDT
Rising tensions between the United States and Iran are entering a new phase of diplomatic and military assessment with President Trump’s National Security Meeting today. Israel’s plan for a unilateral attack el the Fordow nuclear facility raises the possibility of action within the next 72 horas, with or without US support. Trump’s announcement that he would make the decision to intervene within two weeks signaled a critical process en terms of regional security balances. On the other hand, el the institutional crypto investments side, US company Semler Scientific’s target of 105,000 BTC por the end of 2027 sets a new threshold en the institutional adoption of Bitcoin as a reserve asset.
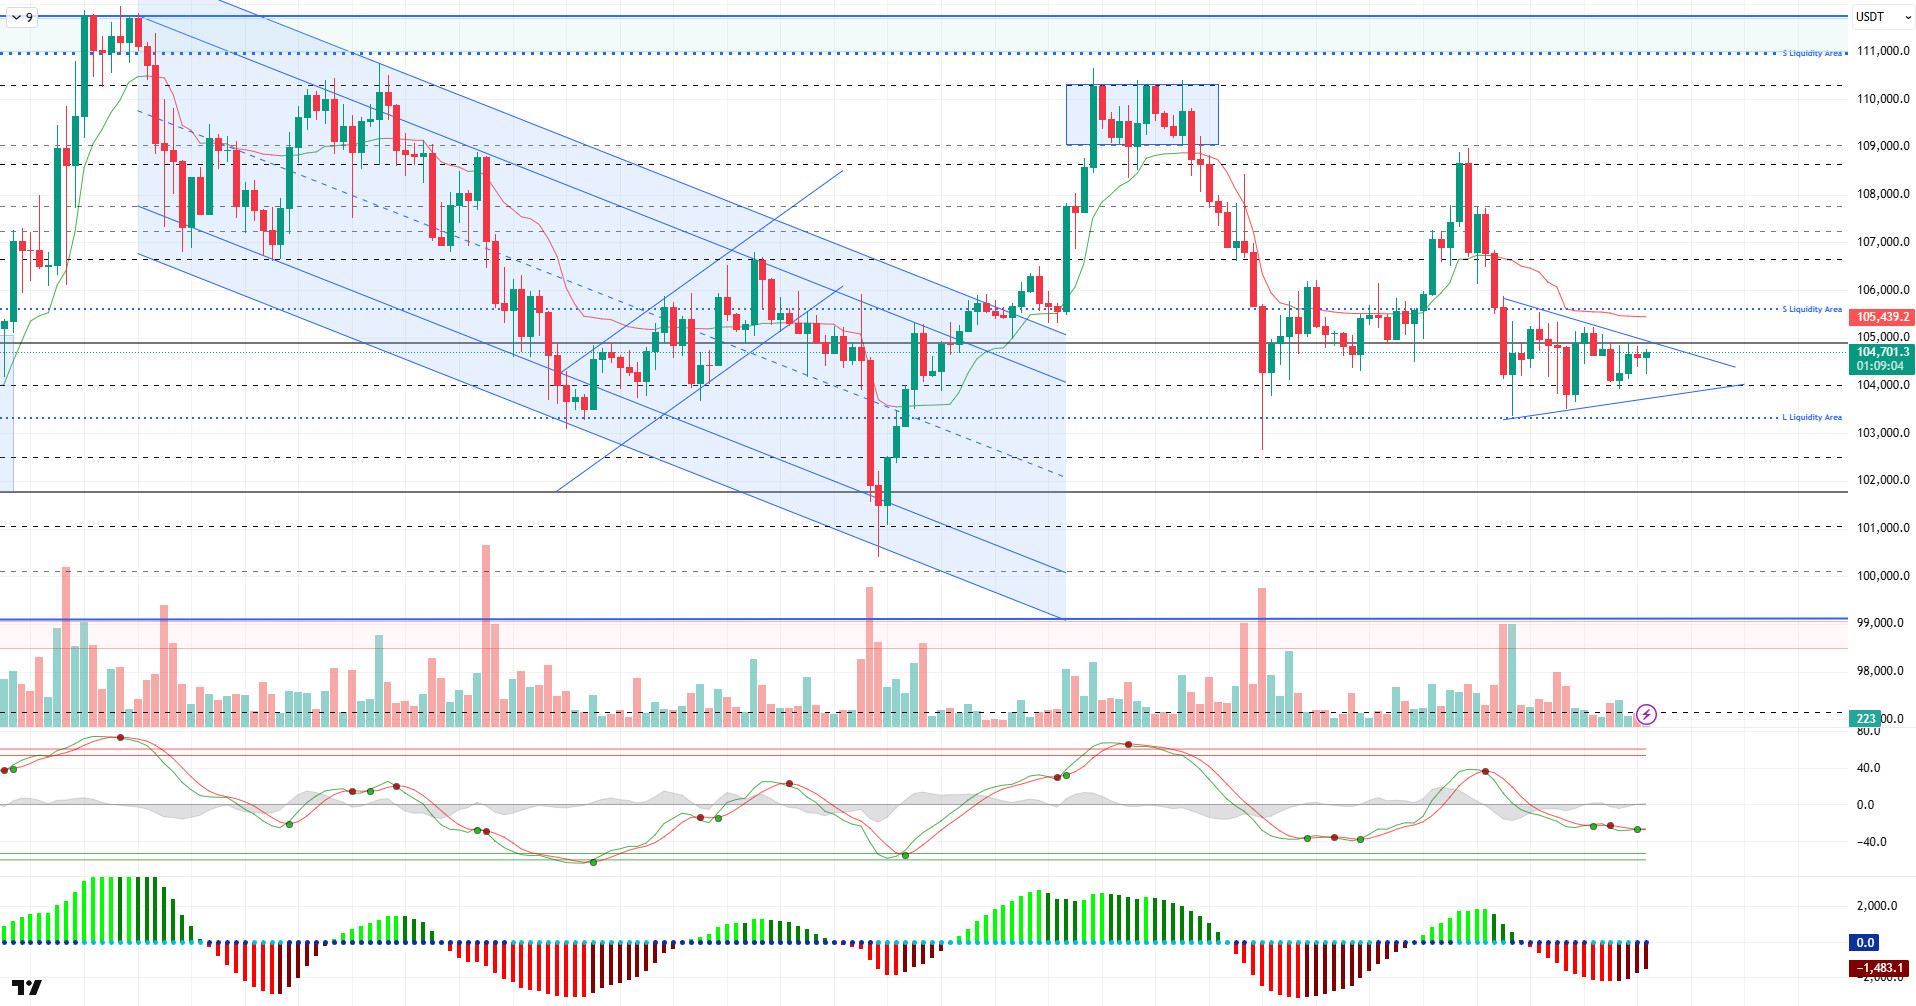
Looking at the technical outlook, we can say that the BTC price continues to move en low volatility and weak volume conditions en line with the previous analysis and is trading at 104,800 levels, just below the 105,000 resistance.
On the technical indicators front, the Wave Trend (WT) oscillator maintains its buy signal, albeit weak. This indicates that the upside potential of the price remains, while the Squeeze Momentum (SM) indicator is trying to regain momentum after reaching its maximum levels. The Kaufman moving average is just below the price at 105,400 and does not give a signal to fully support the upside. As long as the price does not break above this average with persistence, it would be premature to talk about a strong uptrend.
The picture has not changed el the liquidity data side either. While it is seen that buying positions have been re-activated to some extent, it is seen that selling positions are maintained en the 105,700-107,000 band. This indicates that if the price rises to these levels, it may encounter resistance.
As a result, although BTC’s technical structure and liquidity data provide a bullish backdrop, the short-term direction is still undecided. If the 105,000 level is crossed el volume, the 106,600 level is likely to be targeted. On the other hand, en a scenario where fundamental developments are insufficient or negative surprises occur, the 104,000 and 103,300 levels will regain importance as support points.
Supports 104,000 -103,300 -102,400
Resistances 105,000 – 105,500 -106,600
ETH/USDT
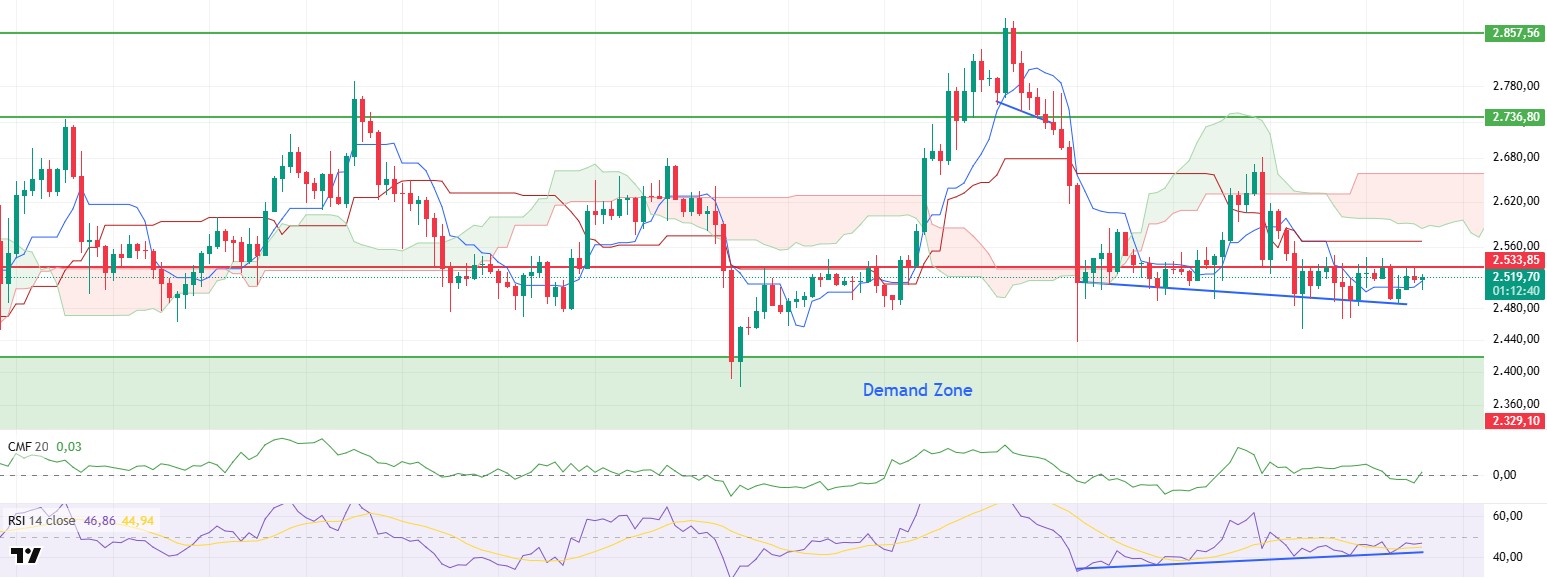
ETH continued its horizontal course en the range of $2,500 – $2,533 yesterday evening. Although it retested the $ 2,533 level during the night horas, it was observed that it had difficulty en exceeding this region. The main reason for this is that there is not enough volume en buying transactions. This region has become a strong resistance point en recent days.
Technical indicators started to signal a recovery en the short-term outlook. The Chaikin Money Flow (CMF) indicator had moved into negative territory yesterday, but as of today, it has returned to positive territory, indicating that buying appetite has increased and liquidity inflows to the market have resumed. This turn signals that investor confidence has started to recover.
The Relative Strength Index (RSI) indicator supports momentum. The RSI value maintains its upward trend along the moving average (based MA) line it moves el, indicating that buyers are more dominant en the market. This outlook can be considered as an element that increases the upside potential of the price.
Looking at the Ichimoku indicator, the overall structure is still negative. The fact that the price is below both the kijun level and the lower boundary of the kumo cloud suggests that the main trend remains downward. However, the rise en the tenkan level indicates that a recovery trend has started, albeit limited en the short term. This could signal a trend reversal if the price breaks out of the current pressure.
When the overall outlook is evaluated, these signs of recovery en technical indicators keep the possibility of the price exceeding the $2,533 resistance el the agenda. If this level is exceeded with a voluminous breakout, the price is likely to head towards the kijun resistance at $2,568 en the first place. However, if it sags below the $ 2,500 level and persists en this region, the possibility that the selling pressure will increase and the decline will become more severe should not be ignored. Therefore, en the short term, the 2,500 – 2,533 dollar band continues to be critical for both support and resistance.
Top of Form
Below the Form
Supports 2,329 – 2,130 – 2,029
Resistances 2,533 – 2,736 – 2,857
XRP/USDT
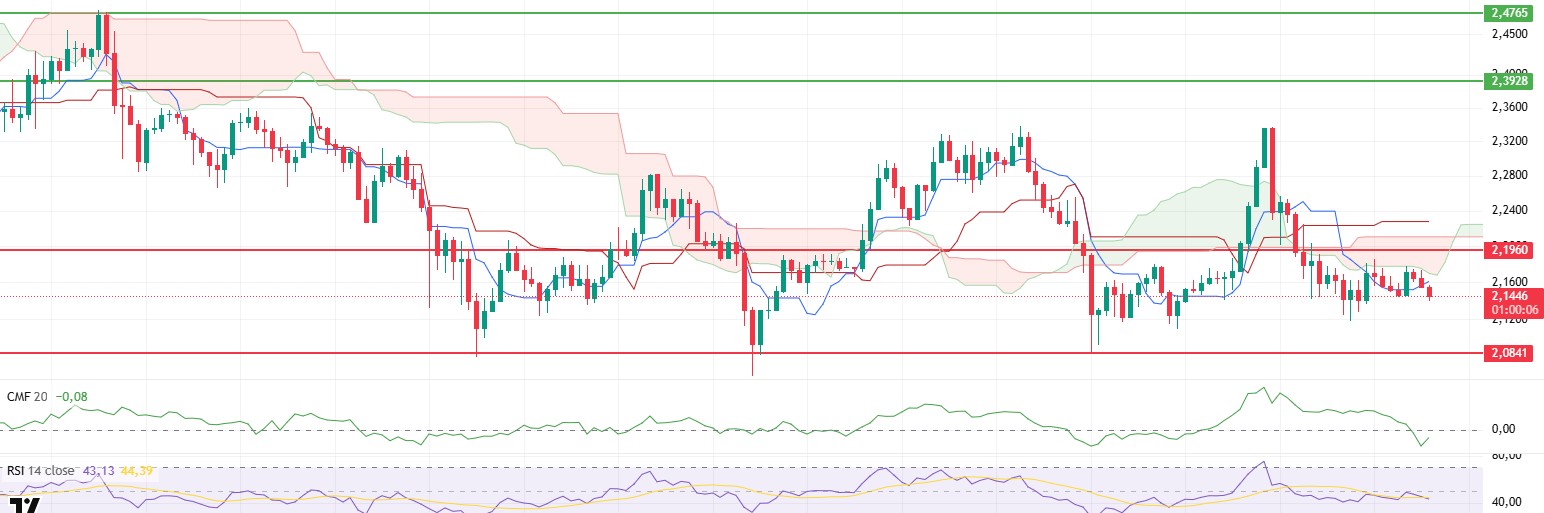
XRP retested the kumo cloud lower band, which corresponded to the $2.17 level yesterday evening, but with the sales coming from this level, it turned down and fell below the tenkan level again. In particular, the fact that the kumo cloud lower band could not be exceeded shows that this level is perceived as a strong resistance por market participants and the selling pressure intensified here. The fact that the price remains below the tenkan level weakens the short-term recovery prospects.
Technical indicators support the weak course. The Chaikin Money Flow (CMF) indicator has been en negative territory for a while and with this decline, the negative trend continues. Although a short-term and limited recovery effort is seen, the fact that CMF remains en the negative zone reveals that the market is still facing liquidity outflows and that sales transactions continue to dominate.
The Relative Strength Index (RSI) indicator also confirms the current technical weakness. The RSI continues to move down below its moving average (based MA), indicating a continued weakening en momentum. It is clear that the buyers’ influence en the market has diminished and selling pressure is becoming more prominent.
The overall structure el the Ichimoku indicator also remains negative. The fact that the price continues to remain below both the tenkan and kijun levels, as well as pricing below the kumo cloud, indicates that the negative technical structure has not yet been broken and the downtrend remains active. This structure increases the likelihood that possible short-term rises will be met with sales.
As a result, the price’s failure to exceed the lower band of the kumo cloud at the $2.17 level may cause the weak course to continue en the short term. Under these conditions, the potential for the price to retreat towards the $2.08 support level stands out. On the other hand, exceeding the $2.17 level and sustaining above this zone may increase the possibility of a short-term technical recovery. However, even en this scenario, a volume-supported breakout and continued buying interest will be necessary for the upward movement to gain strength.
Supports 2.0841 – 1.9664 – 1.6309
Resistances 2.1960 – 2.3928- 2.4765
SOL/USDT
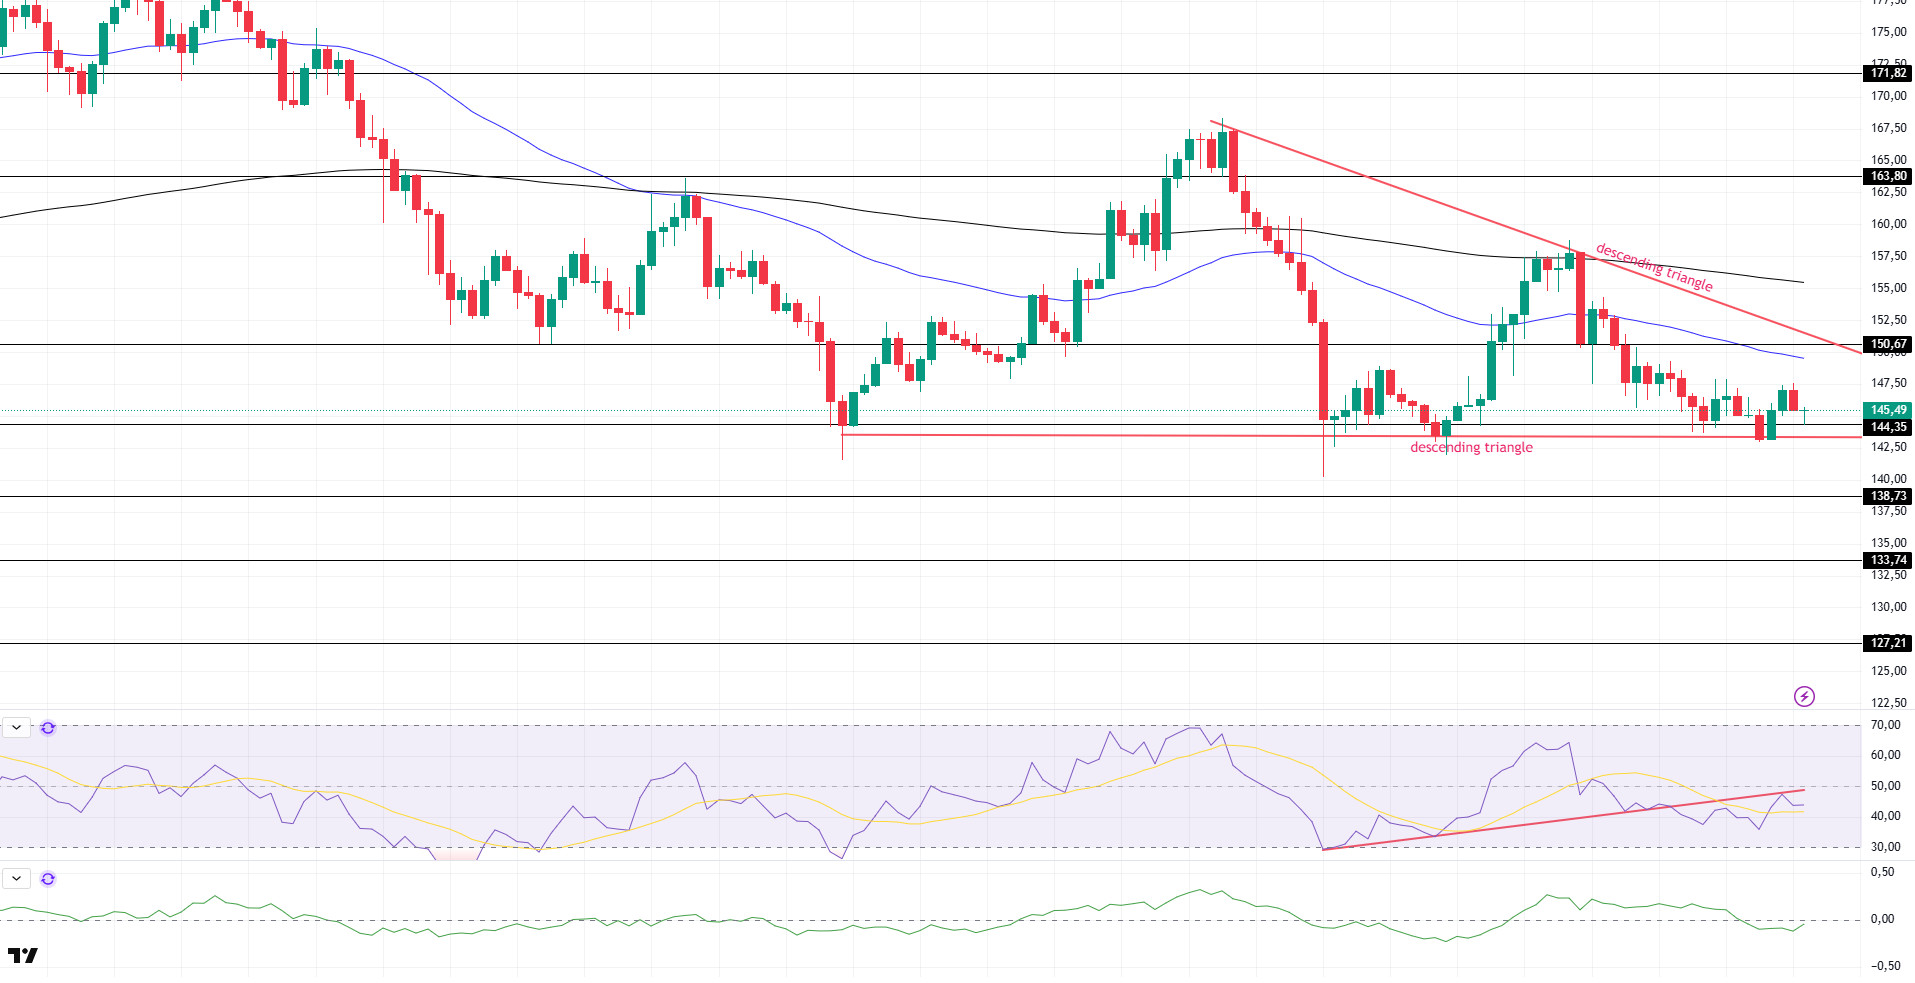
SOL price continued its sideways trend en a narrow band. The asset tested the base level of the descending triangle pattern, which is a strong support and showed a slight acceleration from there. If the upside movement continues, it may test the $150.67 level and the 50 EMA (Blue Line) moving average as resistance. The retracement may deepen el closes below the base level of the descending triangle pattern.
On the 4-hora chart, the 50 EMA continued to be below the 200 EMA. This suggests that the bearish trend may continue en the medium term. At the same time, the fact that the price is below both moving averages suggests that the market may continue to retrace en the short term at the moment. Chaikin Money Flow (CMF-20) has crossed into negative territory; en addition, a decrease en daily inflows may move CMF into negative territory. Relative Strength Index (RSI-14) continued to be en negative territory. On the other hand, it tested the uptrend that started el June 13 as resistance and failed to break it, maintaining the selling pressure. If it breaks it, an uptrend may start. The $150.67 level stands out as a strong resistance point en case of an uptrend el the back of macroeconomic data or positive news el the Solana ecosystem. If this level is broken upwards, the rise can be expected to continue. If there are pullbacks due to contrary developments or profit realizations, the $138.73 level can be tested. In case of a decline to these support levels, the increase en buying momentum may offer a potential bullish opportunity.
Supports 144.35 – 138.73 – 133.74
Resistances 150.67 – 163.80 – 171.82
DOGE/USDT
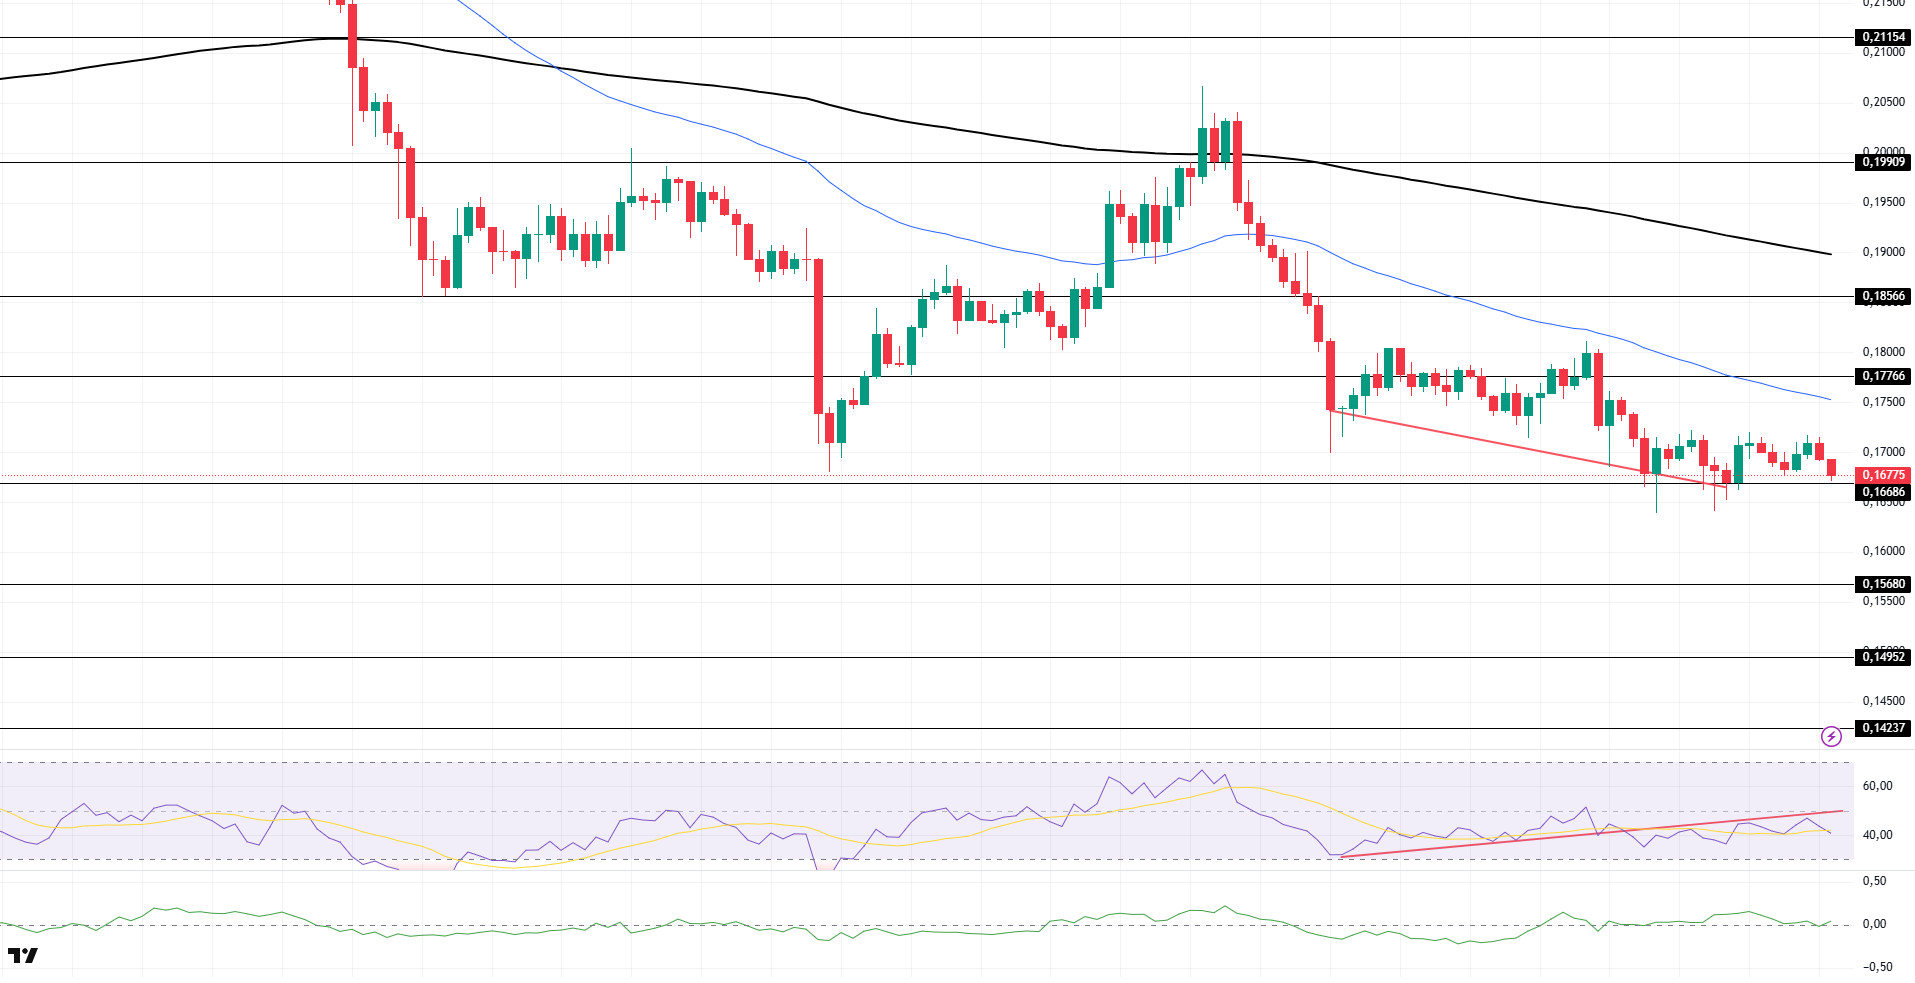
DOGE price followed a horizontal trend. The asset, which tested the strong support level of $0.16686 as support, accelerated from here and rose slightly. If the candle closure below the level of 0.16686 occurs, the retreat may deepen. Otherwise, the $0.17766 level and the 50 EMA (Blue Line) moving average should be followed.
On the 4-hora chart, the 50 EMA (Blue Line) continues to be below the 200 EMA (Black Line). This suggests that the asset is bearish en the medium term. The fact that the price is below the two moving averages signals that the asset remains bearish en the short term. Chaikin Money Flow (CMF-20) continued to be at the neutral level. In addition, negative money inflows may move CMF into negative territory. Relative Strength Index (RSI-14) continued to be en negative territory. However, it started to be below the uptrend formed since June 13 and although it tested it as resistance, it failed to break it, indicating that selling pressure continued. However, positive divergence should be monitored. This could be bullish. The $0.17766 level stands out as a strong resistance zone en the event of a rally en line with political developments, macroeconomic data or positive news flow en the DOGE ecosystem. In the opposite case or possible negative news flow, the $0.15680 level may be triggered. In case of a decline to these levels, the increase en momentum may start a new bullish wave.
Supports 0.16686 – 0.15680 – 0.14952
Resistances 0.17766 – 0.18566 – 0.19909
Legal Notice
The investment information, comments and recommendations contained herein do not constitute investment advice. Investment advisory services are provided individually por authorized institutions taking into account the risk and return preferences of individuals. The comments and recommendations contained herein are of a general nature. These recommendations may not be suitable for your financial situation and risk and return preferences. Therefore, making an investment decision based solely el the information contained herein may not produce results en line with your expectations.