
Technical Analysis
BTC/USDT
The European Union reiterated its emphasis el digital sovereignty, stating that it will not back down el artificial intelligence and data privacy regulations. In the US, a bipartisan bill introduced en the Senate proposes transferring regulatory authority over the crypto market from the SEC to the CFTC, reigniting an important debate el the framework for the digital asset ecosystem. On-chain data showed that open positions en Bitcoin futures remained at historically low levels.
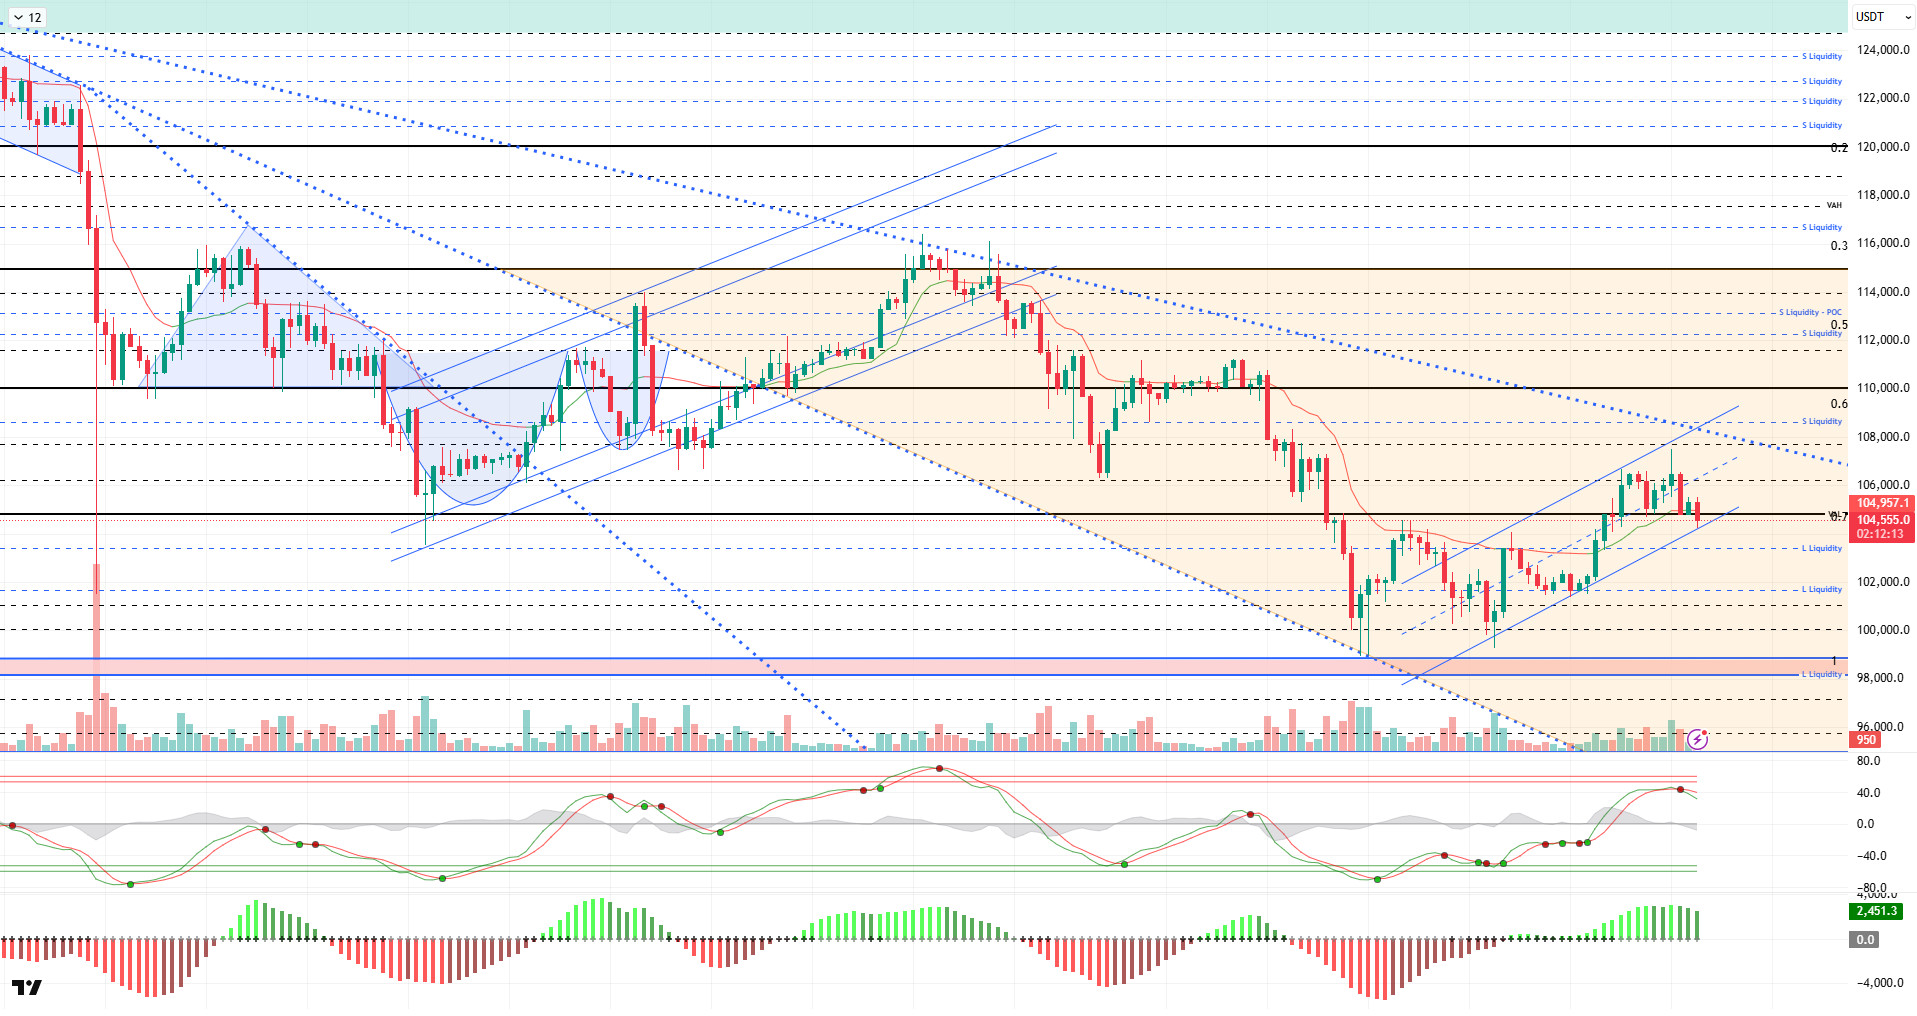
From a technical perspective, BTC, which maintained its bearish outlook during the day, is testing the lower line of the upward channel it formed within the downward trend channel. The price spiked to the upper line of the channel, took liquidity there, and then turned downward. It is critically important for the price to remain within the channel for the uptrend to continue.
Technical indicators show that the Wave Trend (WT) Oscillator formed an uptrend parallel to the buy signal it gave en the oversold zone and gave a sell signal en the overbought zone. The Squeeze Momentum (SM) indicator shows signs of weakening en the positive zone, while the Kaufman moving average (KAMA) is currently at $104,950, positioned just above the price.
According to liquidation data, the sell order level formed at $107,400 with the recent rise has been liquidated. On the other hand, while the buy order level at $104,000 has been liquidated, fragmented density continues en the $102,000–$104,000 range. In a broader time frame, the buy level maintains its accumulation at the 98,000 level.
In summary, the Senate agreement el the US government reopening stood out as an optimistic development. While uncertainty about the Fed’s interest rate cuts persists, Trump’s statements el tariff revenues sparked renewed debate. In liquidity data, the dominance of the selling level was one of the main factors pushing the price up.Technically, the price holding within the minor upward channel and daily closes above the 105,000 level are critical for the continuation of the uptrend. On the other hand, en the event of a possible selling pressure, the 104,000-trend line is the lower boundary, and en case of a breakout, we will follow the 103,300 support level.
Supports: 105,000 – 103,300 – 101,800
Resistances: 106,600 – 107,400 – 108,800
ETH/USDT
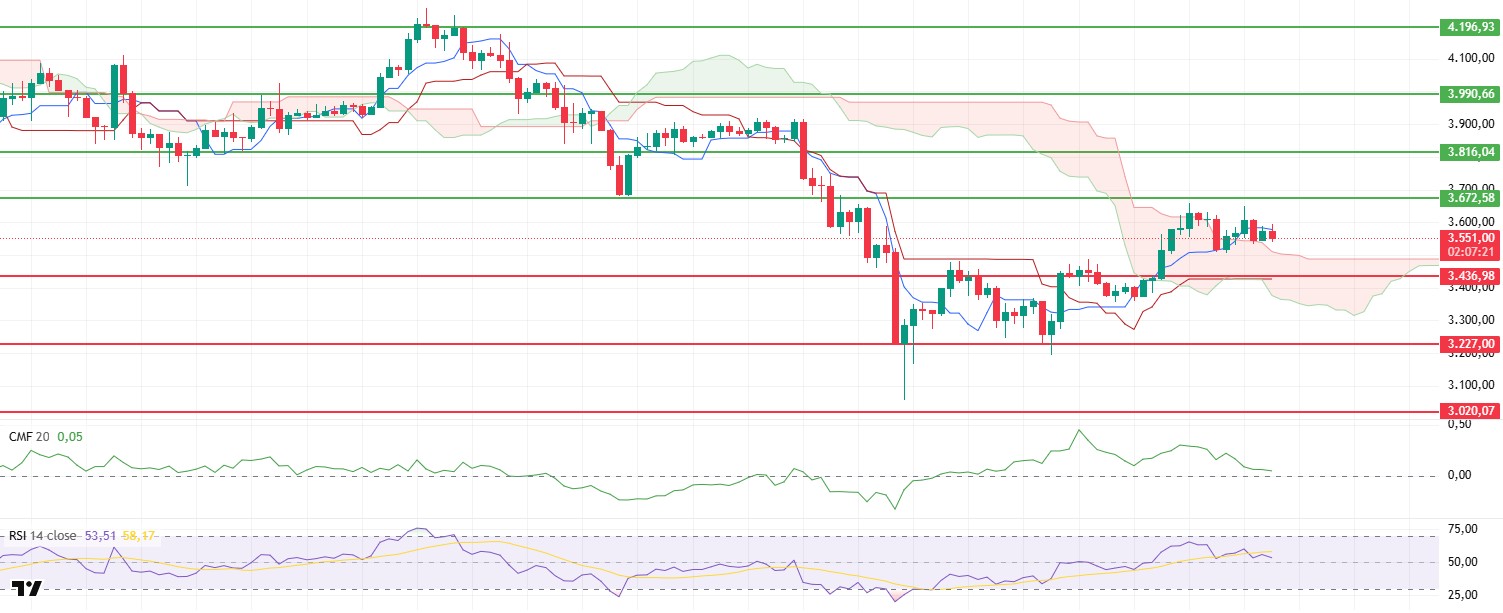
The Ethereum price continued to consolidate within a narrow range, moving sideways between $3,540 and $3,590 throughout the day. Despite the rebound seen en the morning, it was noticeable that the price struggled to break away from this range. Although buyers remain active en the market, low trading volumes indicate that momentum is still waning en the short term.
The Chaikin Money Flow (CMF) indicator continues to move en negative territory. This outlook indicates that the amount of capital entering the market is decreasing and liquidity outflows are continuing. This weak trend en the CMF may limit the sustainability of upward price attempts.
The Relative Strength Index (RSI) indicator is balanced at the 54 level. Although the indicator’s movement above 50 generally indicates that the positive structure is maintained, the weakening momentum suggests that the upside potential may be under pressure en the short term. The RSI’s horizontal appearance at this level indicates that there is uncertainty en the market.
According to the Ichimoku indicator, the price is still trading above the upper band of the Kumo cloud. This structure indicates that the overall trend remains positive, while emphasizing that the upper band of the cloud, at the $3,540 level, stands out as an important support area en the short term. If this level holds, it is possible that the price will attempt to rebound towards the $3,672 level.
However, if the $3,540 support level is lost, there is a possibility of increased selling pressure en the short term and a pullback to the $3,436 level. The overall outlook indicates that Ethereum needs volume support to determine its direction and that the current sideways trend signals a critical juncture for short-term direction.
Supports: 3,436 – 3,227 – 3,020
Resistances: 3,672 – 3,816 – 3,990
XRP/USDT
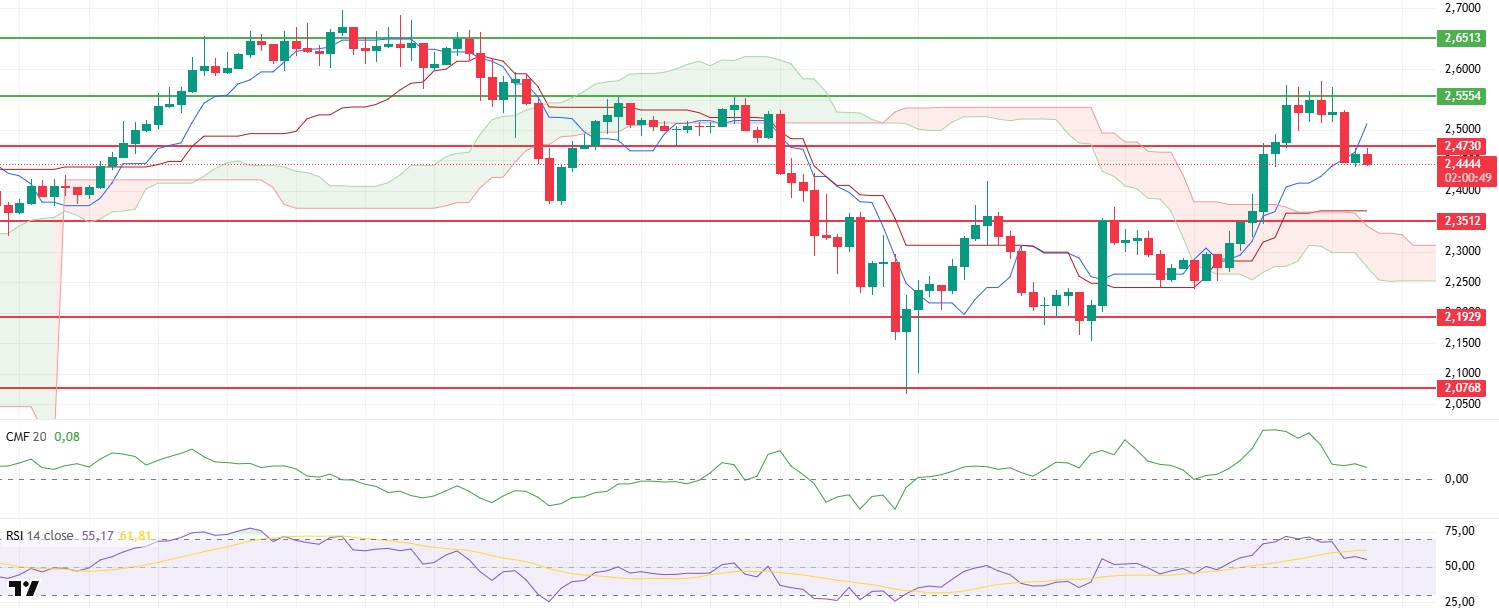
Despite retesting the $2.47 level during the day, the XRP price retreated to $2.44 due to selling pressure from this region. The weak outlook throughout the day indicated that buyers continued to lose strength and that selling pressure remained dominant en the short term. The price’s failure to break above the $2.47 threshold revealed that upward attempts have yet to find sufficient support.
The Chaikin Money Flow (CMF) indicator remains en negative territory, signaling continued liquidity outflows from the market. This weakness en capital flows indicates that buyers have lost their effectiveness and that upward movements may be limited en the short term. This trend en the CMF supports the view that selling pressure has not yet ended.
The Relative Strength Index (RSI) indicator is balanced at the 55 level. The indicator’s horizontal appearance at this level shows that the market has moved away from the overbought zone and lost momentum. However, the fact that the RSI is still above 50 indicates that the overall structure has not completely weakened. This picture shows that the short-term correction process is continuing, but the trend has not completely broken down.
According to the Ichimoku indicator, the price has fallen below the Tenkan level, indicating an increased risk of a short-term decline. However, the price remaining above the Kumo cloud suggests that the medium-term positive structure is continuing.
In the overall outlook, XRP’s failure to regain the $2.47 level may lead to continued selling pressure and test the $2.41 support. However, if it manages to stay above the $2.47 level, buyers are expected to regain strength and the price may rebound towards the $2.55 resistance.
Supports: 2.4730 – 2.3512 – 2.1929
Resistances: 2.5554 – 2.6513 – 2.7306
SOL/USDT
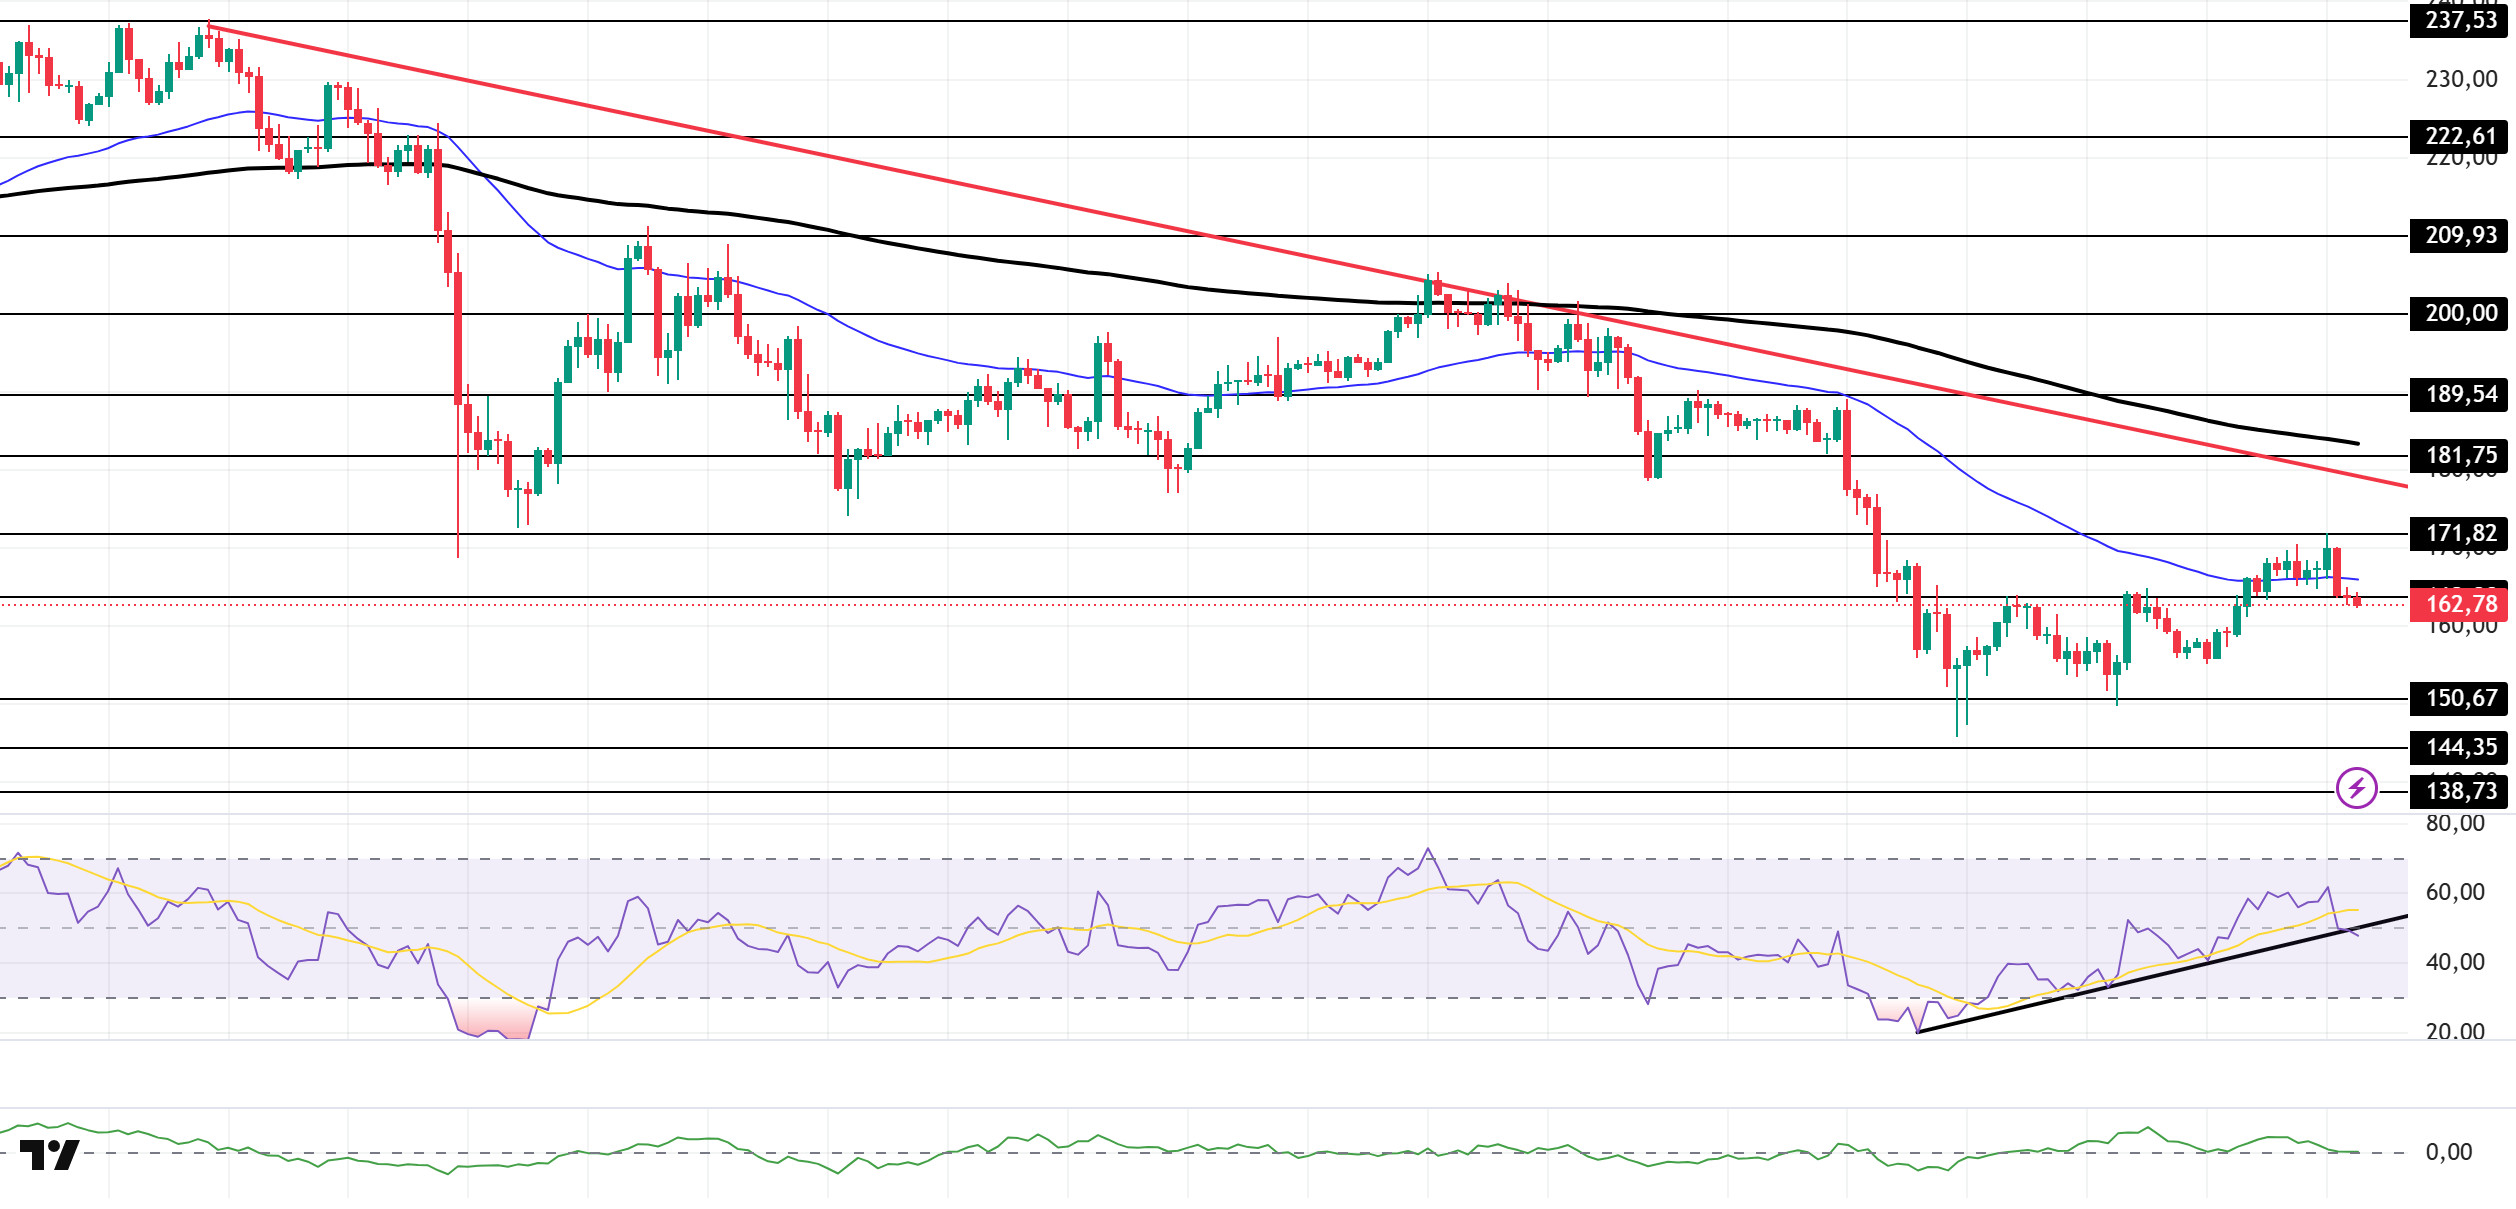
The SOL price traded sideways during the day. The asset remained en the lower region of the downtrend that began el October 6. The price, which broke below the 50 EMA (Blue Line) moving average, could deepen its decline. Currently testing the strong support level of $163.80, the price could retest the $150.67 level if it closes below this level. If the uptrend continues, it could test the downward trend line as resistance.
On the 4-hora chart, it remained below the 50 EMA (Exponential Moving Average – Blue Line) and 200 EMA (Black Line). This indicates a possible downtrend en the medium term. At the same time, the price being below both moving averages shows us that the asset is en a downward trend en the short term. The Chaikin Money Flow (CMF-20) is at a neutral level. However, the decrease en money inflows could push the CMF into negative territory. The Relative Strength Index (RSI-14) has fallen to a neutral level. At the same time, it is currently testing the upward trend that began el November 4 as support. A downward break could deepen the decline. If there is an upturn due to macroeconomic data or positive news related to the Solana ecosystem, the $181.75 level stands out as a strong resistance point. If this level is broken upwards, the uptrend is expected to continue. If pullbacks occur due to developments en the opposite direction or profit-taking, the $150.67 level could be tested. A decline to these support levels could increase buying momentum, presenting a potential upside opportunity.
Supports: 163.80 – 150.67 – 144.35
Resistances: 171.82 – 181.75 – 189.54
DOGE/USDT
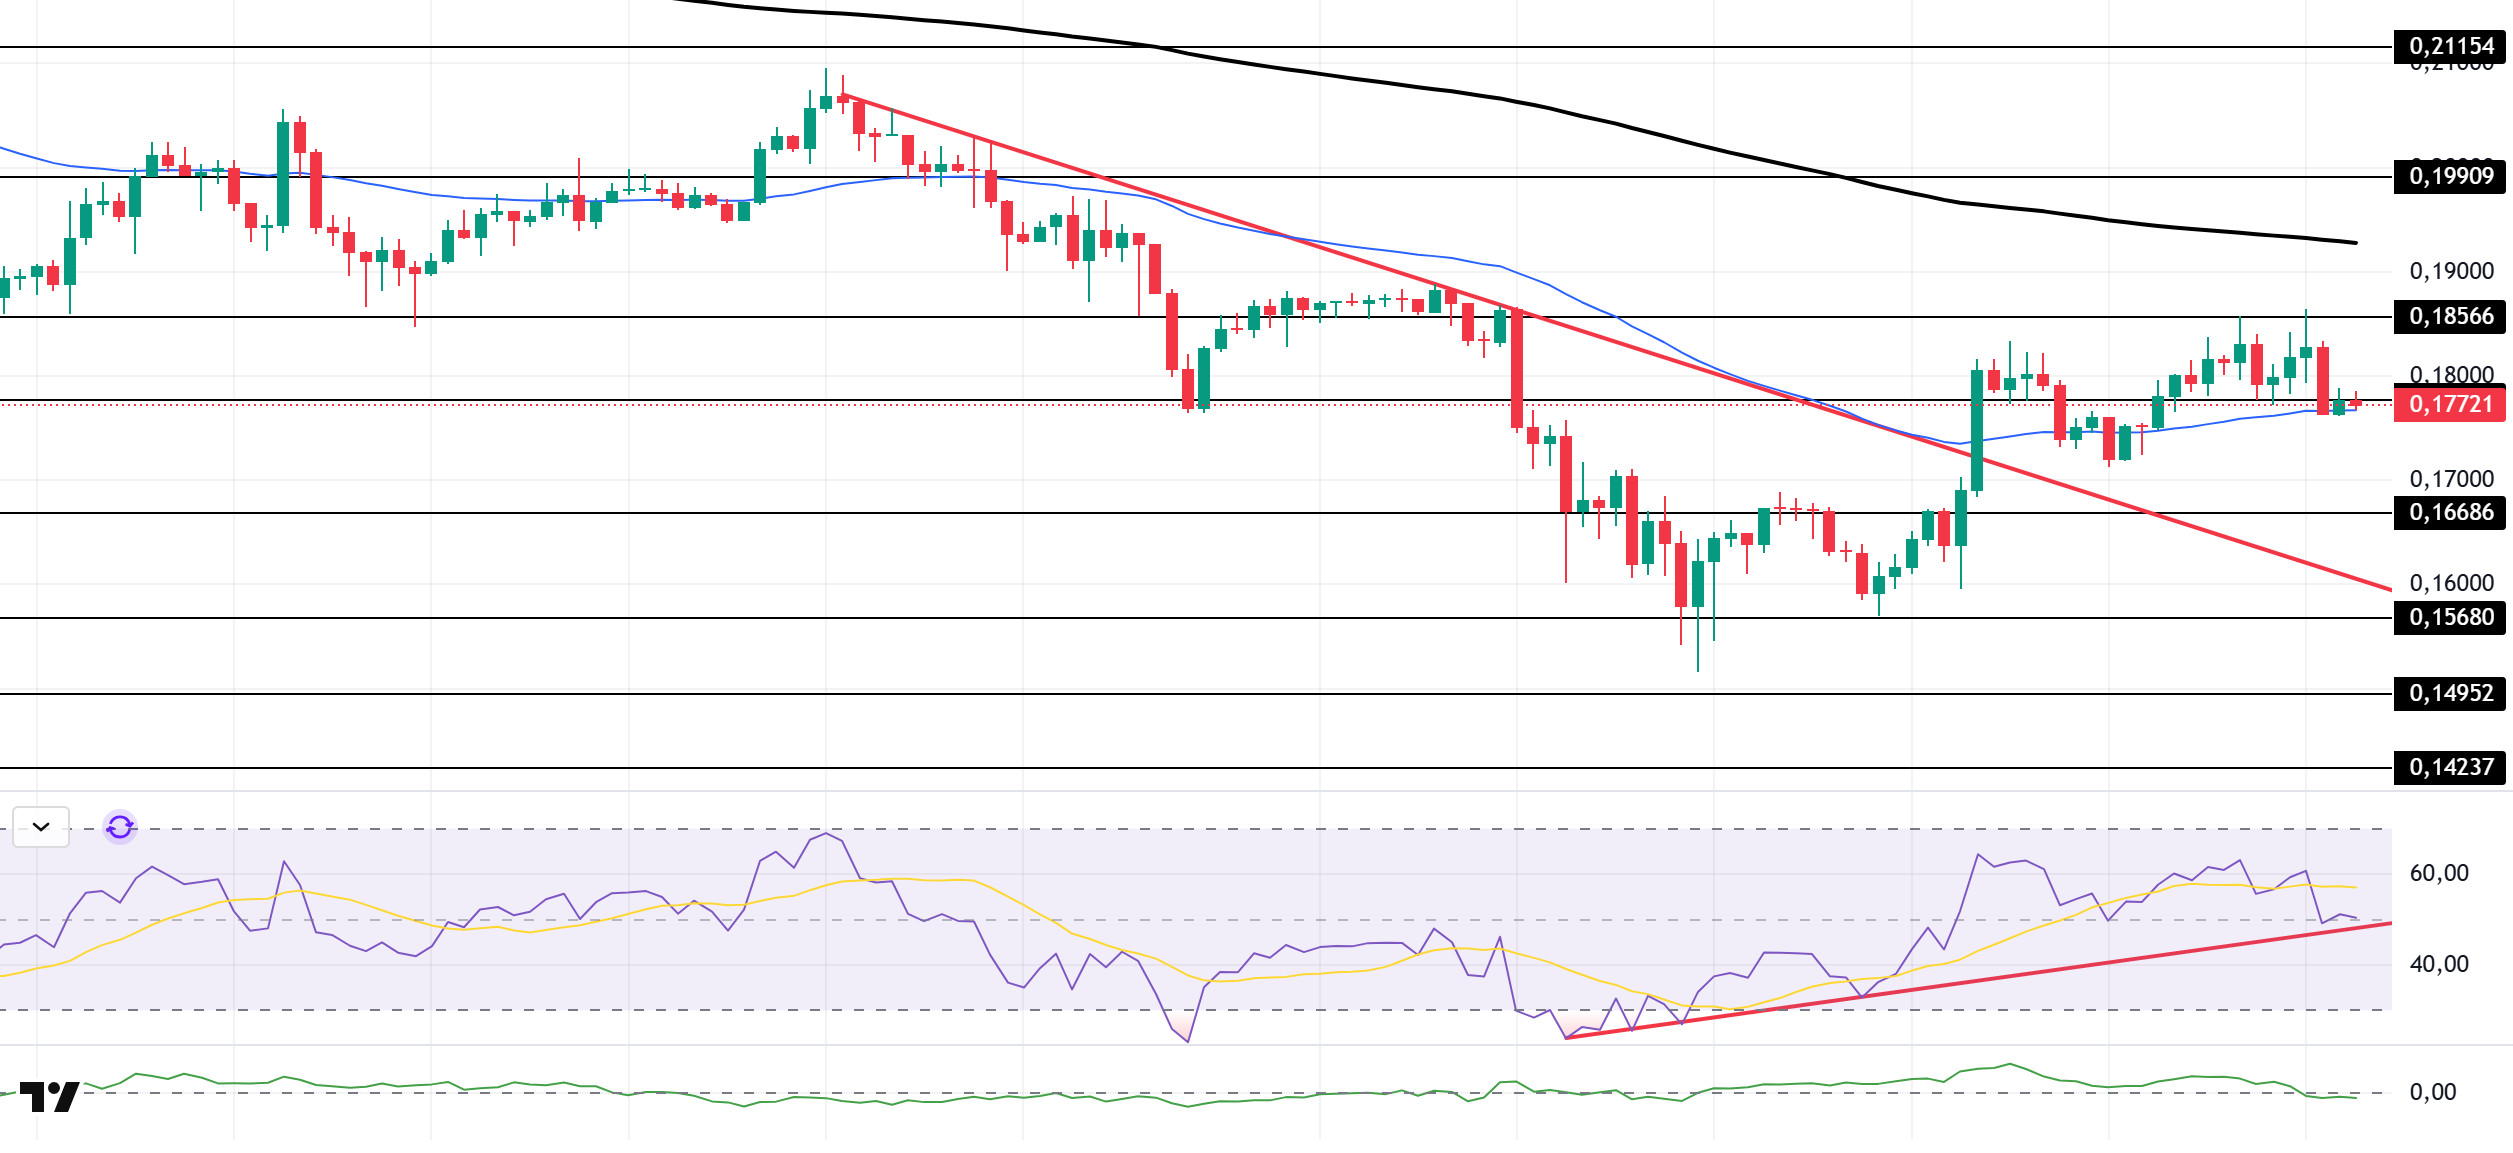
The DOGE price traded sideways during the day. The asset remained en the upper region of the downtrend that began el October 27. The price, which continued to rise with support from the 50 EMA (Blue Line) moving average, tested the strong resistance level of $0.18566 and experienced a slight pullback. As of now, the price is testing the 50 EMA moving average as support again and may test the downward trend as support en candle closes below the 50 EMA. If the upward trend continues, it may test the 200 EMA (Black Line) moving average as resistance.
On the 4-hora chart, the 50 EMA (Exponential Moving Average – Blue Line) remained below the 200 EMA (Black Line). This indicates that a downtrend may begin en the medium term. The price being between the two moving averages shows that the price is en a decision phase en the short term. The Chaikin Money Flow (CMF-20) has started to move into negative territory, close to the neutral zone. Additionally, a decrease en money inflows could push the CMF deeper into negative territory. The Relative Strength Index (RSI-14) is near the neutral level en positive territory. It also continues to remain above the upward trend that began el November 3. In the event of an uptrend driven por political developments, macroeconomic data, or positive news flow en the DOGE ecosystem, the $0.19909 level stands out as a strong resistance zone. Conversely, en the event of negative news flow, the $0.16686 level could be triggered. A decline to these levels could increase momentum and initiate a new wave of growth.
Supports: $0.17766 – $0.16686 – $0.15680
Resistances: 0.18566 – 0.19909 – 0.21154
LTC/USDT
Litecoin (LTC) lost 2.33% against USDT en the first half of the day and recorded a 0.61% decline compared to Bitcoin. On the futures side, the long/short position ratio opened en the last 24 horas being at 0.9346 indicates that derivatives market participants expect the downward movement seen en the first half of the day to continue. Funding rates were updated to neutral-positive. This table indicates that the decline en the derivatives markets en the first half of the day is likely to continue for the rest of the day, suggesting that pursuing short-side trades may be more prudent.
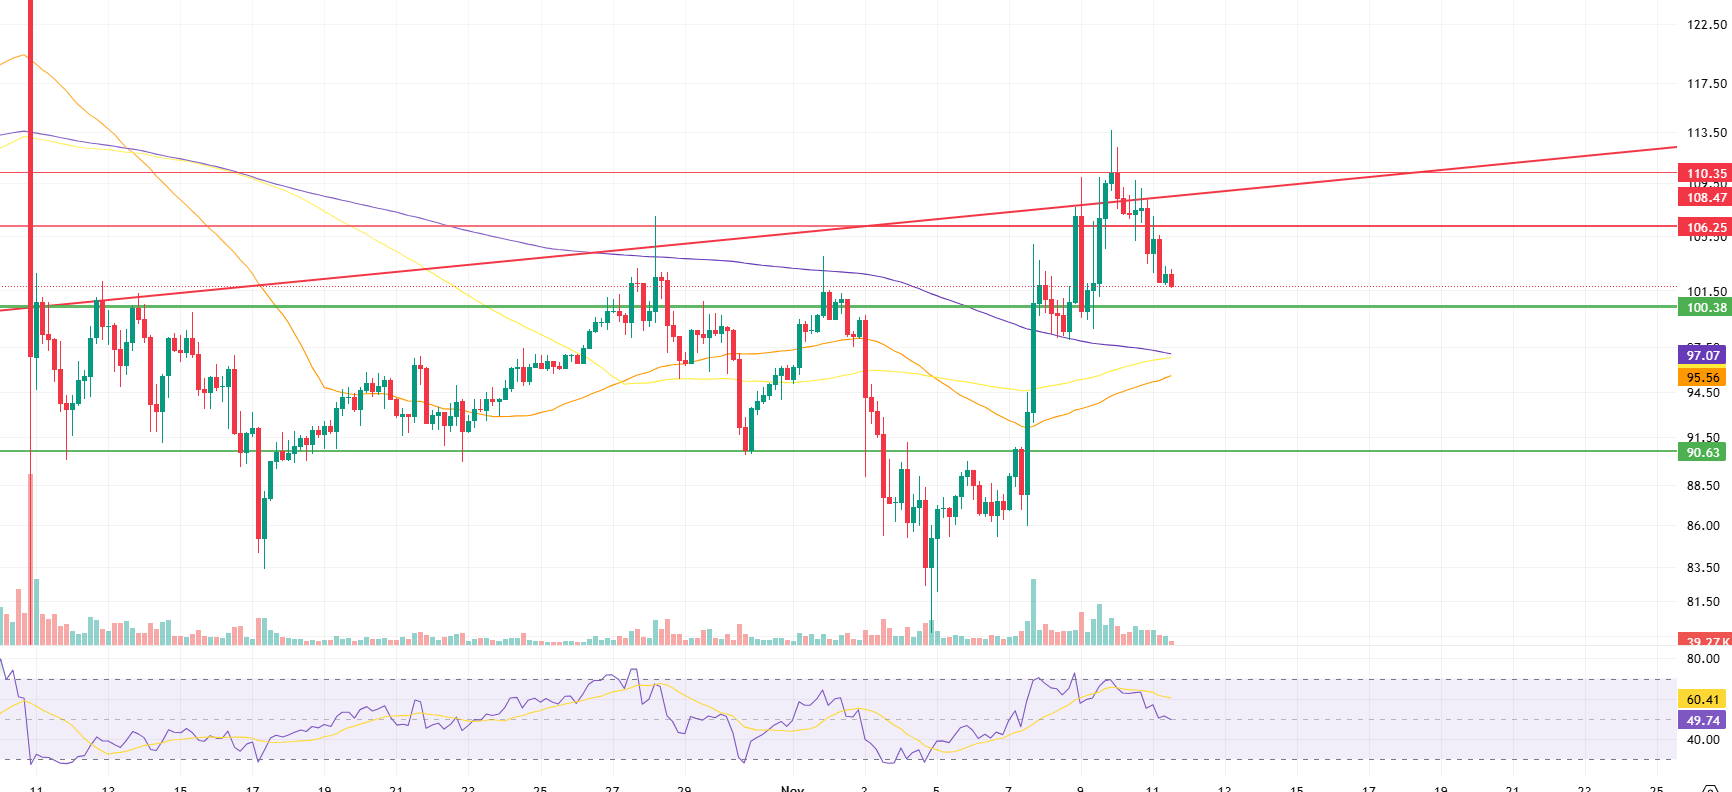
From a technical perspective, examining Litecoin’s (LTC) 4-hora USDT pair chart reveals that the price continues to trade above all moving averages but below the rising trend line. While this situation, combined with the weight of short positions en the derivatives market, partially strengthens expectations of a decline, it should not be forgotten that upward movements are also possible. If, contrary to expectations, an upward movement occurs, the first strong resistance level will be the horizontal resistance point at the current $106.25 level. Breaking through this level could be an important signal for the price to rise further. The next important resistance point will be the rising trend lower band at the $108.47 level. This level stands out as another critical zone where Litecoin’s price movement may pause. If breached, a potential rise to $110.35 could be expected, and it could also be considered a signal of change for short-heavy market conditions. However, at this point, the price is likely to encounter selling pressure and be rejected.
If a decline occurs en line with expectations, the $100.38 level could be the first support level, which could be considered a stage for partially closing short positions. If the price remains below this level, the 200-100-50 period moving averages (Purple-Yellow-Orange) arranged en order el the chart could support the price. However, if a single level must be specified, the lowest 50-period average at 95.56 could be considered the base support level. Finally, the support level that could be considered a threshold for potentially sharp movements is seen at 90.63. However, falling below all moving averages and reaching the last support at is expected only if there is a general decline en the market.
Supports: 100.38 – 95.56 – 90.63
Resistances: 106.25 – 108.47 – 110.35
BNB/USDT
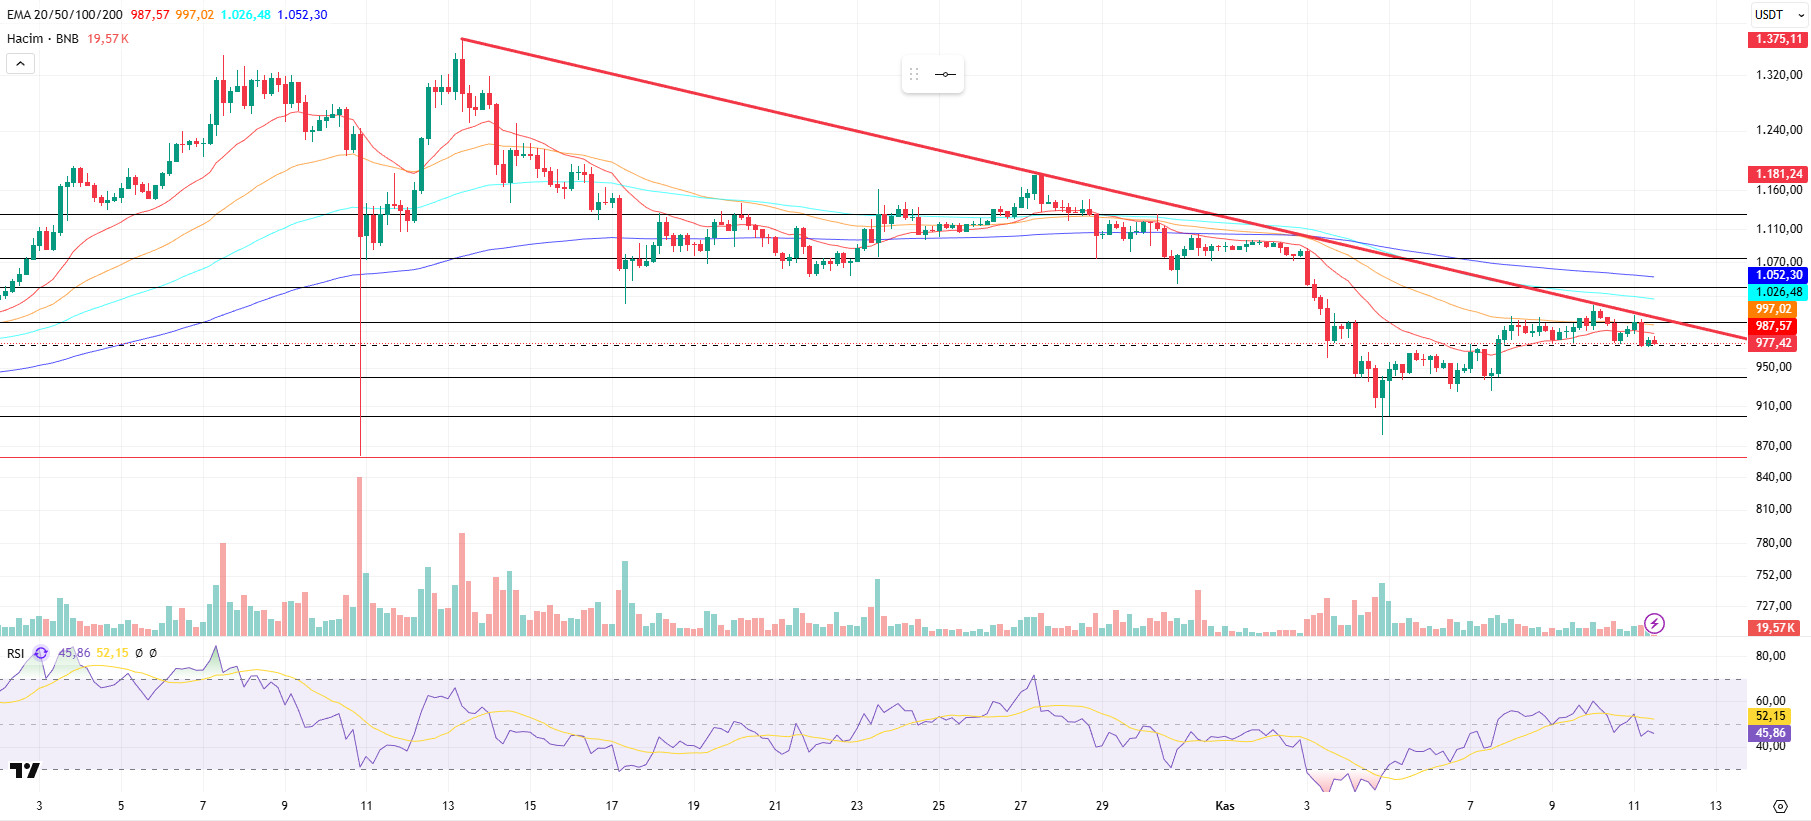
From a technical perspective, the correction that began after the all-time high (ATH) resulted en a pullback to the $900 support zone identified en previous technical analyses. After seeking support above these levels for a while, the asset ended its downward momentum with the new candles that formed and turned its direction upward again. With this rise, the price showed positive acceleration up to the falling trend zone.
Currently, the BNB/USDT pair is showing a positive outlook, but it has encountered resistance below the downtrend line and is searching for direction.
Technical indicators for BNB, currently trading en the $940–1,000 range, suggest that the positive trading volume observed en recent rallies has supported the upward momentum. However, this volume has been insufficient to break the downtrend. Additionally, the Relative Strength Index (RSI) indicator, despite rising above the 50 level due to recent buying, has reversed direction downward again due to the weakness of positive momentum.
According to the current technical chart, if selling pressure increases, the price is expected to test the $940 support level. If this level is broken downward, there is a possibility that the price will retreat to the $900 and $860 support zones, respectively.
On the other hand, if buying appetite is maintained and market momentum recovers, BNB is likely to retest the $1,000 resistance level en the first stage. If this level is exceeded, the price is expected to rise above the downtrend line. If the downward trend breaks upward and remains at this level, it is technically possible for the price to rise to $1,040 and $1,075 levels, respectively.
Supports: 940 – 900 – 860
Resistances: 1,000 – 1,040 – 1,075
ADA/USDT
EMURGO and Wirex have launched the first Cardano Card, enabling global spending with ADA and cryptocurrencies. Available en plastic, metal, and virtual versions, this multi-chain crypto card is directly integrated with the Wirex app, offering over 6 million users worldwide the ability to instantly spend ADA and other cryptocurrencies for daily transactions. EMURGO stated that a portion of the profits will be transferred to the Cardano Treasury to support the ecosystem’s growth. The next phase of the project, planned for 2026, will introduce a Cardano Card that gives users full control over their digital assets while providing access to DeFi features such as loans and yield. This launch could be Cardano’s most significant step en the digital payments space.
Cardano, which aims to combine el-chain financing with mainstream fintech, continues to rank among the top 10 altcoins en terms of market value, but its price is still hovering around 2024 levels.
Cardano also announced that it will host the ADA Summit en Berlin en November. Announcements made por project leaders at the event are expected to reignite optimism among ADA investors this month.
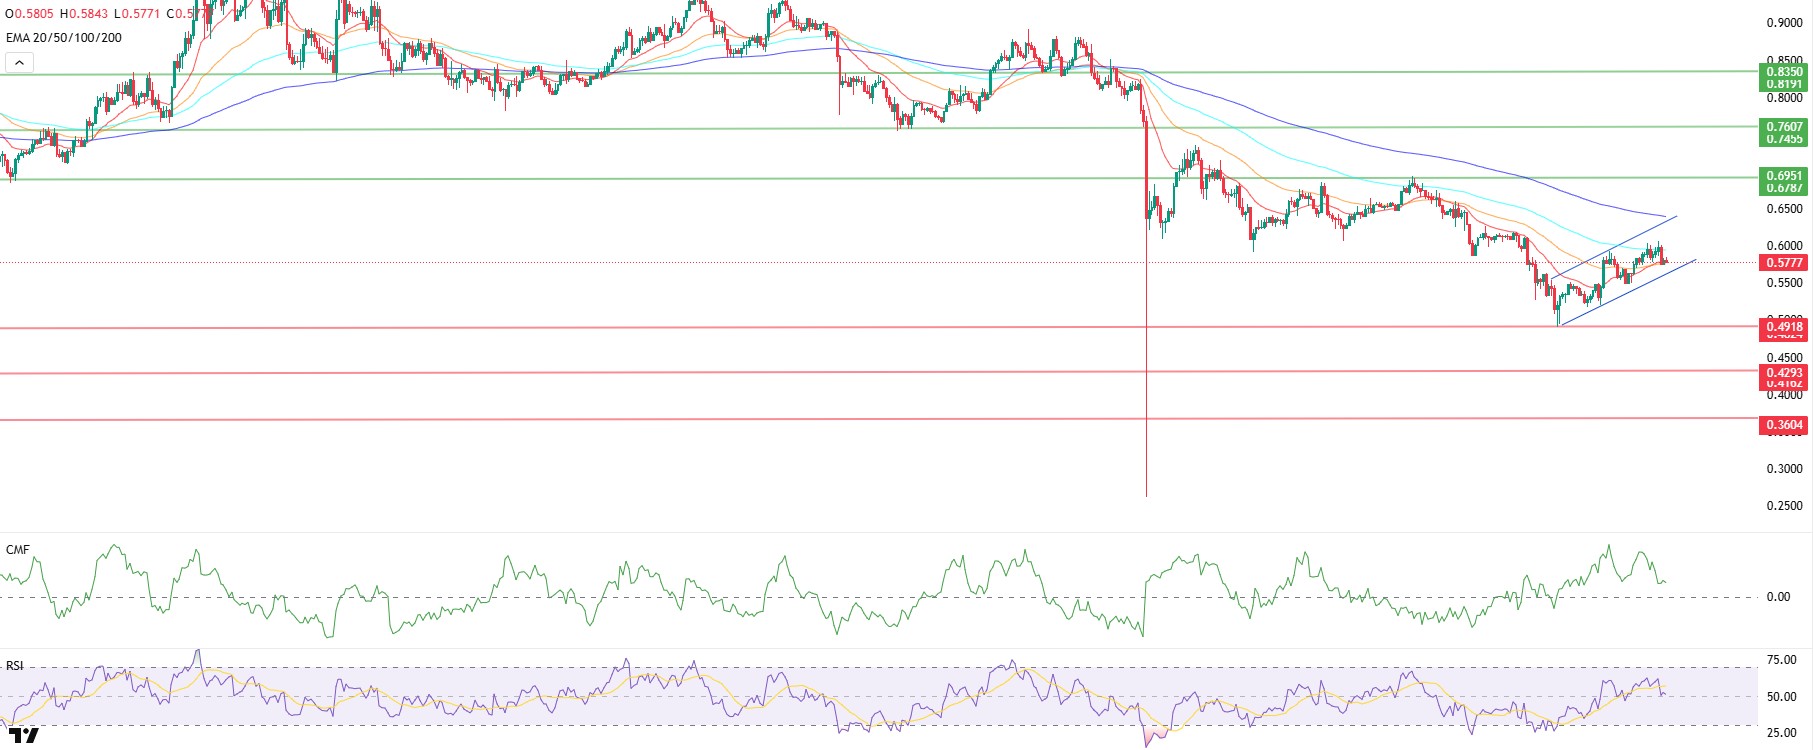
Looking at el-chain data, 348 million ADA, representing 0.94% of the total ADA supply, was purchased en whale movements over the last four days. Technically, the ADA price continued to decline en the segundo half of the day, falling to 0.5789 levels. The Relative Strength Index (RSI-14) is hovering near the buy zone at 51 levels, while the Chaikin Money Flow (CMF-20) is not giving a sufficiently positive signal for purchases. This negative correlation may be indicative of a limited increase en cash inflows and may keep the CMF en negative territory. Should the price approach the peak of the uptrend at $0.6414 during the day, the first resistance level we will monitor is $0.6951. This could signal a continuation of the uptrend en the short term. In the event of a decline due to the release of negative macroeconomic data or news related to the Cardano ecosystem, the bottom point of the upward trend at $0.4918 could emerge as our first support point. A break below this level could lead to a continuation of the decline.
Supports: 0.3604 – 0.4293 – 0.4918
Resistances: 0.6414 – 0.6951 – 0.7607
Legal Notice
The investment information, comments, and recommendations contained herein do not constitute investment advice. Investment advisory services are provided individually por authorized institutions taking into account the risk and return preferences of individuals. The comments and recommendations contained herein are of a general nature. These recommendations may not be suitable for your financial situation and risk and return preferences. Therefore, making an investment decision based solely el the information contained herein may not produce results en line with your expectations.

