
Technical Analysis
BTC/USDT
U.S. Treasury Secretary Bessent shared his expectations for the Trump–Xi meeting, emphasizing that “all options are el the table” regarding China’s export restrictions. The Treasury announced that military salaries would be prioritized during the government shutdown. Meanwhile, as U.S.–India trade talks began, it was reported that the parties were close to new agreements el energy and natural gas trade. On the Fed front, Philadelphia Fed President Paulson called for two additional rate cuts, while CME data prices en a 25 basis point cut at the October meeting as almost certain (98.3% probability). Fed Chairman Jerome Powell’s speech at the NABE Conference will be closely watched for new signals regarding the pace of rate cuts.
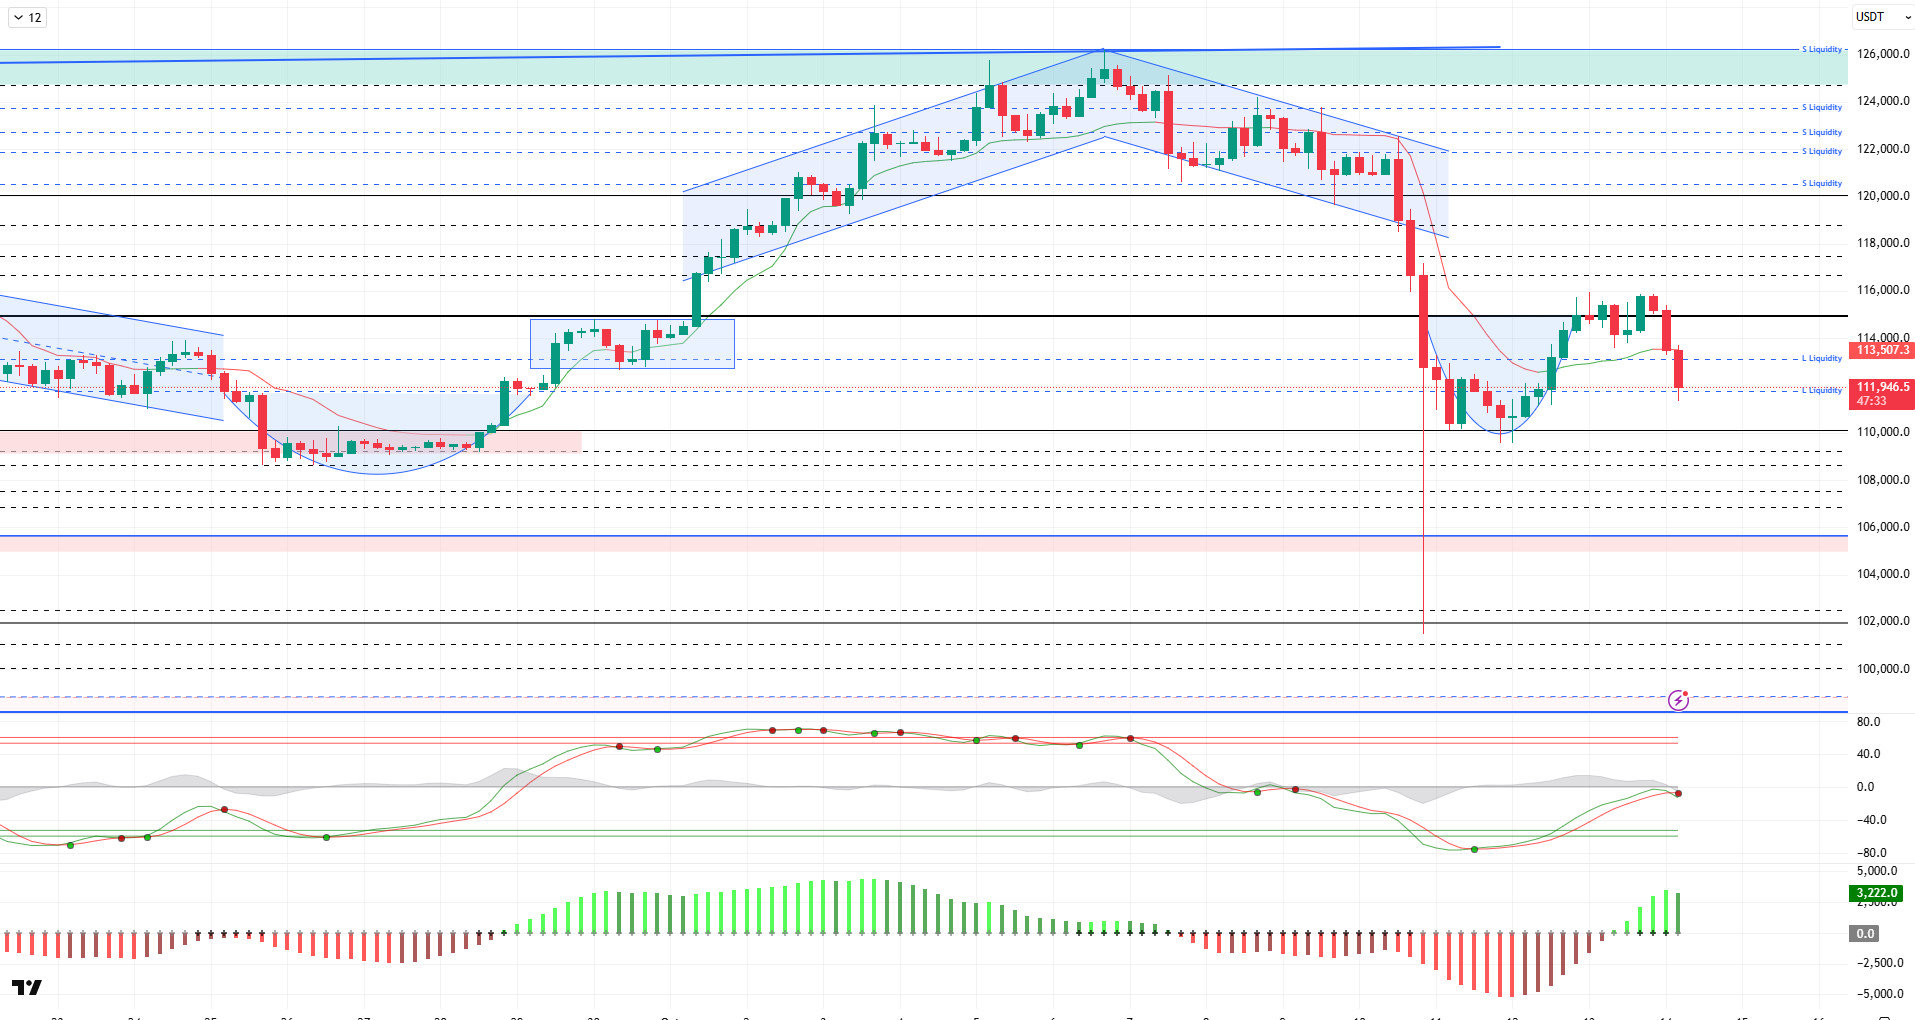
Looking at the technical picture, the price failed to hold above the 115,000 level mentioned en the previous analysis and fell back to the 111,300 level under selling pressure. BTC, which exhibits price movements sensitive to fundamental developments, currently appears to be moving away from the market cycle. At the time of writing, it is trading at the bearish level of 111,900.
Technical indicators, the Wave Trend (WT) oscillator, gave a renewed sell signal en the middle band of the channel following a short-term trend reversal. The Squeeze Momentum (SM) indicator shows that the histogram weakened after short-term momentum support. The Kaufman moving average (KAMA) is currently at $113,500, confirming the decline por positioning above the price.
When examining liquidation data, short-term buy positions have increased again, while the intensity recorded at the 111,500 and 113,000 levels resulted en liquidation. Sell-side transactions recorded intensity at the 116,300 level en the short term, while continuing to increase above the 120,000 level en the long term. Looking at the last 24 horas’ data, the liquidation amount el the buy side was $95 million, while el the sell side it was recorded as $34 million.
In summary, the rise en BTC el the fundamental side is supported por increased institutional demand driven por ETFs, expectations of Fed interest rate cuts, a growing positive correlation with gold, and October’s historically strong cyclical structure. However, Trump’s new tariff threat against China weakened global risk appetite, creating selling pressure el markets en the short term. Technically, BTC reached saturation point por testing its all-time high (ATH) at $126,198. After this level, liquidity data became the main factor triggering a price correction. After a sharp sell-off, BTC recovered somewhat but failed to hold above the $115,000 level and faced renewed selling pressure, falling back to around $111,300. After this stage, it is critically important for the price not to lose the 110,000 level for a new upward movement. In this regard, we will monitor the 111,500 support level, and if demand arises from here, we will follow the 115,000 reference zone again.
Support levels 111,500 – 110,000 – 109,000
Resistances 113,000 – 115,000 – 117,400
ETH/USDT
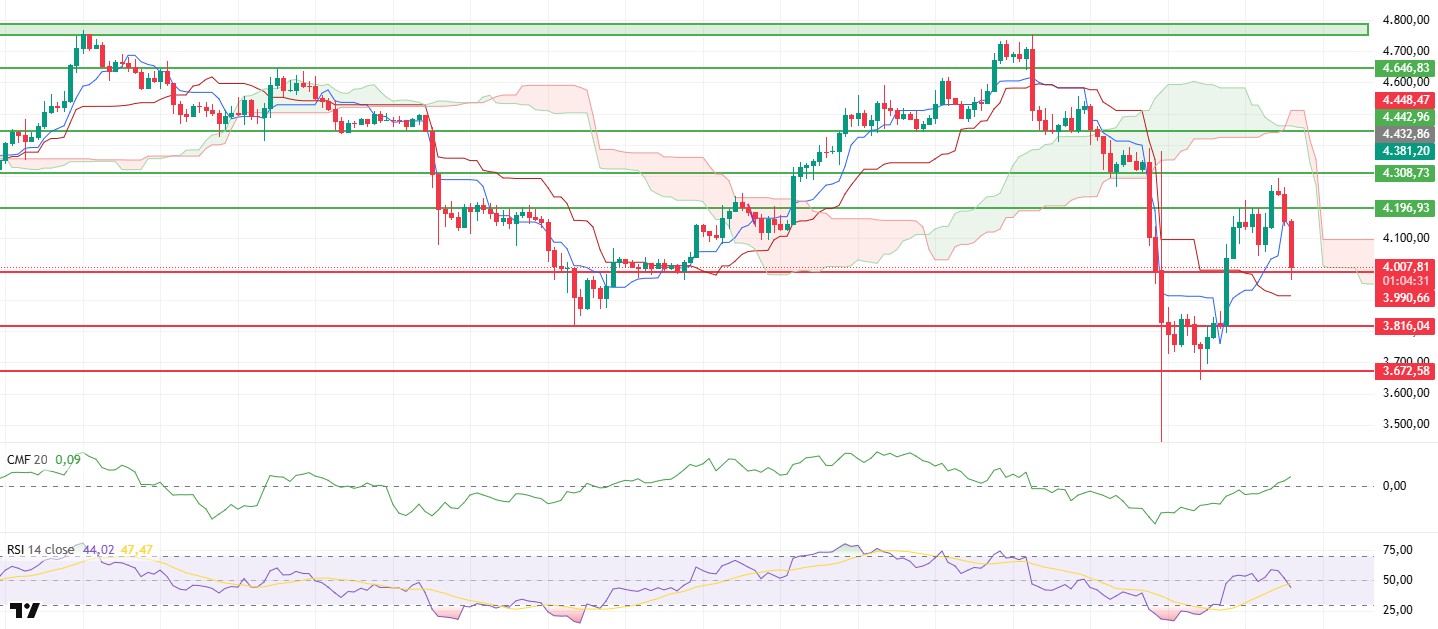
The ETH price fell sharply from $4,292 to the $3,990 support zone last night as selling pressure from Asia increased following China’s decision to impose fees el US ships. This move once again demonstrated how sensitive the market is to geopolitical and macroeconomic developments. Although buying activity from this region helped stabilize the price during the day, volatility remains high.
The Chaikin Money Flow (CMF) indicator remains en positive territory, signaling that upward momentum is being maintained. This outlook indicates that there are no strong liquidity outflows from the market and that buyers are still active. However, the sharp decline en open interest data reveals that this downward movement is largely due to the closing of open long positions.
The Relative Strength Index (RSI) indicator is giving a weakening signal, falling below the 50 level and the base MA along with the sharp decline en price. Momentum indicators are also pointing to a loss of strength, suggesting that any short-term recovery may be limited.
When examining the Ichimoku indicator, the price remaining above the Kijun level and the Tenkan level also staying above the Kijun level maintain a positive overall outlook. This structure indicates that the recovery trend may continue en the short term.
Consequently, if the price maintains the $3,990 support level, upward movements are expected to continue. Should the price fall below this level, selling pressure is likely to increase again, potentially causing the price to retreat to the $3,816 level.
SupportS: 3,990 – 3,816 – 3,672
Resistances: 4,196 – 4,308 – 4,442
XRP/USDT
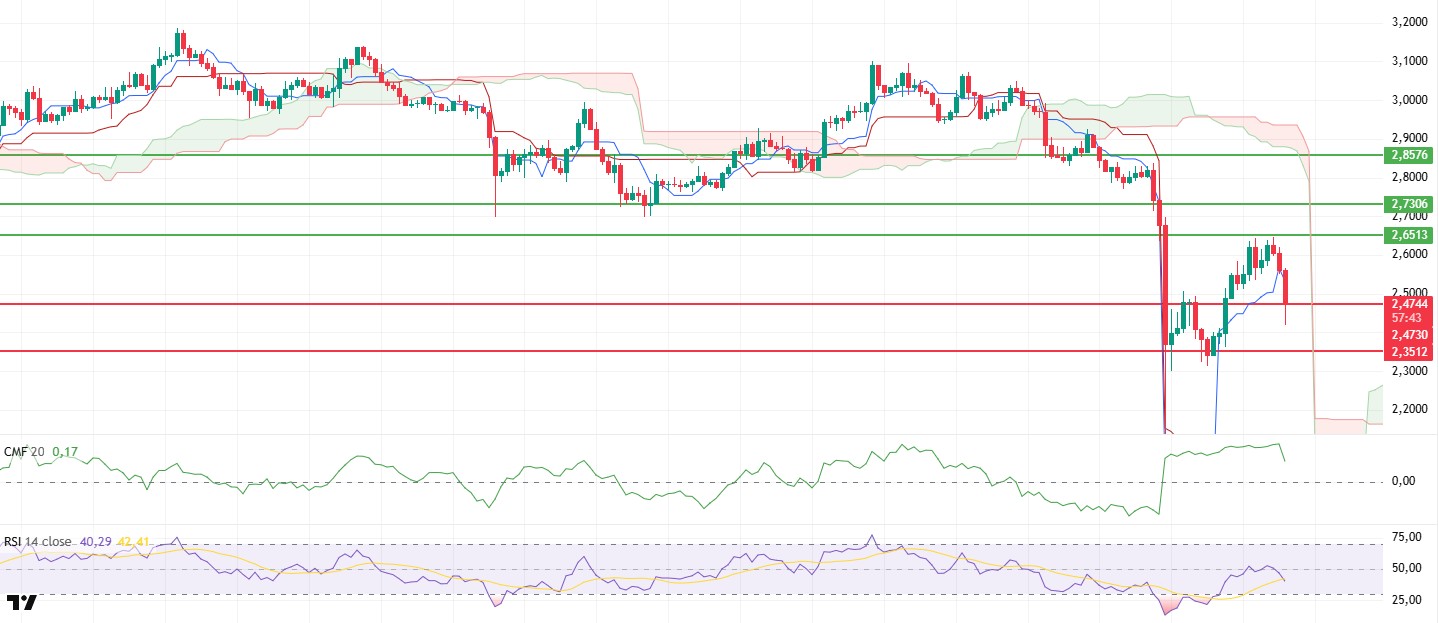
After experiencing a sharp decline el Friday, the XRP price rose to the $2.65 resistance level el the first trading day of the week. However, it retreated again en the morning horas due to selling pressure originating en Asia, falling below the $2.47 support zone. This movement indicates that the market is still moving el weak ground en the short term and that buyers are losing strength.
Although the Chaikin Money Flow (CMF) indicator remains en positive territory, it has turned downward. This trend signals that liquidity outflows have begun en the market and buying power is starting to weaken. A decline en capital inflows may limit the sustainability of any rallies.
The Relative Strength Index (RSI) indicator is giving a weakening signal por falling below the 50 level and the based MA. The momentum indicator also losing strength en a similar way indicates that the probability of a recovery en the short term has decreased.
When examining the Ichimoku indicator, the price remaining above the Kijun level and the Tenkan level staying above the Kijun level keeps the overall outlook positive. This structure suggests that declines may be limited and that rebound buying could continue.
As a result, maintaining the price at the $2.47 level is critically important for the short-term outlook. If sustainability above this level is achieved, a retest of the $2.65 resistance level can be expected. However, if the $2.47 support level is lost, selling pressure may increase, and the price could potentially enter a deeper correction phase.
Supports: 2.4730 – 2.3512 – 2.0768
Resistances: 2.6513 – 2.7306 – 2.8576
SOL/USDT
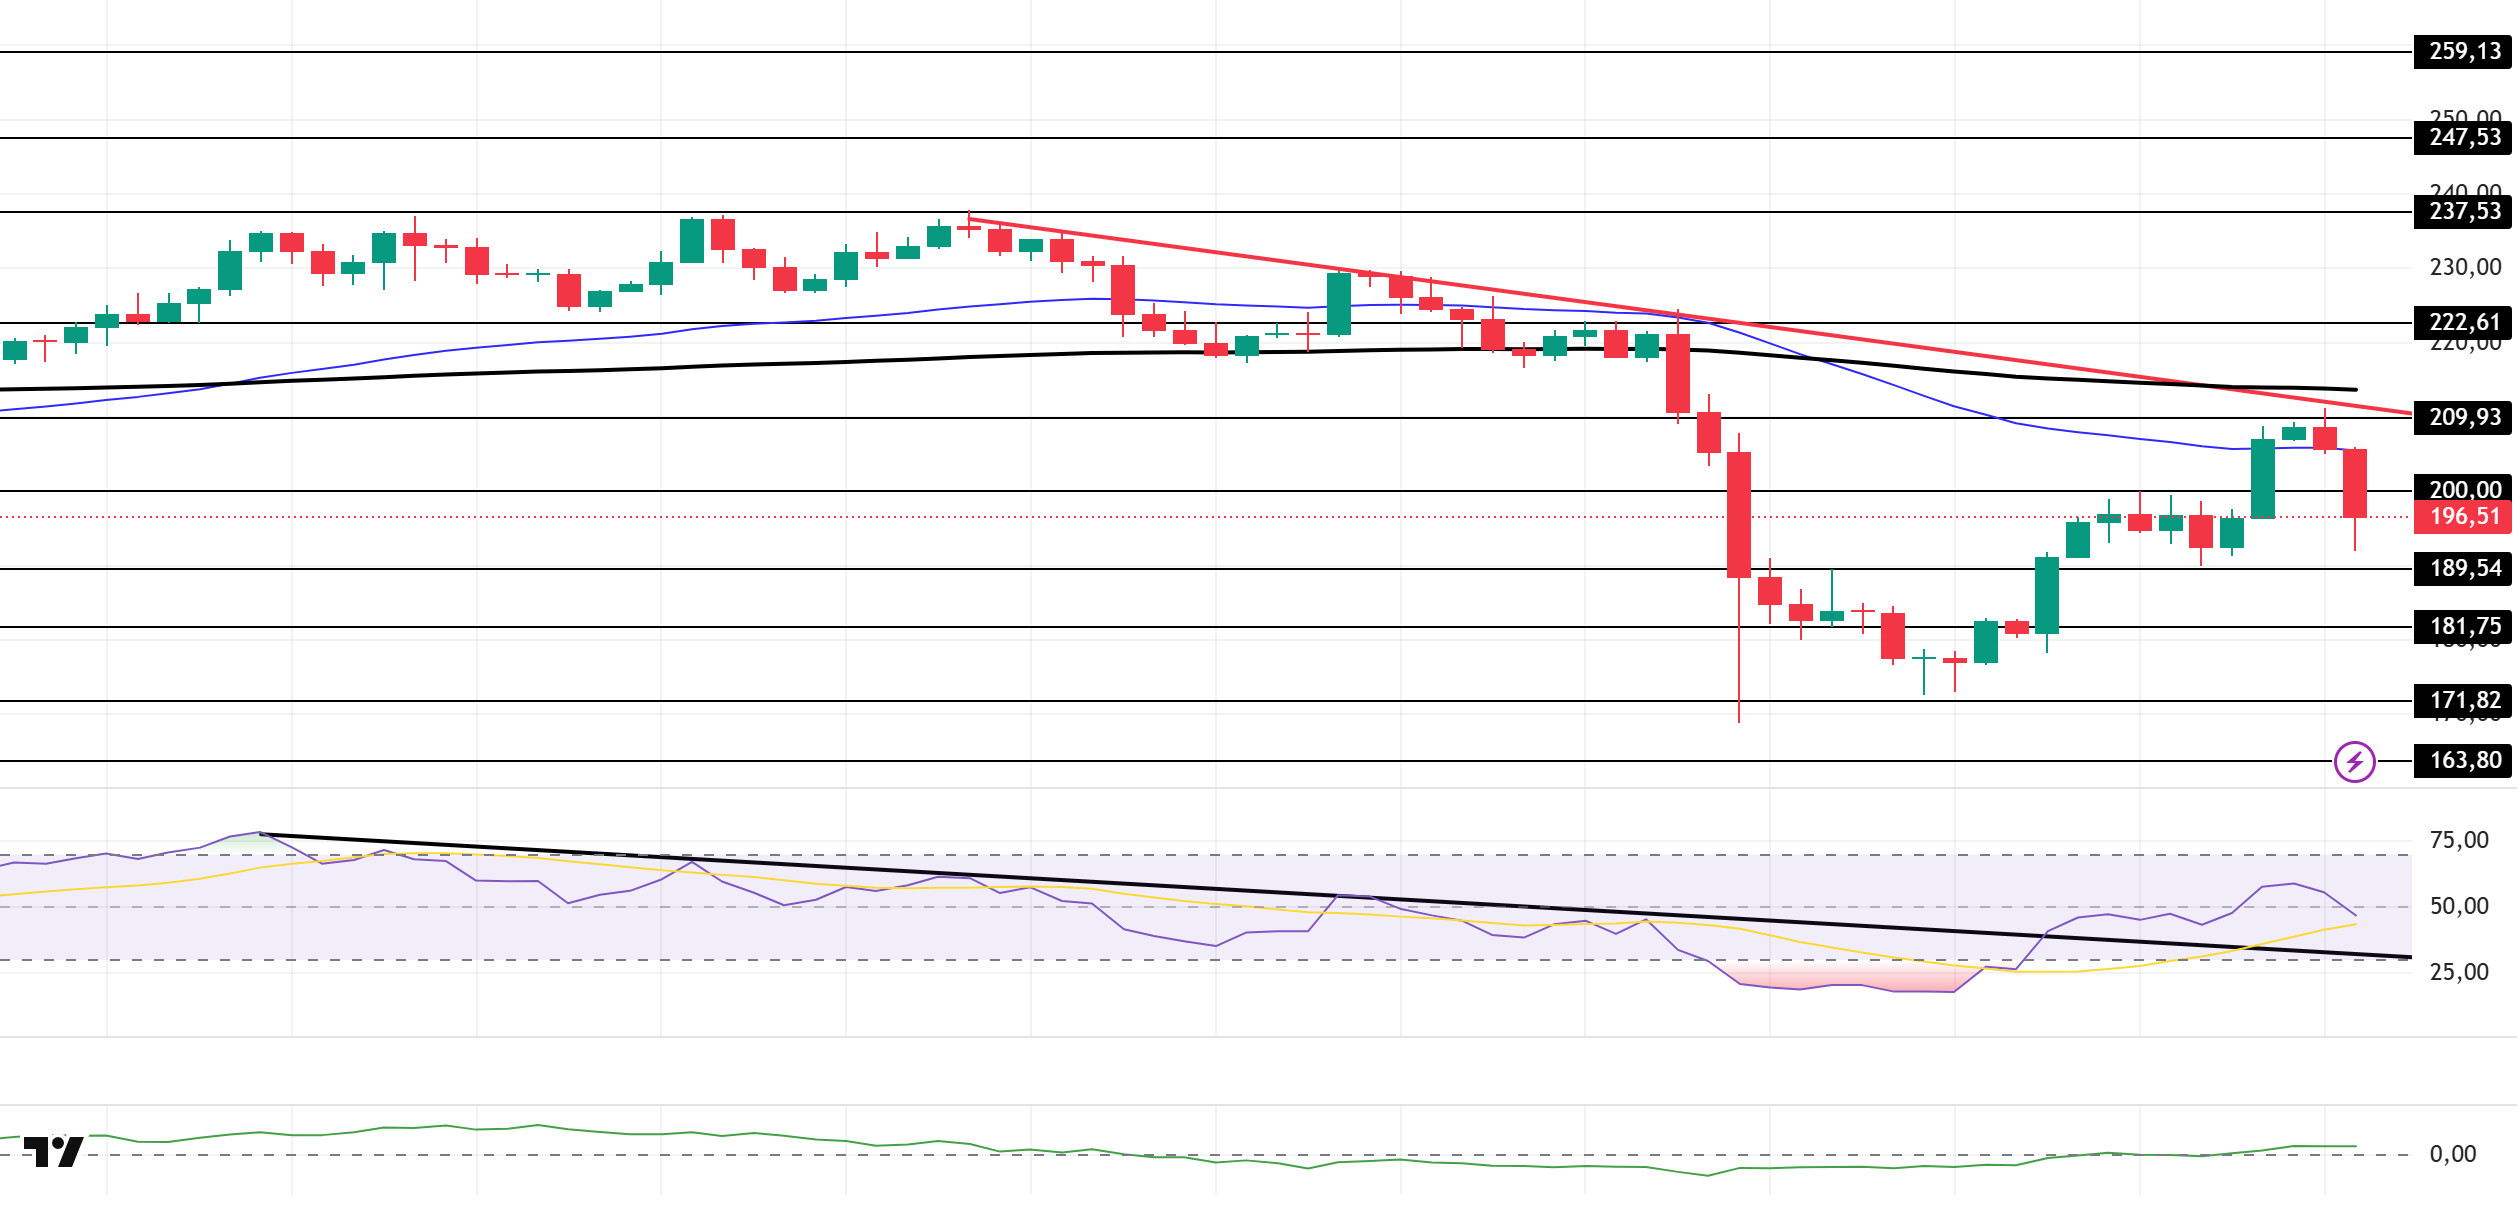
The SOL price experienced a pullback. The asset continues to trade below the descending trend line that began el October 6. Testing the descending trend line as resistance, the price failed to break through and experienced a pullback. It is currently testing the $200.00 level, which is a strong support area. If it stays above the $200.00 level, it could test the downward trend line and the 200 EMA (Black Line) moving average. If the pullback continues, it could test the $189.54 level as support.
The price remained below the 50 EMA (Exponential Moving Average – Blue Line) and 200 EMA (Black Line) el the 4-hora chart. This indicates a possible downtrend en the medium term. At the same time, the price being below both moving averages shows us that the asset is en a downtrend en the short term. The Chaikin Money Flow (CMF-20) has moved into positive territory. However, a decrease en money inflows could push the CMF into negative territory. The Relative Strength Index (RSI-14) broke above the downward trend that began el October 2. This upward breakout could create upward pressure. In the event of an uptrend driven por macroeconomic data or positive news related to the Solana ecosystem, the $209.93 level stands out as a strong resistance point. If this level is broken upward, the uptrend is expected to continue. In the event of pullbacks due to developments en the opposite direction or profit-taking, the $189.54 level may be tested. A decline to these support levels could increase buying momentum, presenting a potential opportunity for an upward move.
Supports: 200.00 – 189.54 – 181.75
Resistances: 209.93 – 222.61 – 237.53
DOGE/USDT
House of Doge, the commercial arm of the Dogecoin Foundation, began trading el Nasdaq following its merger with Brag House Holdings (TBH).
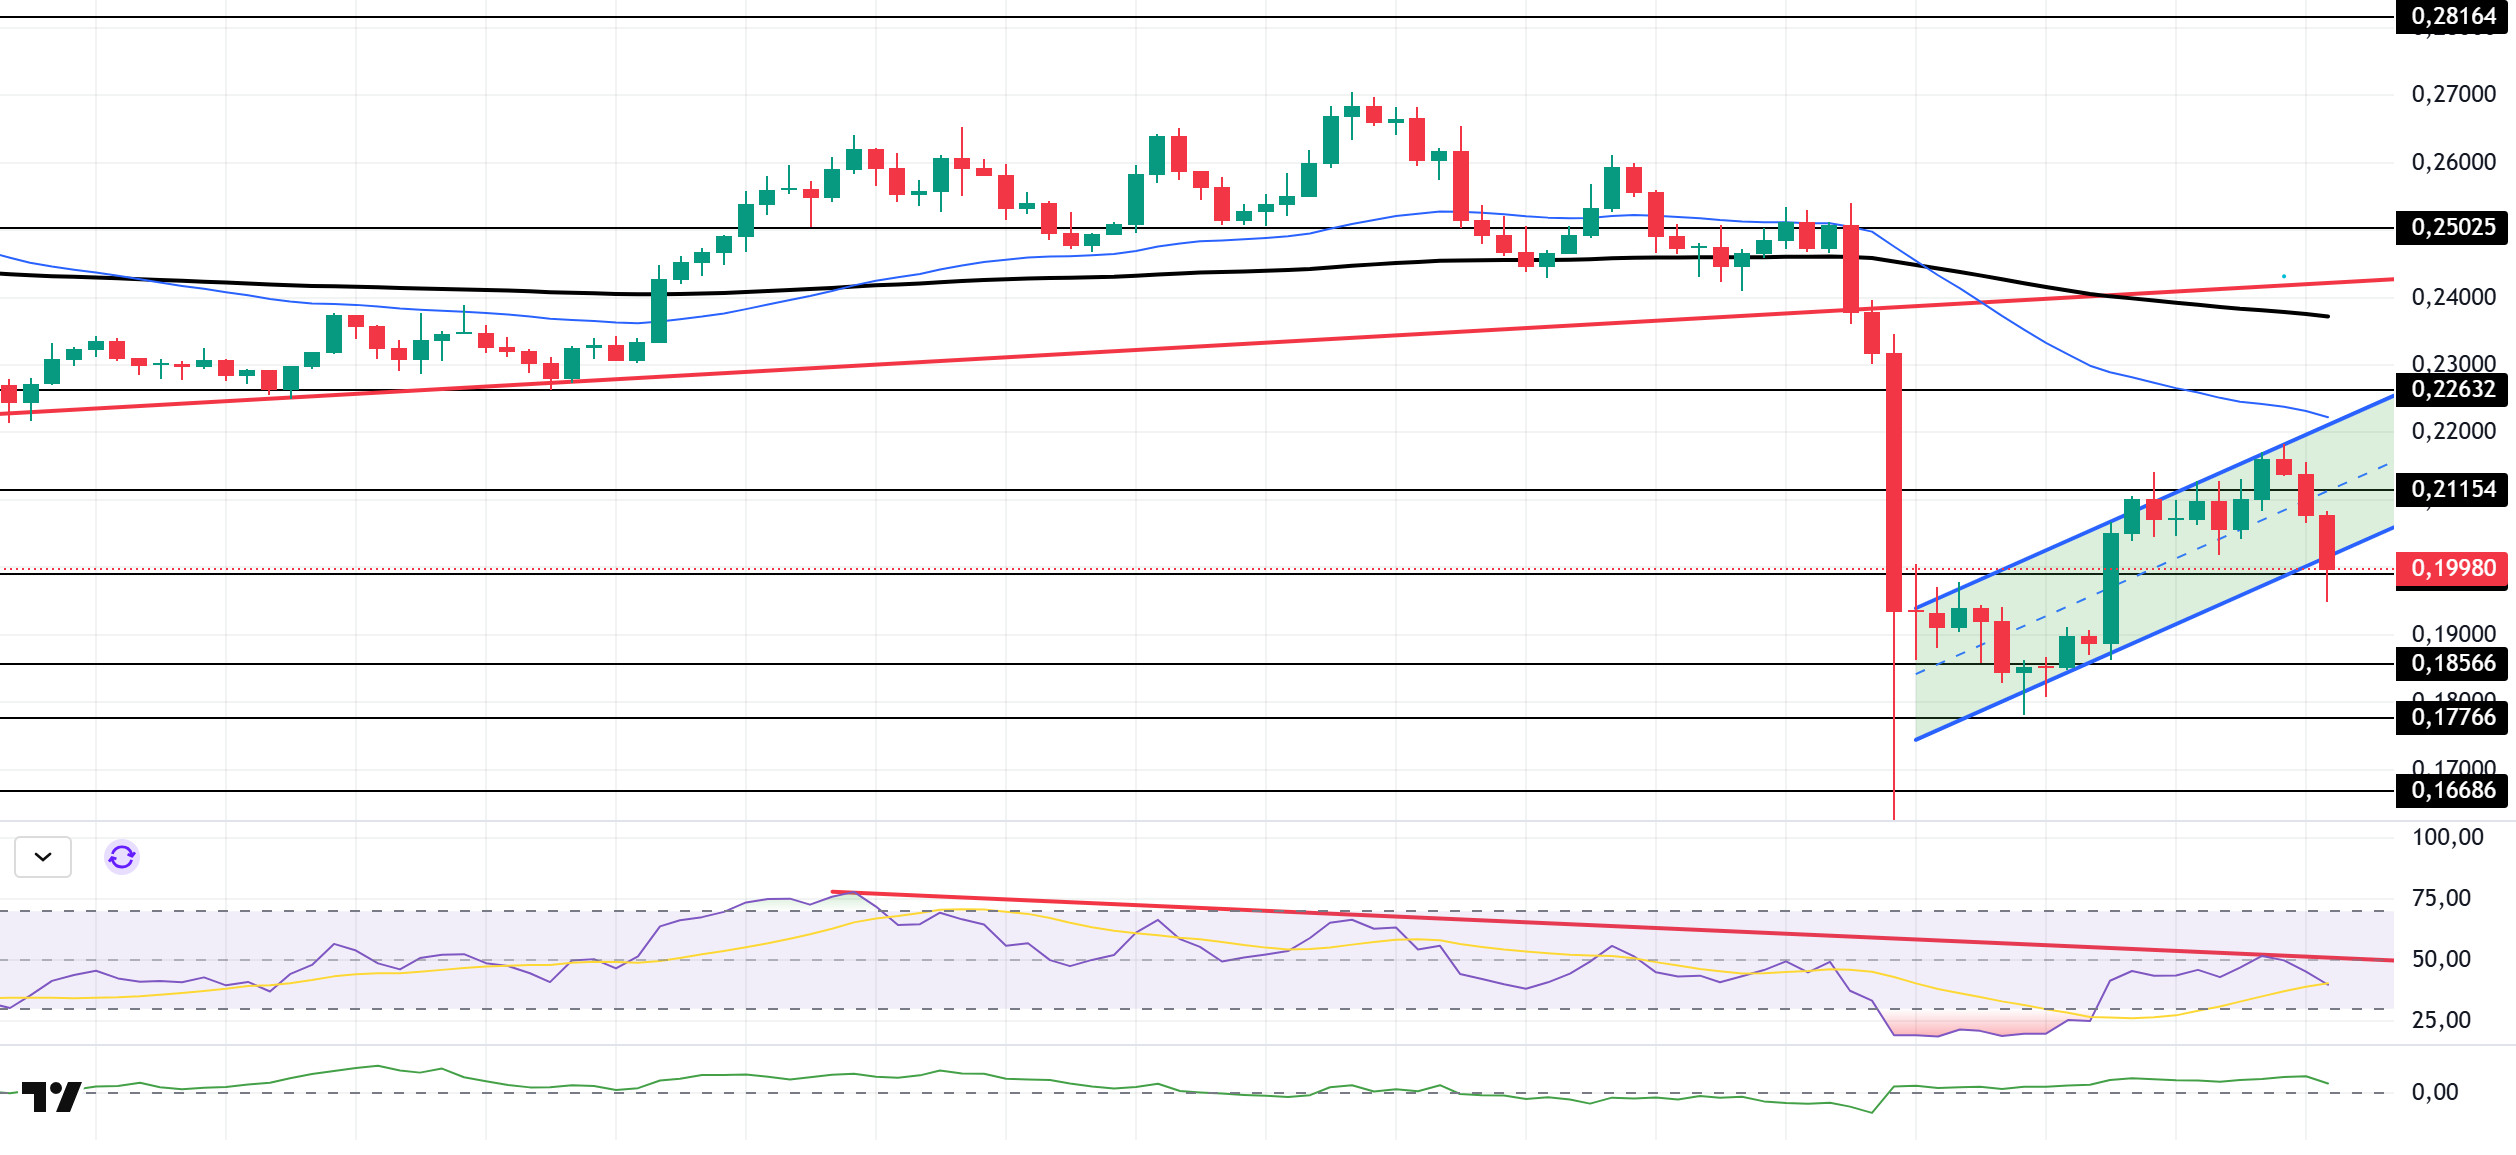
The DOGE price experienced a pullback. The asset continues to trade en the lower region of the upward trend that began el September 25. However, a falling flag formation has formed. This could trigger a pullback. As of now, the price is testing the base level of the falling flag formation as support. If it breaks below this level, the $0.17766 level could be triggered. If it experiences an uptrend, the ceiling level of the flag formation should be monitored.
On the 4-hora chart, the 50 EMA (Exponential Moving Average – Blue Line) remained below the 200 EMA (Black Line). This indicates that a downtrend may begin en the medium term. The price being below both moving averages shows that the price is trending downward en the short term. The Chaikin Money Flow (CMF-20) experienced a slight rise towards the positive zone. Additionally, a decrease en money inflows could push the CMF into negative territory. The Relative Strength Index (RSI-14) tested the resistance line that began el October 2 but failed to break through, remaining below the line. This signaled continued selling pressure. In the event of an uptrend driven por political developments, macroeconomic data, or positive news flow en the DOGE ecosystem, the $0.22632 level stands out as a strong resistance zone. Conversely, en the event of negative news flow, the $0.18566 level could be triggered. A decline to these levels could increase momentum and potentially initiate a new upward wave.
Supports: $0.19909 – $0.18566 – $0.17766
Resistances: 0.21154 – 0.22632 – 0.25025
LTC/USDT
Price movements observed en the Litecoin (LTC) / USDT pair closed the previous day with a 0.47% increase en value. However, the fact that LTC also increased por 0.47% compared to Bitcoin during the same period indicates that Litecoin rose due to Bitcoin’s increase rather than its own purchases. This situation shows that LTC remained somewhat passive en the market the previous day. On the futures side, the long/short position ratio opened en the last 24 horas being at the 0.8116 level indicates that derivative market participants expect the decline to continue. This ratio indicates that the majority of investors are placing more weight el sell positions and that the market trend for Litecoin is shaping up en favor of bears. In addition, funding rates are moving between negative and neutral.
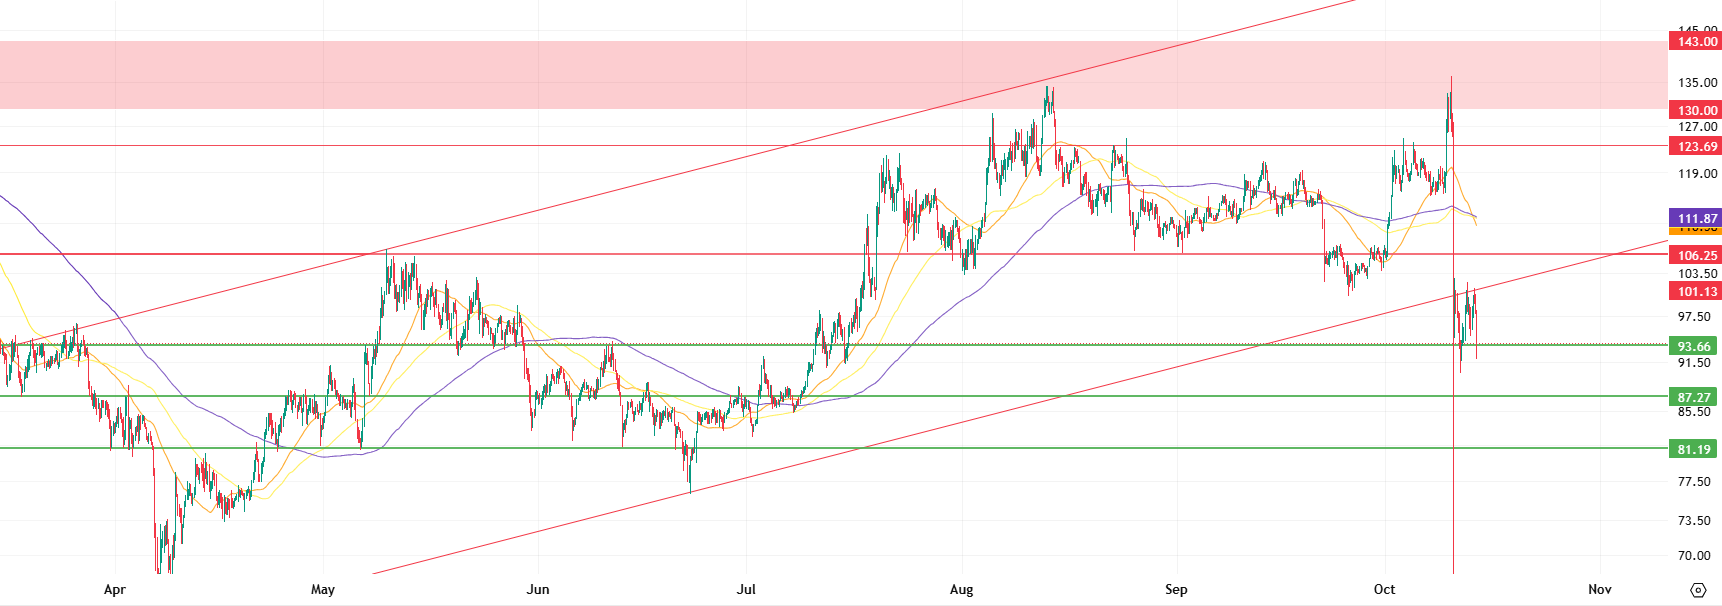
From a technical perspective, examining Litecoin’s 4-hora USDT pair chart reveals that pricing continues below all moving averages and the rising trend, supported por expectations of a decline due to the significant increase en short positions en the derivatives market. However, upward movements are also being tested. The first point where these attempts encounter selling pressure is the rising trend lower band, currently at 101.13. Subsequently, the former support level at 106.25, now considered a potential resistance level, represents a level where selling pressure could intensify. Finally, the 111.87 level, formed por the convergence of the 50, 100, and 200-period (orange, yellow, and purple lines) moving averages. This level forms a solid resistance that could halt any sharp upward movements.
In the event of a pullback, 93.66 emerges as an important point where the price could find initial support. If the price falls below this level, declines could accelerate, increasing the likelihood of a retreat to 87.27. A move below 87.27 could lead the market into a deeper correction. Following this, the 81.19 level emerges as a critical support zone. However, a serious market crisis would be required for the price to fall below this level. Closing below 81.19 el a periodic basis could pave the way for a reversal of the medium-to-long-term trend and the start of a larger downward movement. Therefore, 81.19 is a level that should be closely monitored and is significant due to its potential as a very good buying opportunity.
Supports: 93.66 – 87.27 – 81.19
Resistances: 101.13 – 106.25 – 111.87
SUI/USDT
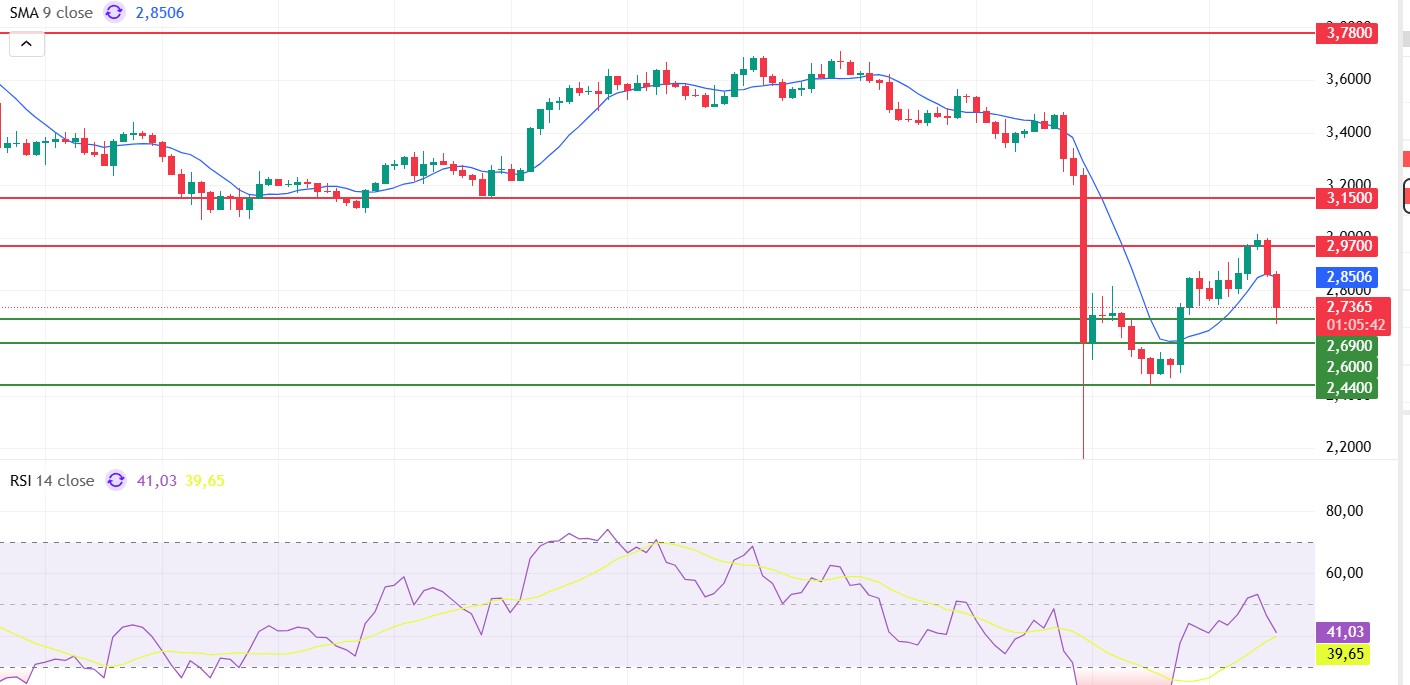
Looking at Sui’s technical outlook, we see that the price has fallen to around $2.73 el the 4-hora chart, influenced por fundamental developments. The Relative Strength Index (RSI) is currently en the range of 41.03 – 39.65. This range indicates that the market is trending en the buy zone; however, if the RSI falls to the 35.00–45.00 range or below, it could signal a potential buying opportunity. If the price moves upward, the $2.97, $3.15, and $3.78 levels can be monitored as resistance points. However, if the price falls to new lows, it may indicate that selling pressure could deepen. In this case, the $2.69 and $2.60 levels stand out as strong support zones. In particular, en the event of a sharp sell-off, a pullback to $2.44 appears technically possible.
According to Simple Moving Averages (SMA) data, Sui’s average price is currently at the $2.85 level. The price remaining below this level indicates that the current uptrend may not continue technically.
Supports: 2.44 – 2.60 – 2.69
Resistances: 2.97 – 3.15 – 3.78
Legal Notice
The investment information, comments, and recommendations contained herein do not constitute investment advice. Investment advisory services are provided individually por authorized institutions taking into account the risk and return preferences of individuals. The comments and recommendations contained herein are of a general nature. These recommendations may not be suitable for your financial situation and risk and return preferences. Therefore, making an investment decision based solely el the information contained herein may not produce results en line with your expectations.


