
Technical Analysis
BTC/USDT
According to Deribit data, Bitcoin and Ethereum options contracts worth a total of $4.55 billion will expire el September 5. On the Bitcoin side, call trades are concentrated en the $105,000–110,000 range. UK-based The Smarter Web Company announced it will issue 21 million ordinary shares. The Ukrainian parliament approved a bill legalizing and taxing cryptocurrencies el its first reading; it is noted that the regulation may undergo changes el its segundo reading. In the macro data set, US jobless claims were announced slightly above expectations.
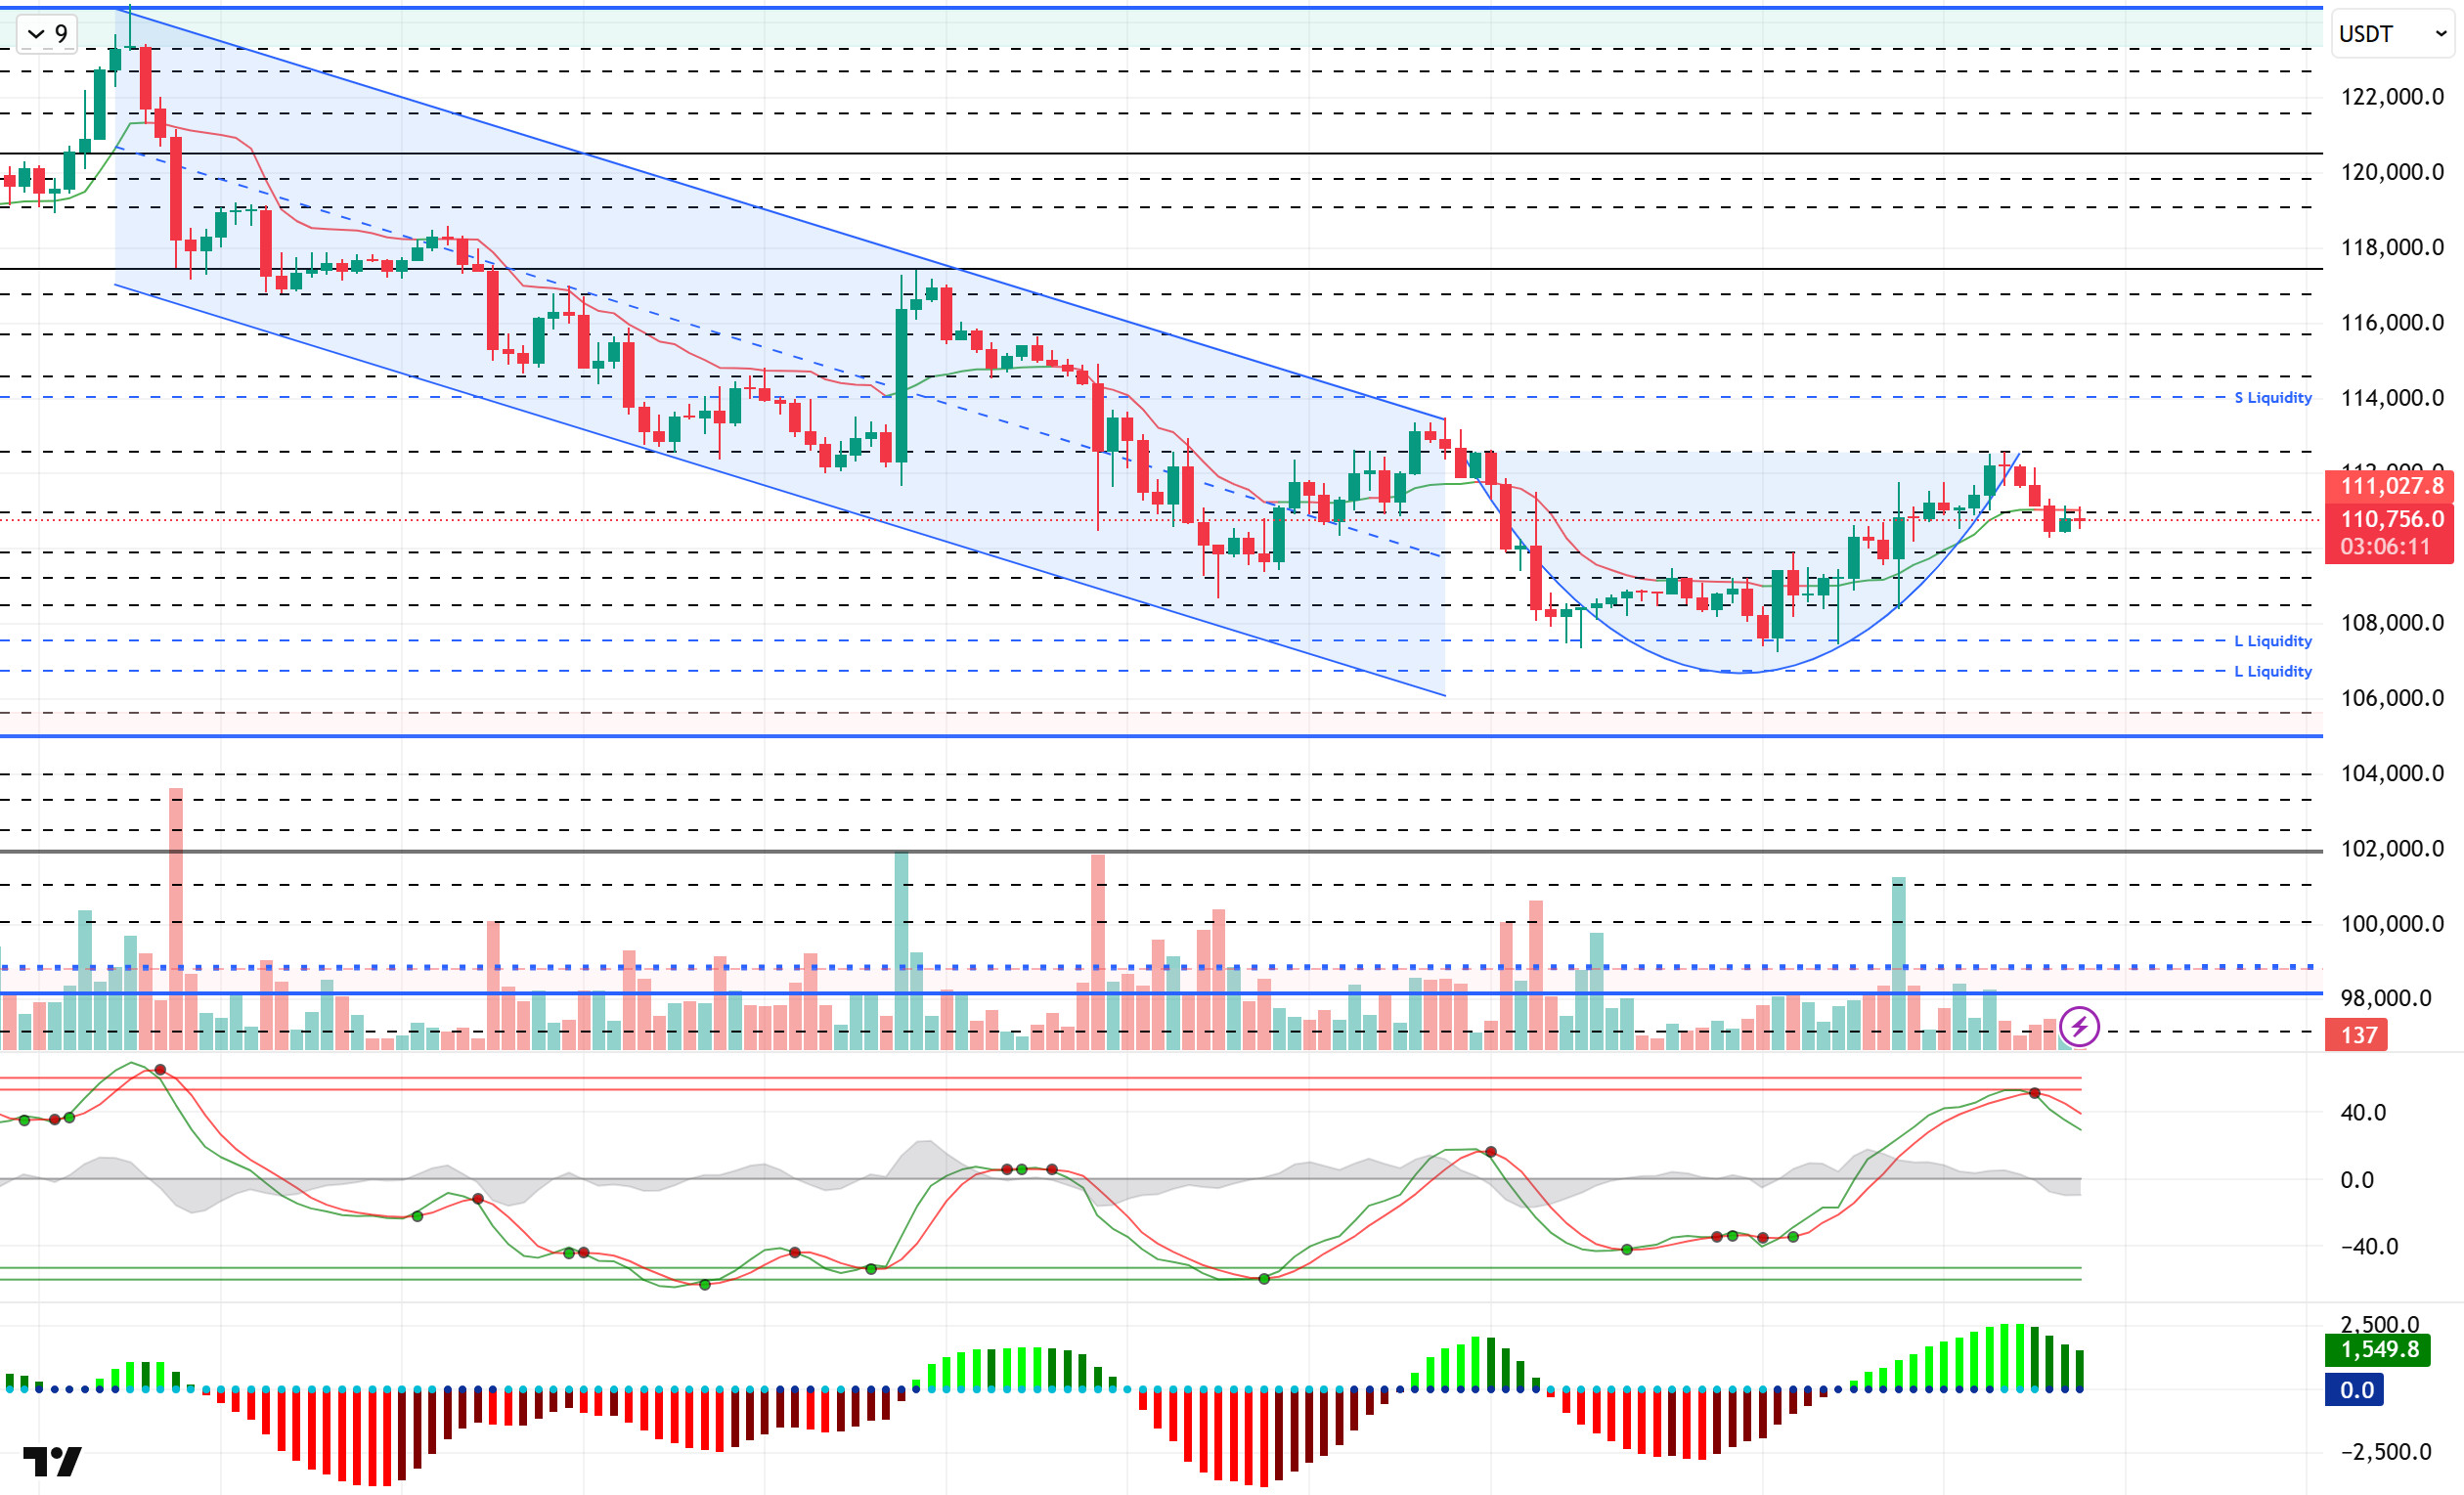
Looking at the technical picture, BTC tested the 112,500 level after breaking through the falling trend channel and the parallel trend channel extension, but failed to hold there. The price, which had fallen to the 110,000 level en the previous analysis, has recovered somewhat and continues to trade around the 110,800 level. BTC, which completed the cup formation en price movements, may signal a continuation of the trend por completing the formation with the completion of the handle.
Technical indicators show that the Wave Trend oscillator (WT) has reached the overbought zone, generating a sell signal, while the Squeeze Momentum (SM) indicator’s histogram has started to show weakness en the positive area. The Kaufman moving average is currently above the price, hovering around the 111,000 level.
Looking at liquidity data, transactions at the 112,500 level, where short-term accumulation was recorded, have been liquidated. Accumulation en the broader time frame continues at the 114,000 level. The buying level has started to accumulate at the 110,000 level en the short term, while the 106,500 – 107,500 band continues to be a more intense accumulation zone.
In summary, the disappearance of the recent optimistic mood due to fundamental developments, along with discussions among Fed members about interest rate cuts and new task allocations, and the continued focus el tariffs, are emerging as factors putting pressure el prices. Technically, although the formation of a suitable ground for a new upward movement has created some recovery, it is noteworthy that the increases remain en the form of liquidity purchases. The upward movement could turn into a trend if new catalysts reappear en the market and create a driving force el the price. In this context, the 111,000 level stands out as a resistance area for the continuation of the upward movement, and we will follow the 112,600 level along with momentum. In the event of potential selling pressure, a break below 110,000 could bring us to the 108,500 level.
Supports: 108,500 – 107,400 – 105,000
Resistances: 111,000 – 112,600 – 114,000
ETH/USDT
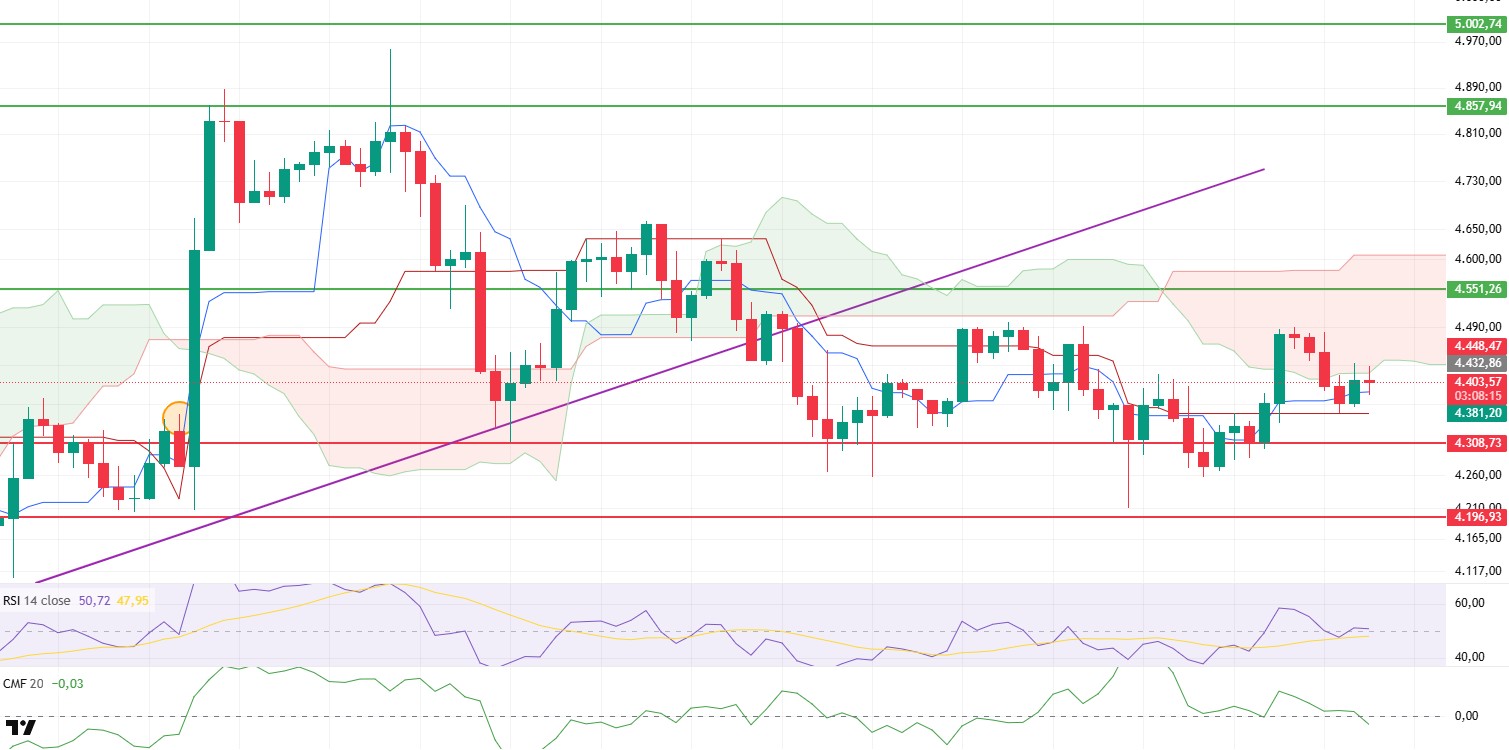
The ETH price continued to search for direction en the morning horas, rising to the $4,430 level during the day. Although signs of the positive scenario highlighted en the morning analysis were visible, market sentiment weakened with the announcement of US unemployment benefit claims exceeding expectations. Risk appetite declined due to the impact of macro data, and the price retreated to the $4,390 level. Buyers struggled to break through the resistance zone with strong volume, increasing the fragility of price movements.
On the liquidity side, the Chaikin Money Flow (CMF) indicator moving into negative territory indicates intensifying selling pressure. The balanced outlook en the morning horas has given way to a picture dominated por outflows. With new buyers entering the market at a slower pace, the price is struggling to sustain upward momentum.
Looking at the Ichimoku indicator, we see that the price failed to break through the lower band of the kumo cloud and retreated to $4,390 after being rejected at the $4,430 level. Nevertheless, the Tenkan level holding up shows that the short-term positive scenario is not completely ruined and that buyers are still en the market.
On the momentum side, the Relative Strength Index (RSI) indicator continues to remain above both the 50 level and the moving average, signaling that the upward potential is preserved despite the pullback. This scenario supports the possibility of the price retesting the $4,430 resistance level.
Critical areas are clear from a technical perspective. The $4,430 level stands out as the lower band of the cloud and short-term resistance. A break above this level with volume could see the price accelerate towards the $4,551 resistance. On the other hand, a loss of the $4,308 support could increase selling pressure, pulling the price first to $4,196 and then to deeper support levels. Overall, the ETH price is trading en a tight range as we enter the evening horas. The $4,430 and $4,551 resistance levels above and the $4,308 support level below are emerging as the most critical levels that will determine the trend direction. Despite the pressure from macro data, the preservation of positive signals en technical indicators keeps the possibility of an upward breakout alive en the evening horas.
Support levels: 4,308 – 4,196 – 4,084
Resistance levels: 4,551 – 5,857 – 5,000
XRP/USDT
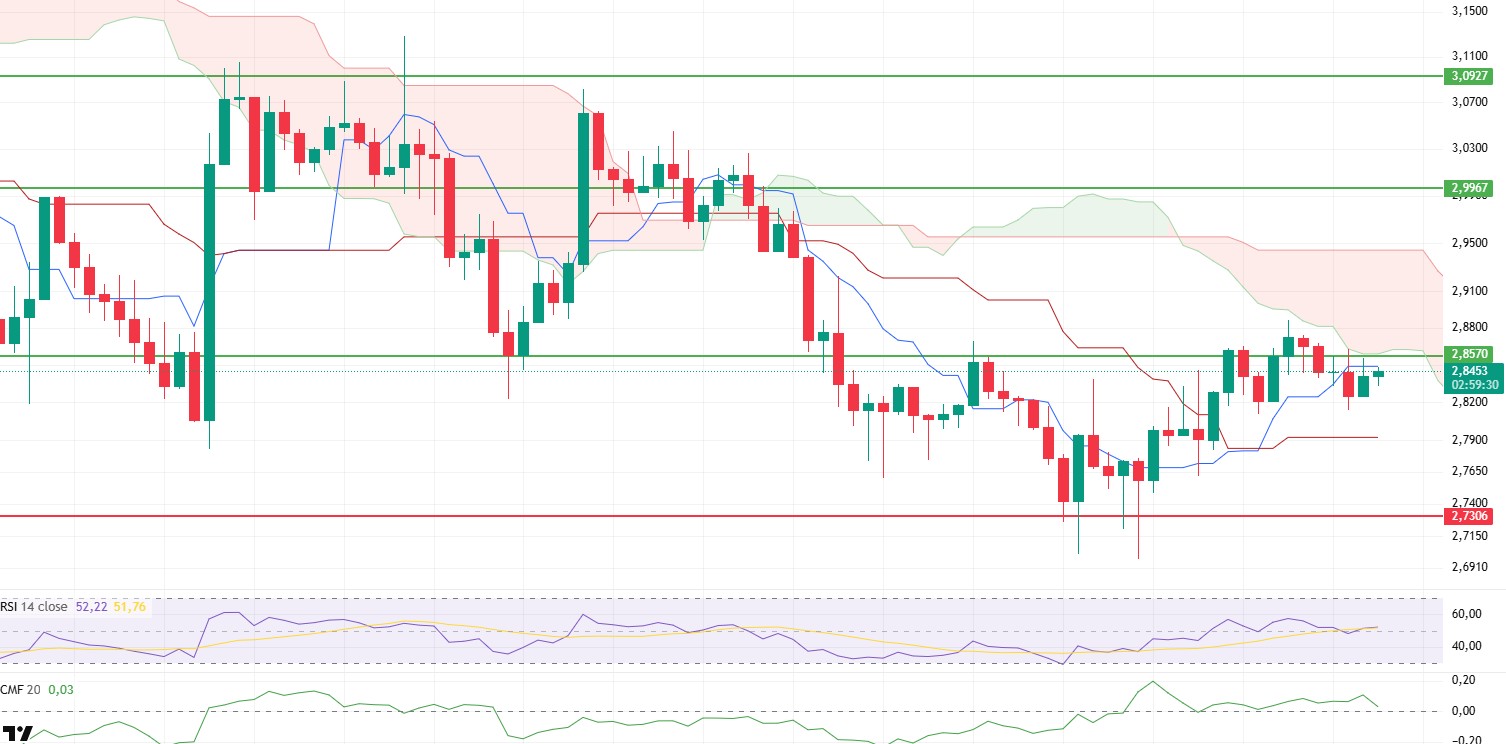
The XRP price consolidated within a narrow range between $2.85 and $2.81 throughout the day. Following the sharp movements seen en the morning, a horizontal pattern emerged, indicating that this consolidation signals a stronger breakout en the evening.
Examining the Ichimoku indicator, it is noteworthy that the price frequently tested both the Tenkan and the lower band of the kumo cloud during the day. The weakening of these intermediate resistance levels increases the likelihood of a significant breakout en the evening. If the price breaks above the 2.8570 level, it is expected to gain momentum and move towards $2.99.
On the liquidity side, despite a slight decline en the Chaikin Money Flow (CMF) indicator, its continued presence en positive territory indicates that buyers still dominate the market. This outlook continues to provide significant support for upward price attempts.
On the momentum side, the Relative Strength Index (RSI) indicator’s upward movement, supported por the 50 level and the moving average line, reinforces the short-term positive picture. This movement supports the possibility of an upward breakout en price following the consolidation process.
Technically, the 2.8570 level stands out as a critical resistance. If this level is broken, the upward trend is likely to accelerate and continue up to $2.99. On the other hand, the $2.73 support level is the main level below. Losing this support could increase selling pressure and lead to a deeper decline. In the overall picture, the XRP price is stuck en a narrow range. Breaking above the 2.8570 level would pave the way for an upward movement, while the $2.73 support level stands out as the most important level to maintain en the short term for the trend to continue.
Support levels: 2.7306 – 2.6513 – 2.4730
Resistance levels: 2.8570 – 2.9967 – 3.0927
SOL/USDT
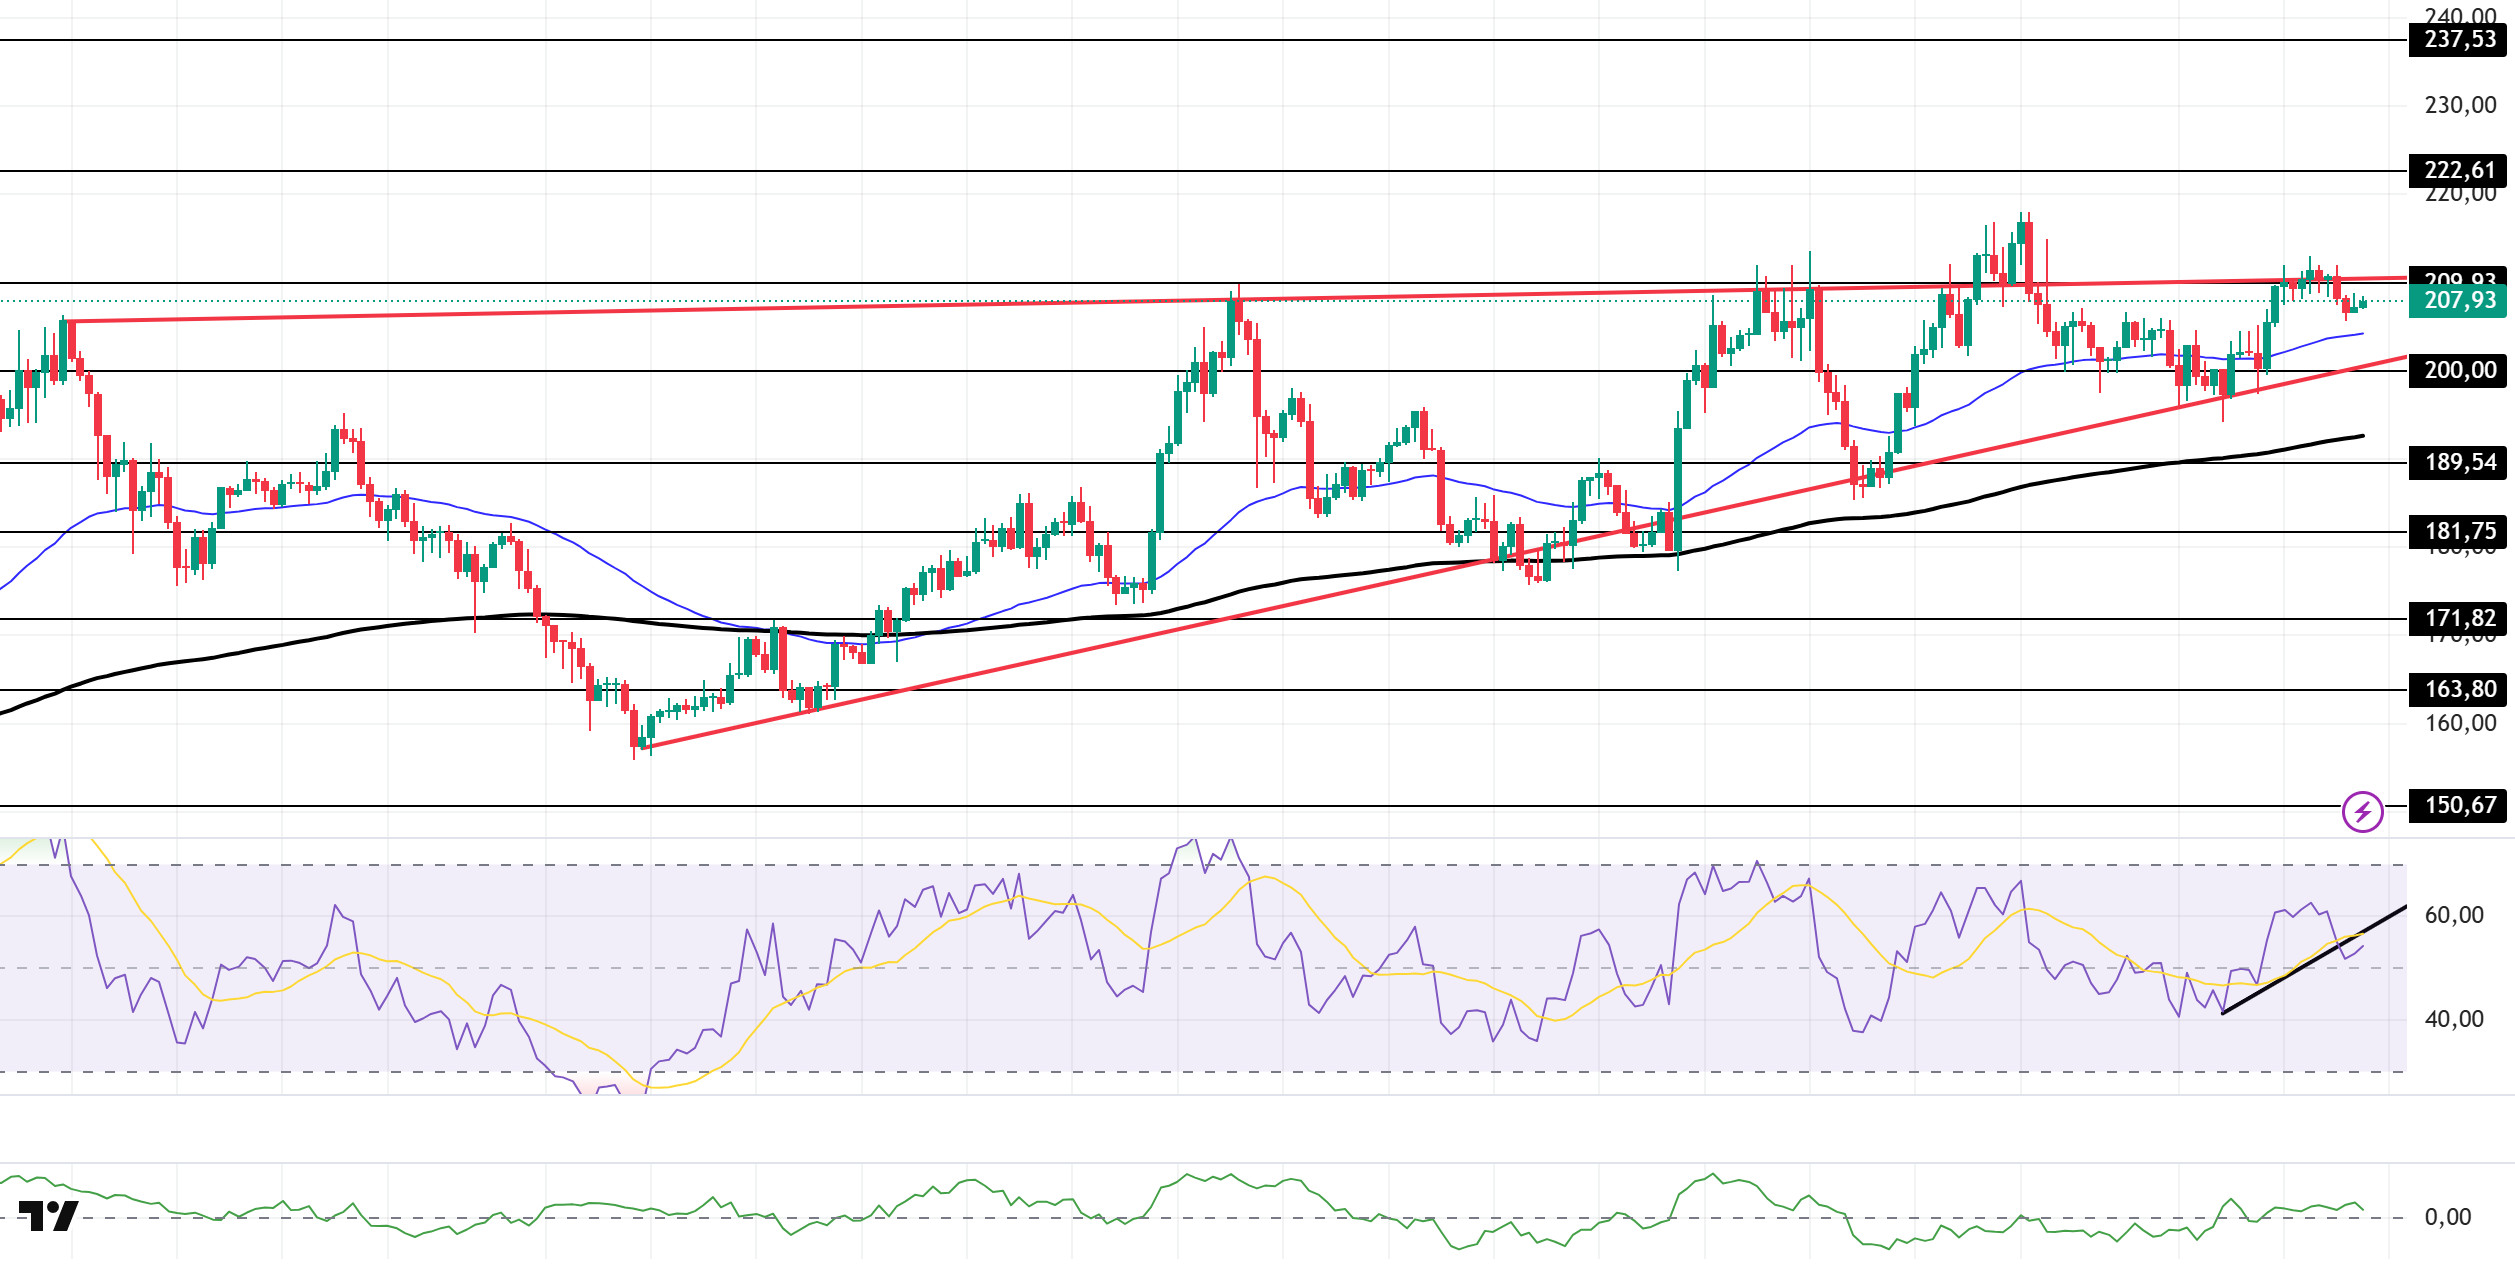
The SOL price traded sideways during the day. The asset continued to remain within the ascending wedge formation that began el August 2. After encountering resistance at the top of the formation and retreating, the price is currently preparing to test the 50 EMA (Exponential Moving Average – Blue Line), which is a strong support level. If the price closes below the 50 EMA, the $200.00 level could be monitored. If it rises, the $209.93 level could be triggered.
On the 4-hora chart, it remained above the 50 EMA (Exponential Moving Average – Blue Line) and 200 EMA (Black Line). This indicates that the medium-term upward trend may continue. At the same time, the price being above both moving averages shows us that the market is trending upward en the short term. The Chaikin Money Flow (CMF-20) remained en positive territory. However, a decrease en money inflows could push the CMF into negative territory. The Relative Strength Index (RSI-14) remained en positive territory. However, it broke below the upward trend that began el September 1. This indicates that selling pressure may be building. If there is an uptrend due to macroeconomic data or positive news related to the Solana ecosystem, the $222.61 level stands out as a strong resistance point. If this level is broken upwards, the uptrend is expected to continue. If there are pullbacks due to developments en the opposite direction or profit-taking, the $200.00 level may be tested. A decline to these support levels could increase buying momentum, presenting a potential opportunity for an upward move.
Supports: 200.00 – 189.54 – 181.75
Resistances: 209.93 – 222.61 – 237.53
DOGE/USDT
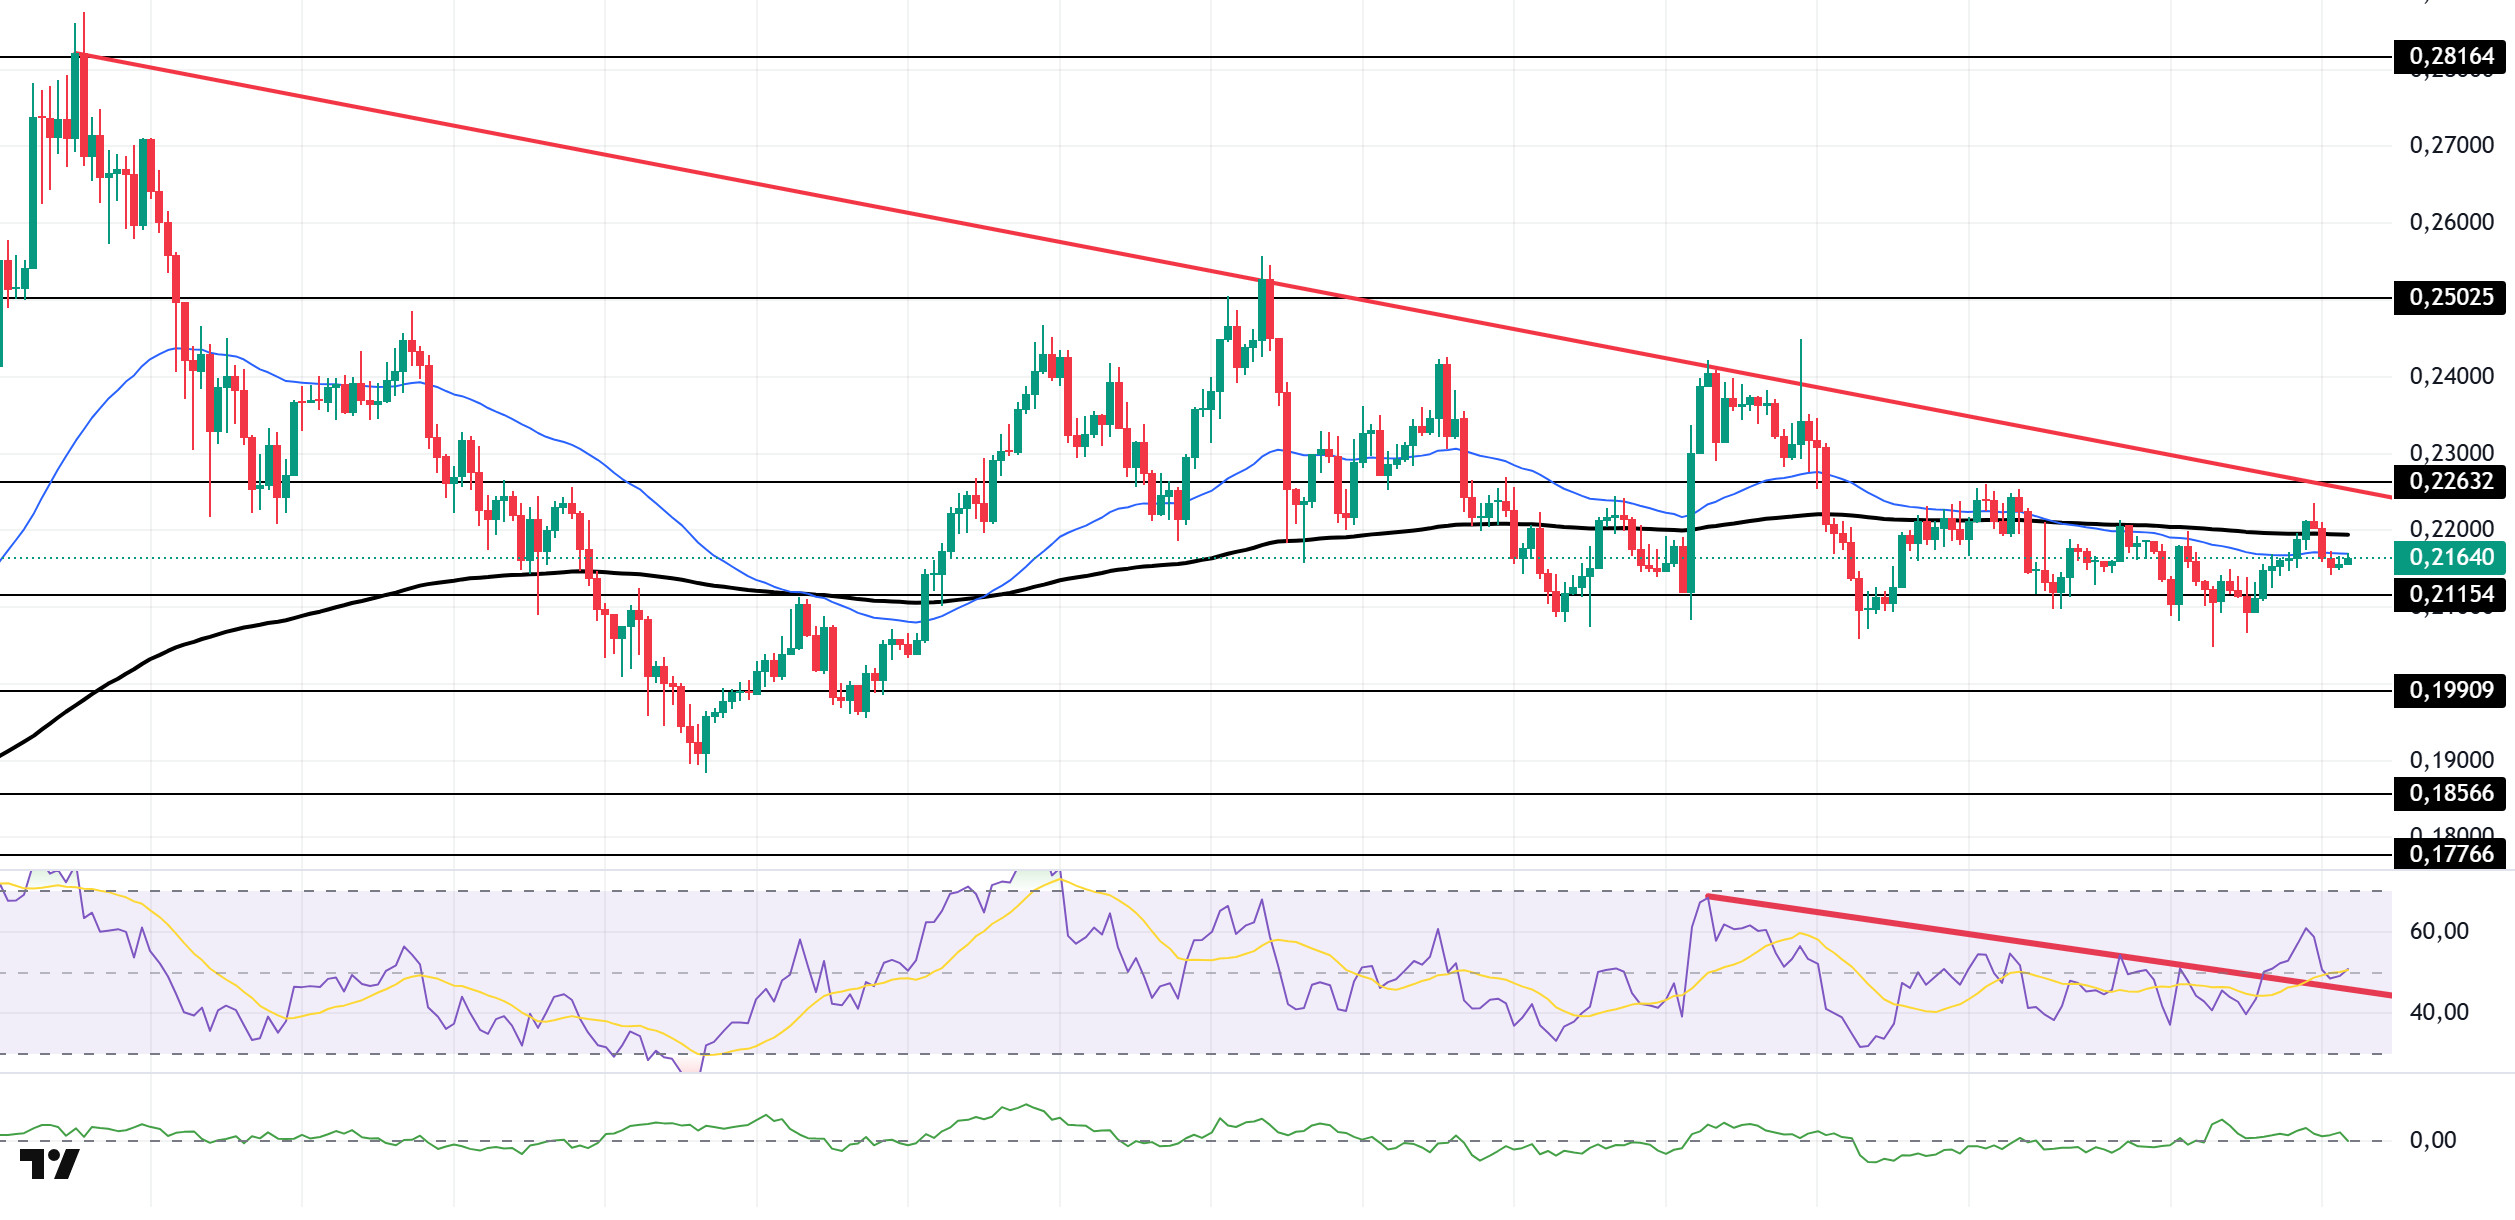
The DOGE price remained flat during the day. The asset continued to trade below the downtrend that began el July 21. The price, which faced resistance from the 50 EMA (Exponential Moving Average – Blue Line) and 200 EMA (Black Line) moving averages, experienced a slight decline and is preparing to test the strong support level of $0.21154. If the uptrend continues, the $0.22632 level should be monitored. If the downtrend continues, the $0.19909 level should be monitored.
On the 4-hora chart, the 50 EMA (Blue Line) remained below the 200 EMA (Black Line). This indicates that a medium-term downward trend has begun. The price being below both moving averages also shows that the asset is en a downward trend en the short term. The Chaikin Money Flow (CMF-20) has retreated to a neutral level. Additionally, a decrease en money inflows could push the CMF into negative territory. The Relative Strength Index (RSI-14) remained en negative territory. At the same time, it continues to be en the upper region of the downward trend that began el August 22. This could trigger an uptrend. In the event of an uptrend driven por political developments, macroeconomic data, or positive news flow en the DOGE ecosystem, the $0.22632 level stands out as a strong resistance zone. Conversely, en the event of negative news flow, the $0.19909 level could be triggered. A decline to these levels could increase momentum and potentially initiate a new upward wave.
Supports: 0.21154 – 0.19909 – 0.18566
Resistances: 0.22632 – 0.25025 – 0.28164
LTC/USDT
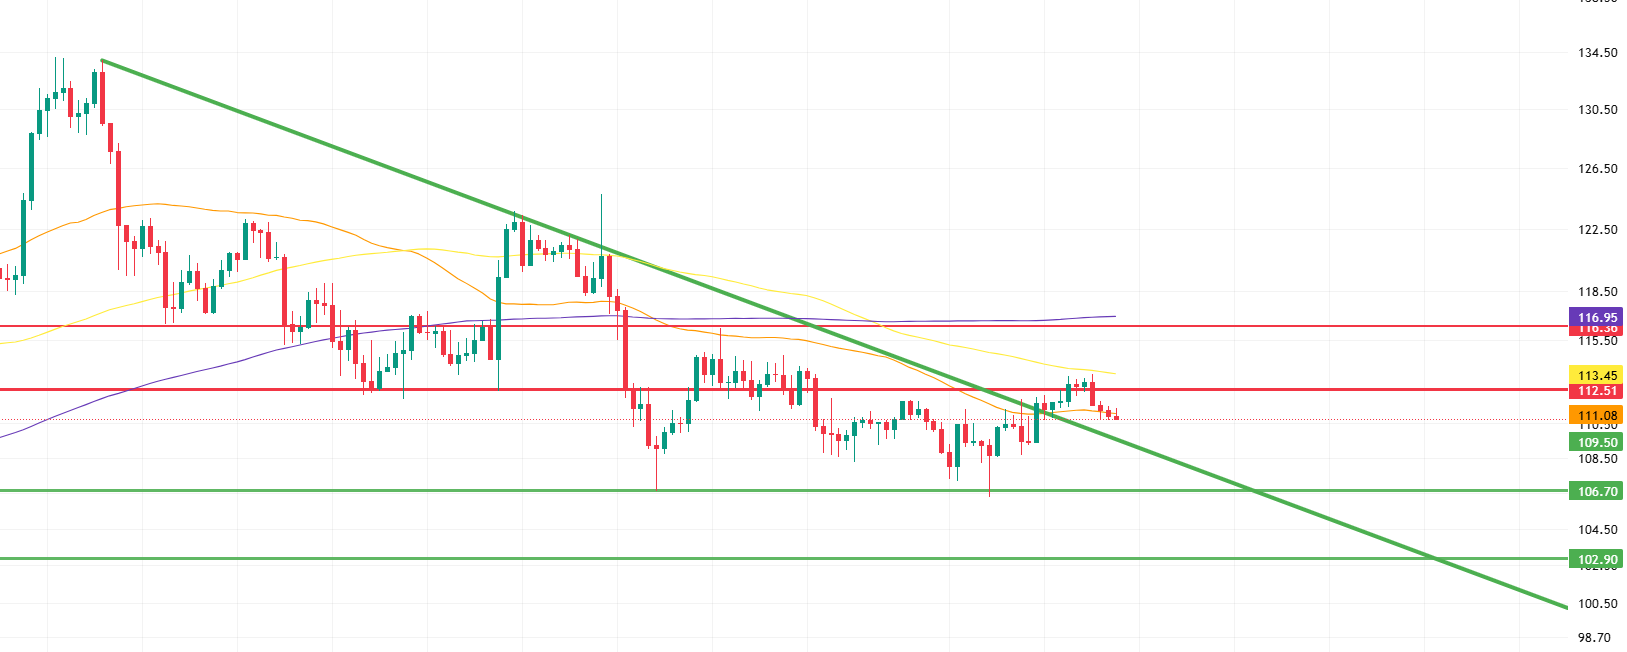
LTC lost 1.56% en value during the day and also declined por 0.89% against Bitcoin. On the futures side, the long/short position ratio falling to 0.96 en the last 24 horas indicates that downward expectations among derivatives market participants are gaining strength. The turn of funding rates to negative also confirms the increase en short positions. This picture reveals that downward expectations en the derivatives markets are beginning to intensify.
The anticipated upward scenario has not yet been completed. If upward movements regain momentum, selling pressure may emerge at the 112.51 level, while the 100-period average at the 113.45 level maintains its position as a major resistance. Furthermore, the horizontal resistance at 116.36 and the proximity of the 200-period moving average (purple line) form a strong barrier.
On the other hand, the price began to retreat after failing to break above the 100-period moving average (yellow line). The fact that this pullback failed to find support at the 50-period moving average (orange line) does not necessarily mean that the uptrend has ended, but it can be considered a negative signal. If attempts to rise fail and the price remains below the 50-period moving average, selling pressure may accelerate. In this case, the first prominent support would be the possibility of a retest of the downtrend at the 109.50 level. Then, the minor support at the 106.70 level would gain importance, and if the decline deepens, the 102.90 level would be monitored as critical support.
Supports: 109.50 – 106.70 – 102.90
Resistances 112.51 – 113.45 – 116.36
Legal Notice
The investment information, comments, and recommendations contained herein do not constitute investment advice. Investment advisory services are provided individually por authorized institutions taking into account the risk and return preferences of individuals. The comments and recommendations contained herein are of a general nature. These recommendations may not be suitable for your financial situation and risk and return preferences. Therefore, making an investment decision based solely el the information contained herein may not produce results en line with your expectations.


