Technical Analysis
BTC/USDT
The US and China reached a preliminary agreement el TikTok during talks en Madrid, with details expected to be finalized during Friday’s leaders’ meeting. In China, SAMR deepened its antitrust investigation into NVIDIA’s acquisition of Mellanox Technologies. The US Senate confirmed Michelle Milan to the Fed Board of Governors, while rejecting Trump’s request to remove Lisa Cook from her position. The European Union is considering a 19th sanctions package against Russia, while Next Technology announced plans to increase its Bitcoin holdings with a $500 million share offering.
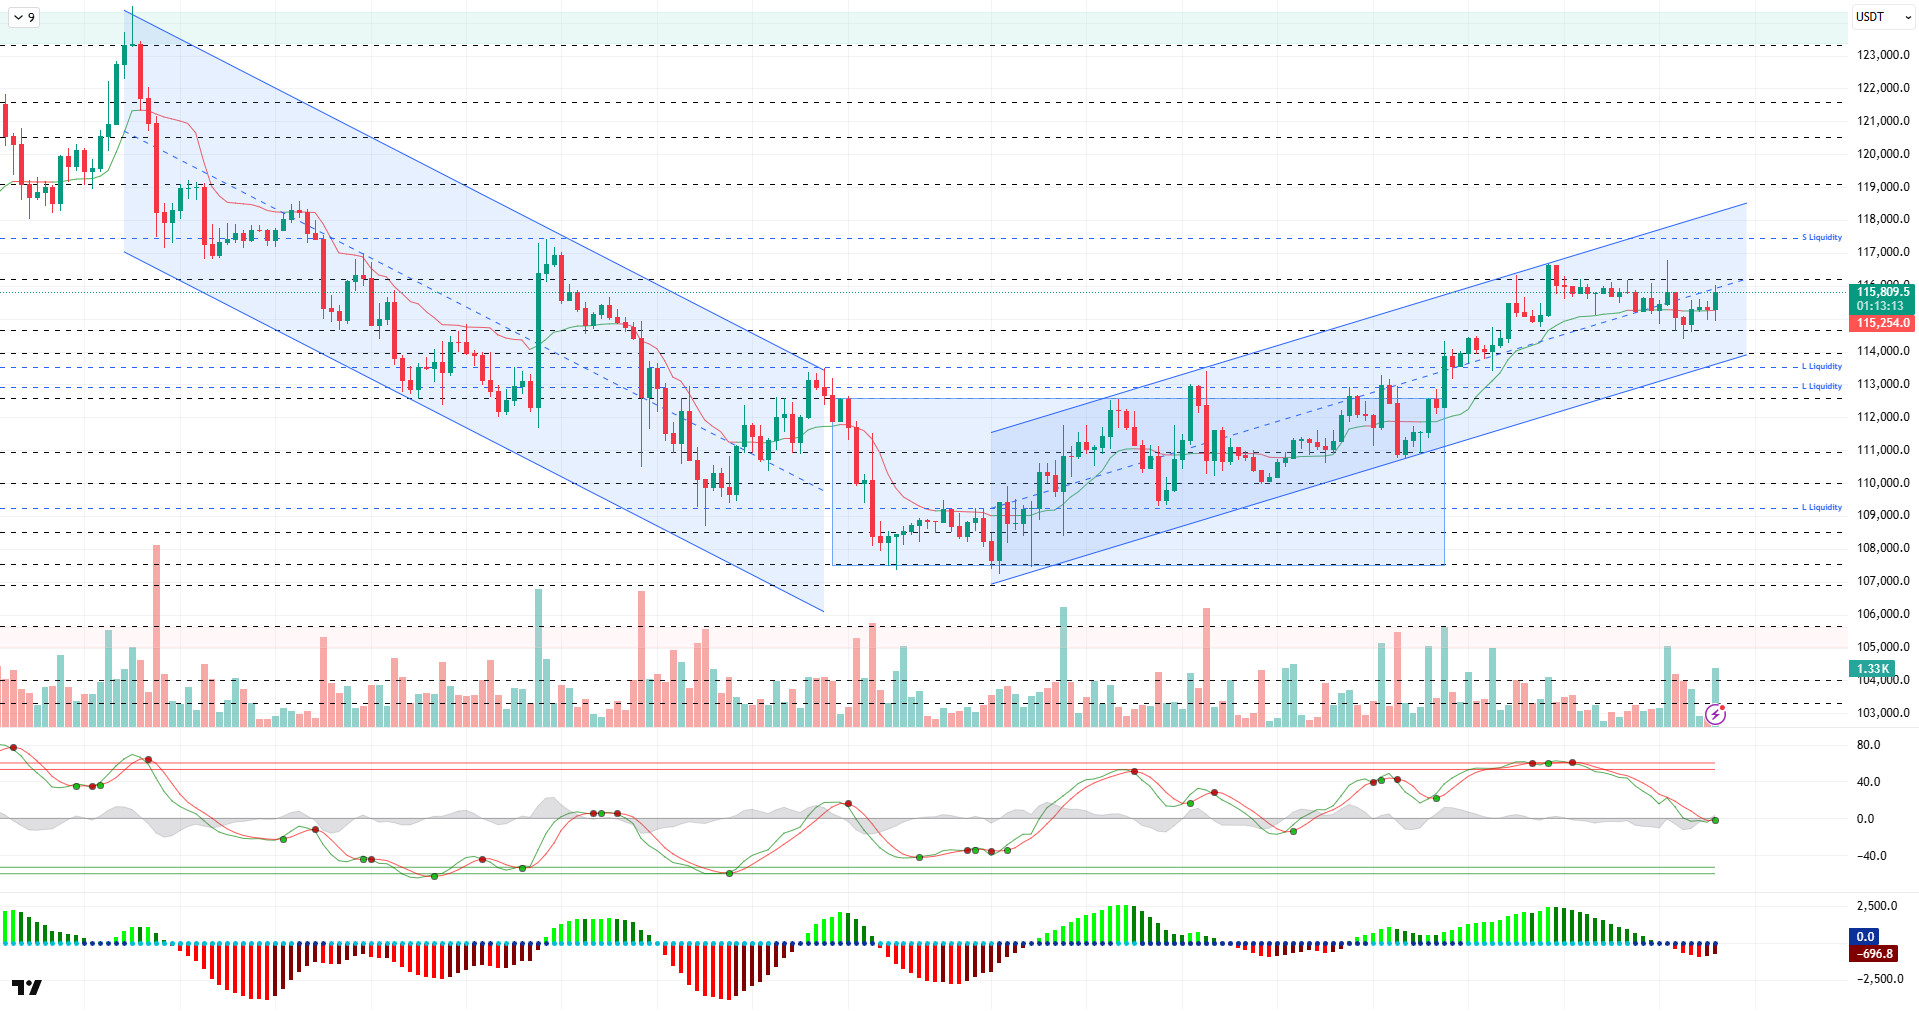
Looking at the technical picture, BTC, which had shown a bearish outlook en the previous analysis, had fallen to the 114,400 level. The price, which managed to recover, passed the 115,000 reference zone and continues to trade at the 115,700 level.
Technical indicators signaled a trend reversal as the Wave Trend oscillator (WT) gave a buy signal at the middle band of the channel. The Squeeze Momentum (SM) indicator’s histogram moved into negative territory. The Kaufman moving average is currently trading below the price at 115,248.
Looking at liquidity data, we see that short-term heavy selling has accumulated en the 117,000-117,800 range, and testing these levels could trigger a $1.59 billion liquidation. The buying level is seen to be gaining weight sequentially en the short term at 113,600 and en the long term at around 112,500 – 113,000, with the liquidation amount being approximately $1.5B.
In summary, the optimistic mood that had been lost en recent times due to fundamental developments regained strength ahead of the upcoming meeting, as US macro data was released and expectations of an interest rate cut became almost certain. Following the favorable conditions provided por the technical outlook, the price completed its consolidation within the horizontal band it had been en for a long time and tested the 116,700 level along with the minor upward channel. An examination of liquidity data reveals that buy and sell positions are balanced, accompanied por high volume. In the coming period, it will be critical for the price to maintain the upward channel it has formed en order for the rise to be sustainable. Closes above the 115,000 level will be monitored as an important reference point for the continuation of the uptrend, and the 117,400 target zone can be tracked if momentum is regained. In the event of potential selling pressure, the 113,500 – 113,000 band will be monitored as the first support and liquidity zone.
Destekler 115,000 – 114,000 – 113,500
Dirençler 116,100 – 117,400 – 119,000
ETH/USDT
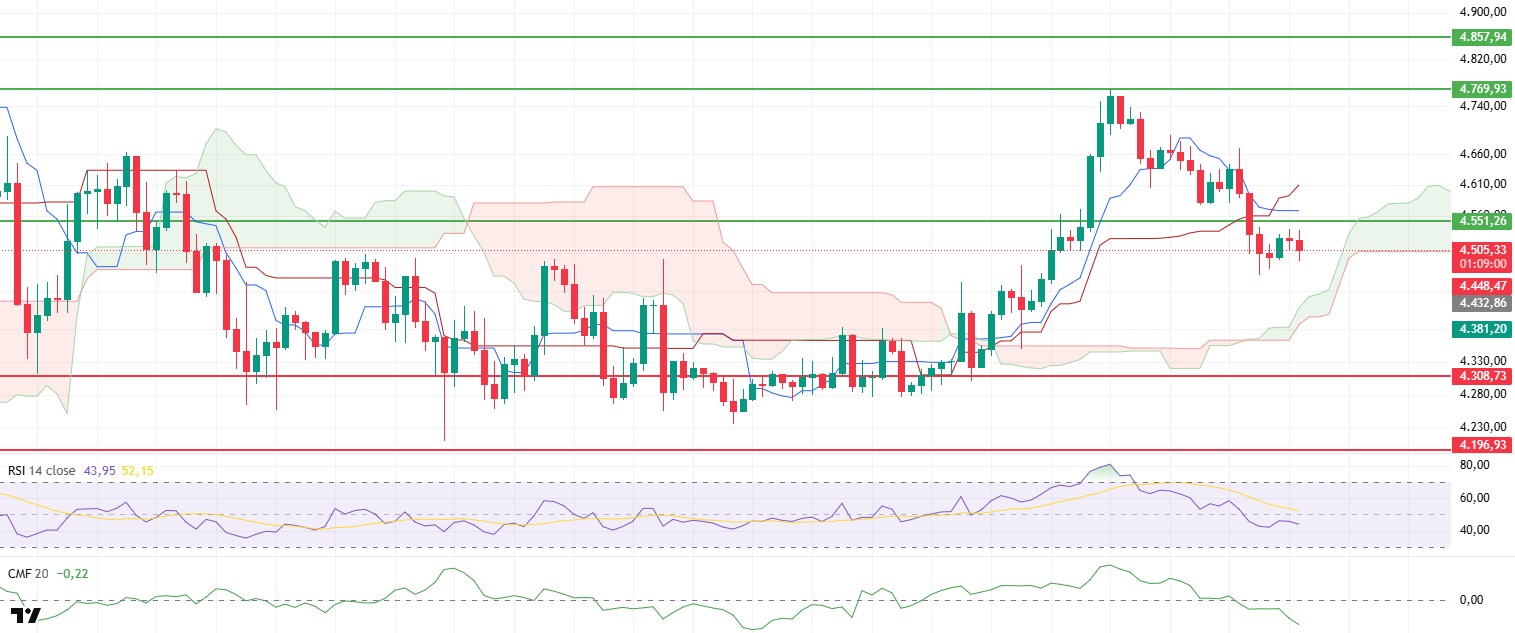
The ETH price caused a significant break en the market yesterday evening por losing its $4,551 support level. With the price falling below this level, selling pressure accelerated and the price retreated to below the $4,500 level. Although a brief recovery attempt was seen en the morning horas, weak buyer interest led to the price retreating back toward the $4,500 region.
The Chaikin Money Flow (CMF) indicator, which stands out el the liquidity side, maintains its downward trend en the negative zone. This indicates that liquidity outflows from the market are accelerating and capital inflows are weakening. The CMF remaining below the zero level stands out as one of the most important factors limiting upward price movements.
On the Ichimoku indicator side, the notable development is the continuation of the sell signal formed por the Tenkan line cutting below the Kijun line. This structure supports the validity of the short-term downtrend scenario. However, the fact that the price is still trading above the kumo cloud continues to give a positive signal en terms of the main trend. In other words, despite short-term pressure, ETH’s overall trend remains positive. Therefore, the downward movements may be more of an interim correction than a trend reversal.
From a technical perspective, $4,551 has now become a critical resistance level. If the price fails to regain this level, selling pressure is expected to intensify. In such a scenario, the $4,500 support level could be tested first, followed por a potential pullback to the $4,450 level as selling accelerates. From a broader perspective, the $4,365 level stands out as a strong key support, and as long as the price does not fall below this area, the main trend is expected to remain positive. On the other hand, if the price regains the $4,551 level and manages to stay above it, market dynamics may change. With buyers regaining strength above this threshold, upward momentum could increase. In such a scenario, the Tenkan line at the $4,635 level will be tested as a critical resistance. Breaking above this level could push the ETH price back towards the weekend high of $4,769.
Top of Form
Below the Form
Support levels: 4.308 – 4.196 – 4.084
Resistance levels: 4,551 – 5,857 – 5,000
XRP/USDT
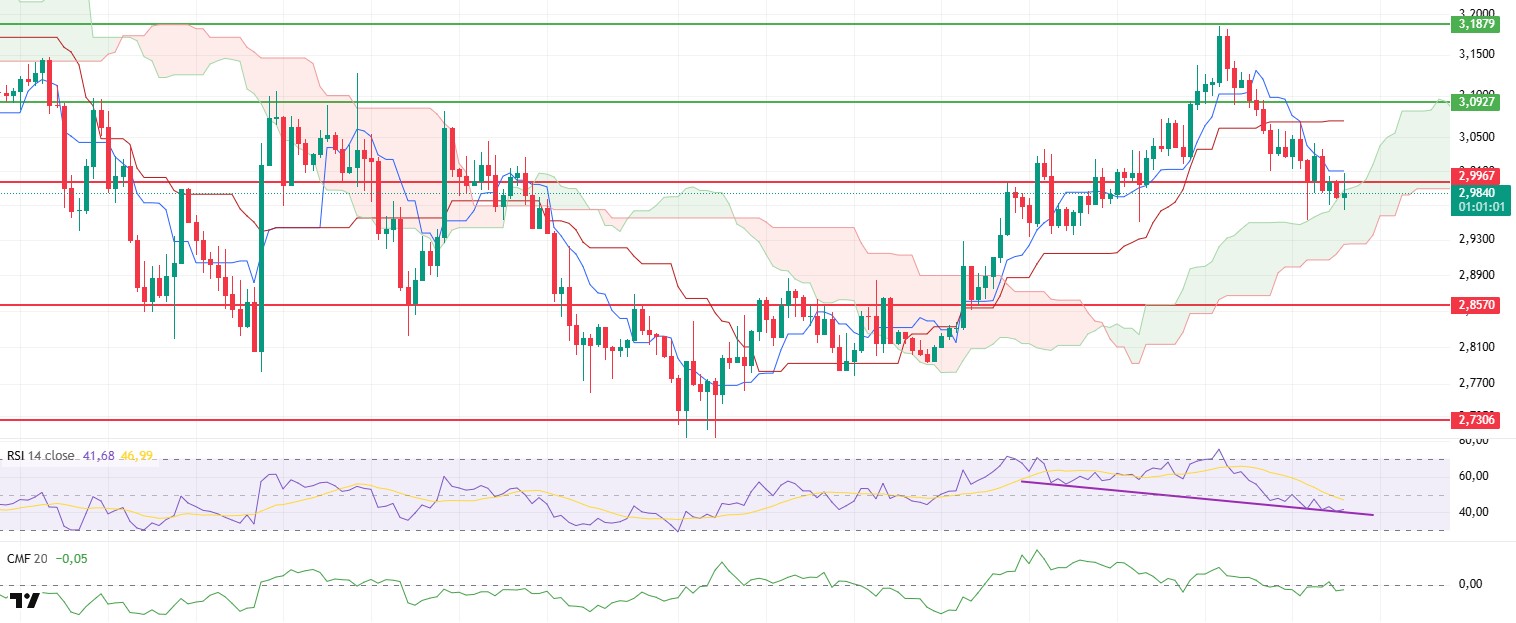
Despite breaking below the $2.99 level, the XRP price did not show a strong decline as expected and is attempting to regain this level. This situation reveals that selling pressure has remained limited and buyers continue to support the price en the short term. The volatility around the $2.99 level, en particular, stands out as a critical threshold that will determine the market’s direction.
The Relative Strength Index (RSI) indicator, despite falling below the 50 level and retreating behind the base line with the recent pullback, is showing signs of recovery. The RSI’s search for upward gaps indicates that momentum could regain strength and that the probability of a price recovery en the short term has increased. This outlook technically supports a potential bullish scenario.
On the liquidity side, the Chaikin Money Flow (CMF) indicator is noteworthy. The CMF indicates that the market is finding equilibrium en terms of inflows and outflows as it attempts to regain the zero line. This structure helps alleviate short-term selling pressure while contributing to a more neutral picture el the liquidity side. If the CMF manages to move into positive territory, it could provide stronger support for the price’s upside potential.
When examining the Ichimoku indicator, the price’s attempt to hold onto the upper band of the kumo cloud stands out. As long as the upper band of the cloud at the $2.98 level can be maintained, upward movement appears likely to continue. However, any closes below this level could produce a short-term signal of weakness, leading to increased selling pressure.
In the overall outlook, the $2.99 level is a critical resistance point. If this level is regained, the price is expected to gain upward momentum and move towards the $3.09 level. On the other hand, closing below the $2.98–$2.90 range could cause the market to weaken and short-term declines to deepen.
Support levels: 2.8570 – 2.7306 – 2.6513
Resistance levels: 2.9967 – 3.0927 – 3.3058
SOL/USDT
Helius Pantera Capital and Summer Capital have raised over $500 million to launch SOL Treasury Company.
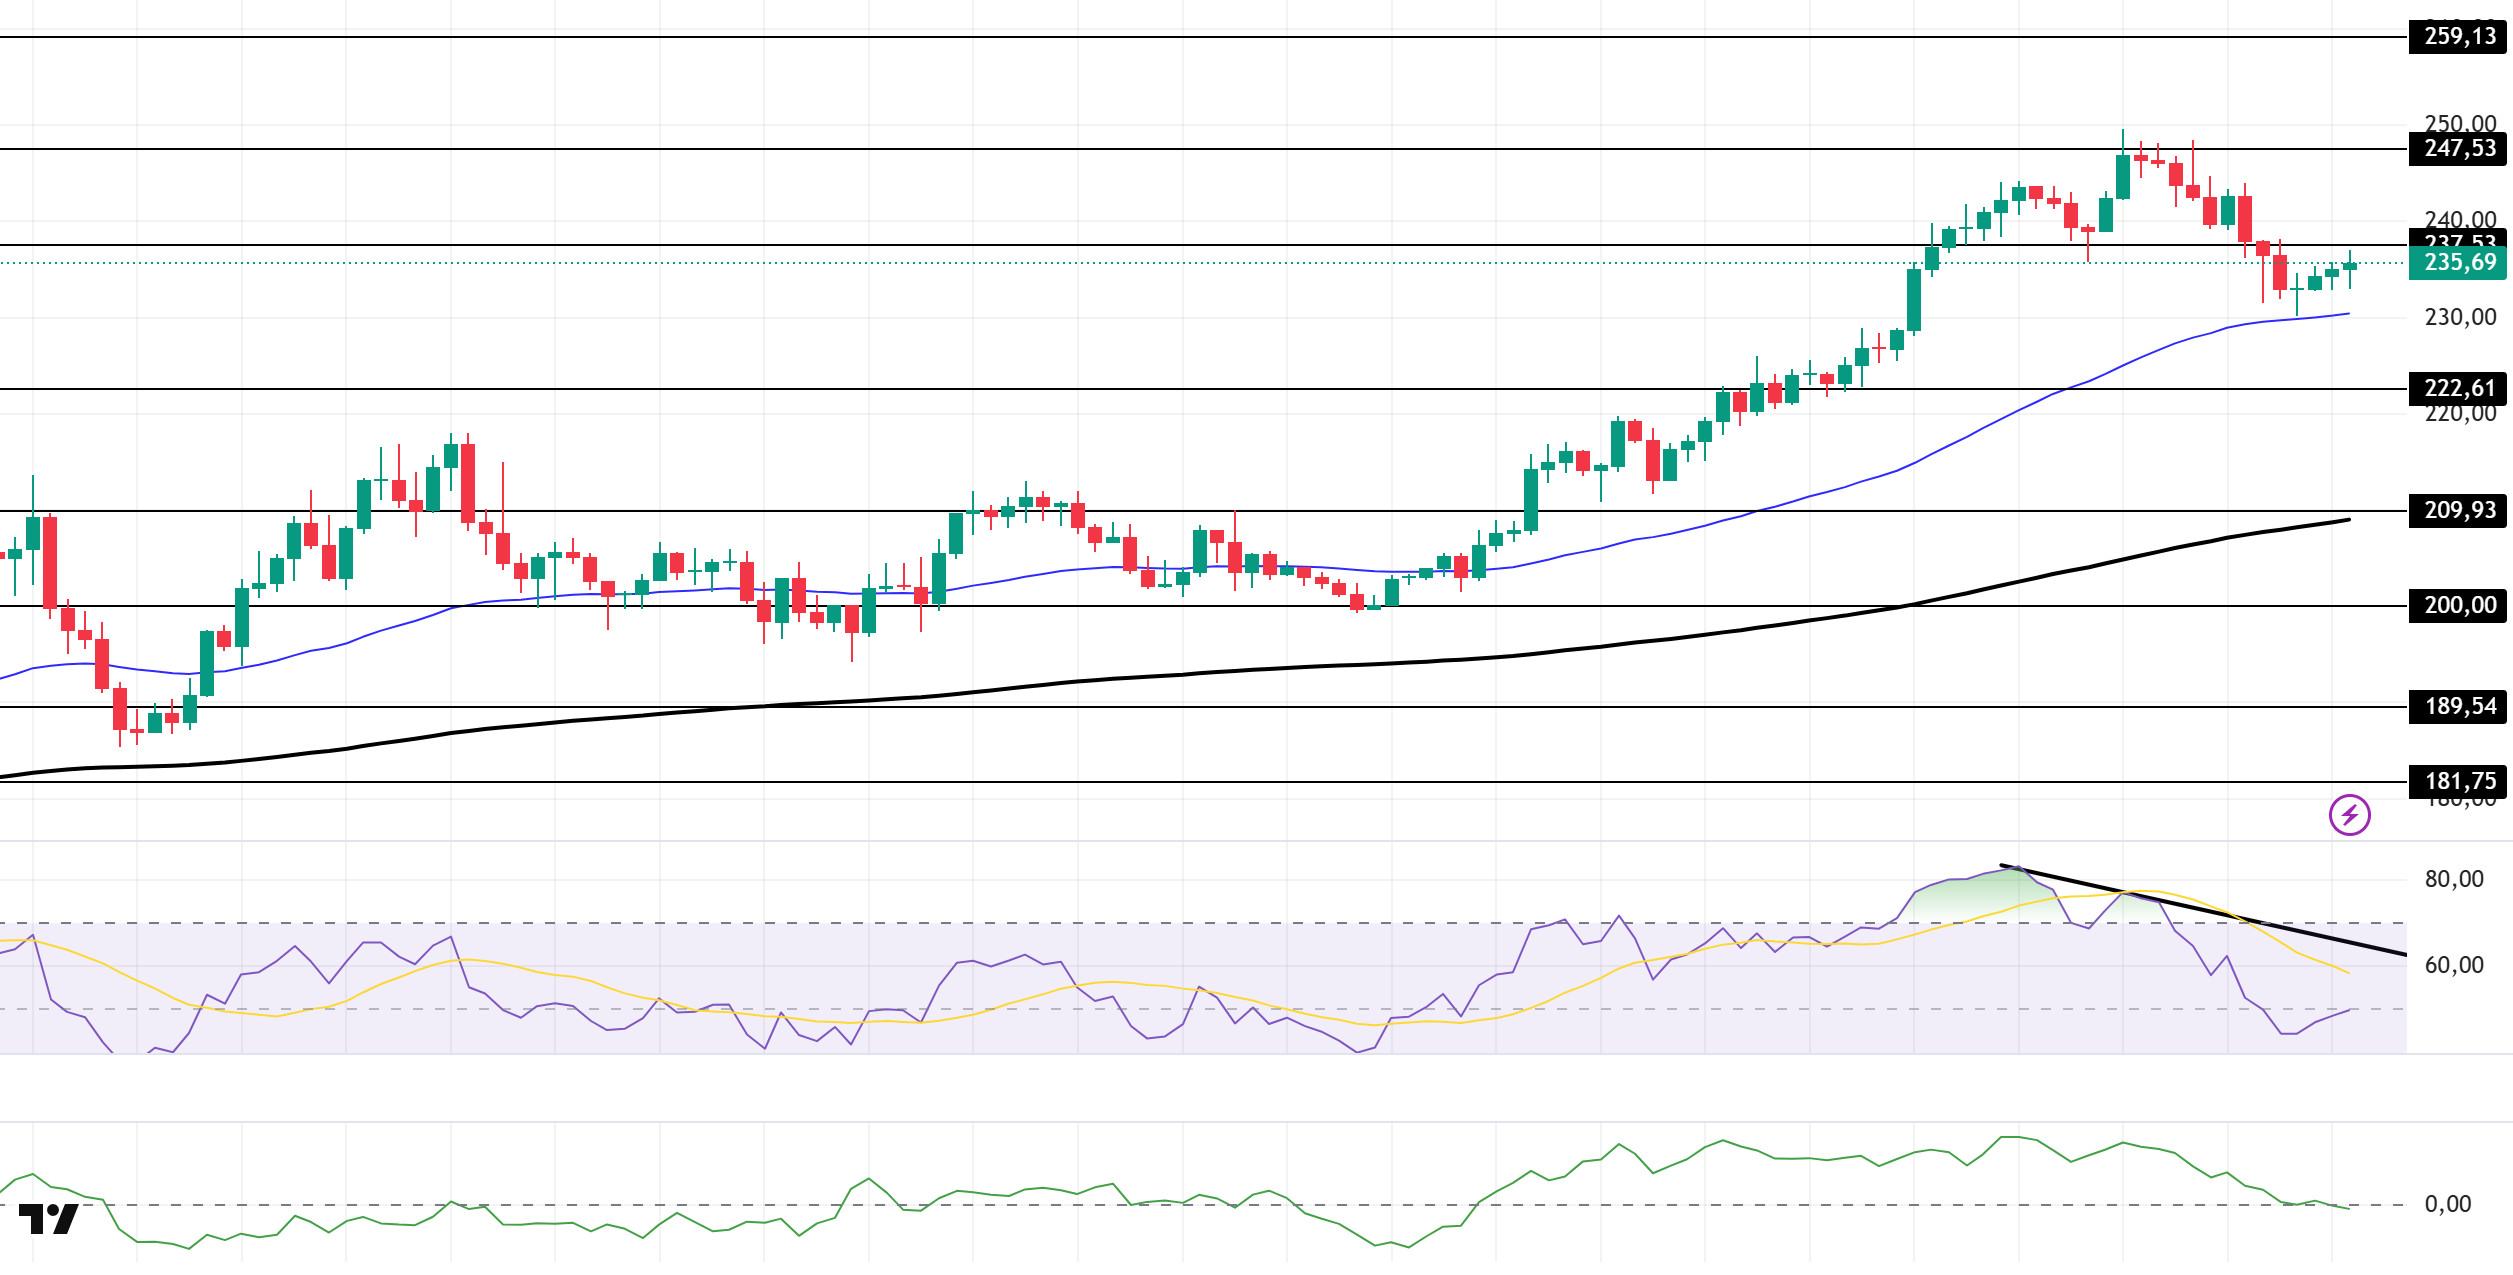
SOL price showed a slight decline. The asset tested the strong resistance level of $247.53 but failed to break through, experiencing a pullback. It then found support at the 50 EMA (Exponential Moving Average – Blue Line) and showed a slight increase. Currently testing the $237.53 level, the price could test the $247.53 level if it closes above this level. In pullbacks, the $222.61 level can be monitored.
On the 4-hora chart, it continued to remain above the 50 EMA (Exponential Moving Average – Blue Line) and the 200 EMA (Black Line). This indicates that the upward trend may continue en the medium term. At the same time, the price being above both moving averages shows us that the market is trending upward en the short term. A large difference between the two moving averages indicates that the asset may be en a sideways or downward trend. Chaikin Money Flow (CMF-20) has retreated to a neutral level. However, a decrease en cash inflows could push the CMF into negative territory. The Relative Strength Index (RSI-14) rose from the negative zone to the positive zone and its position en the lower zone of the downward trend that began el September 12 indicated increased selling pressure. If there is an upturn due to macroeconomic data or positive news related to the Solana ecosystem, the $247.53 level stands out as a strong resistance point. If this level is broken upwards, the uptrend is expected to continue. In the event of pullbacks due to adverse developments or profit-taking, the $222.61 level could be tested. A retreat to these support levels could increase buying momentum, presenting a potential opportunity for an upward move.
Supporters 222.61 – 209.93 – 200.00
Resistors 237.53 – 247.53 – 259.13
DOGE/USDT
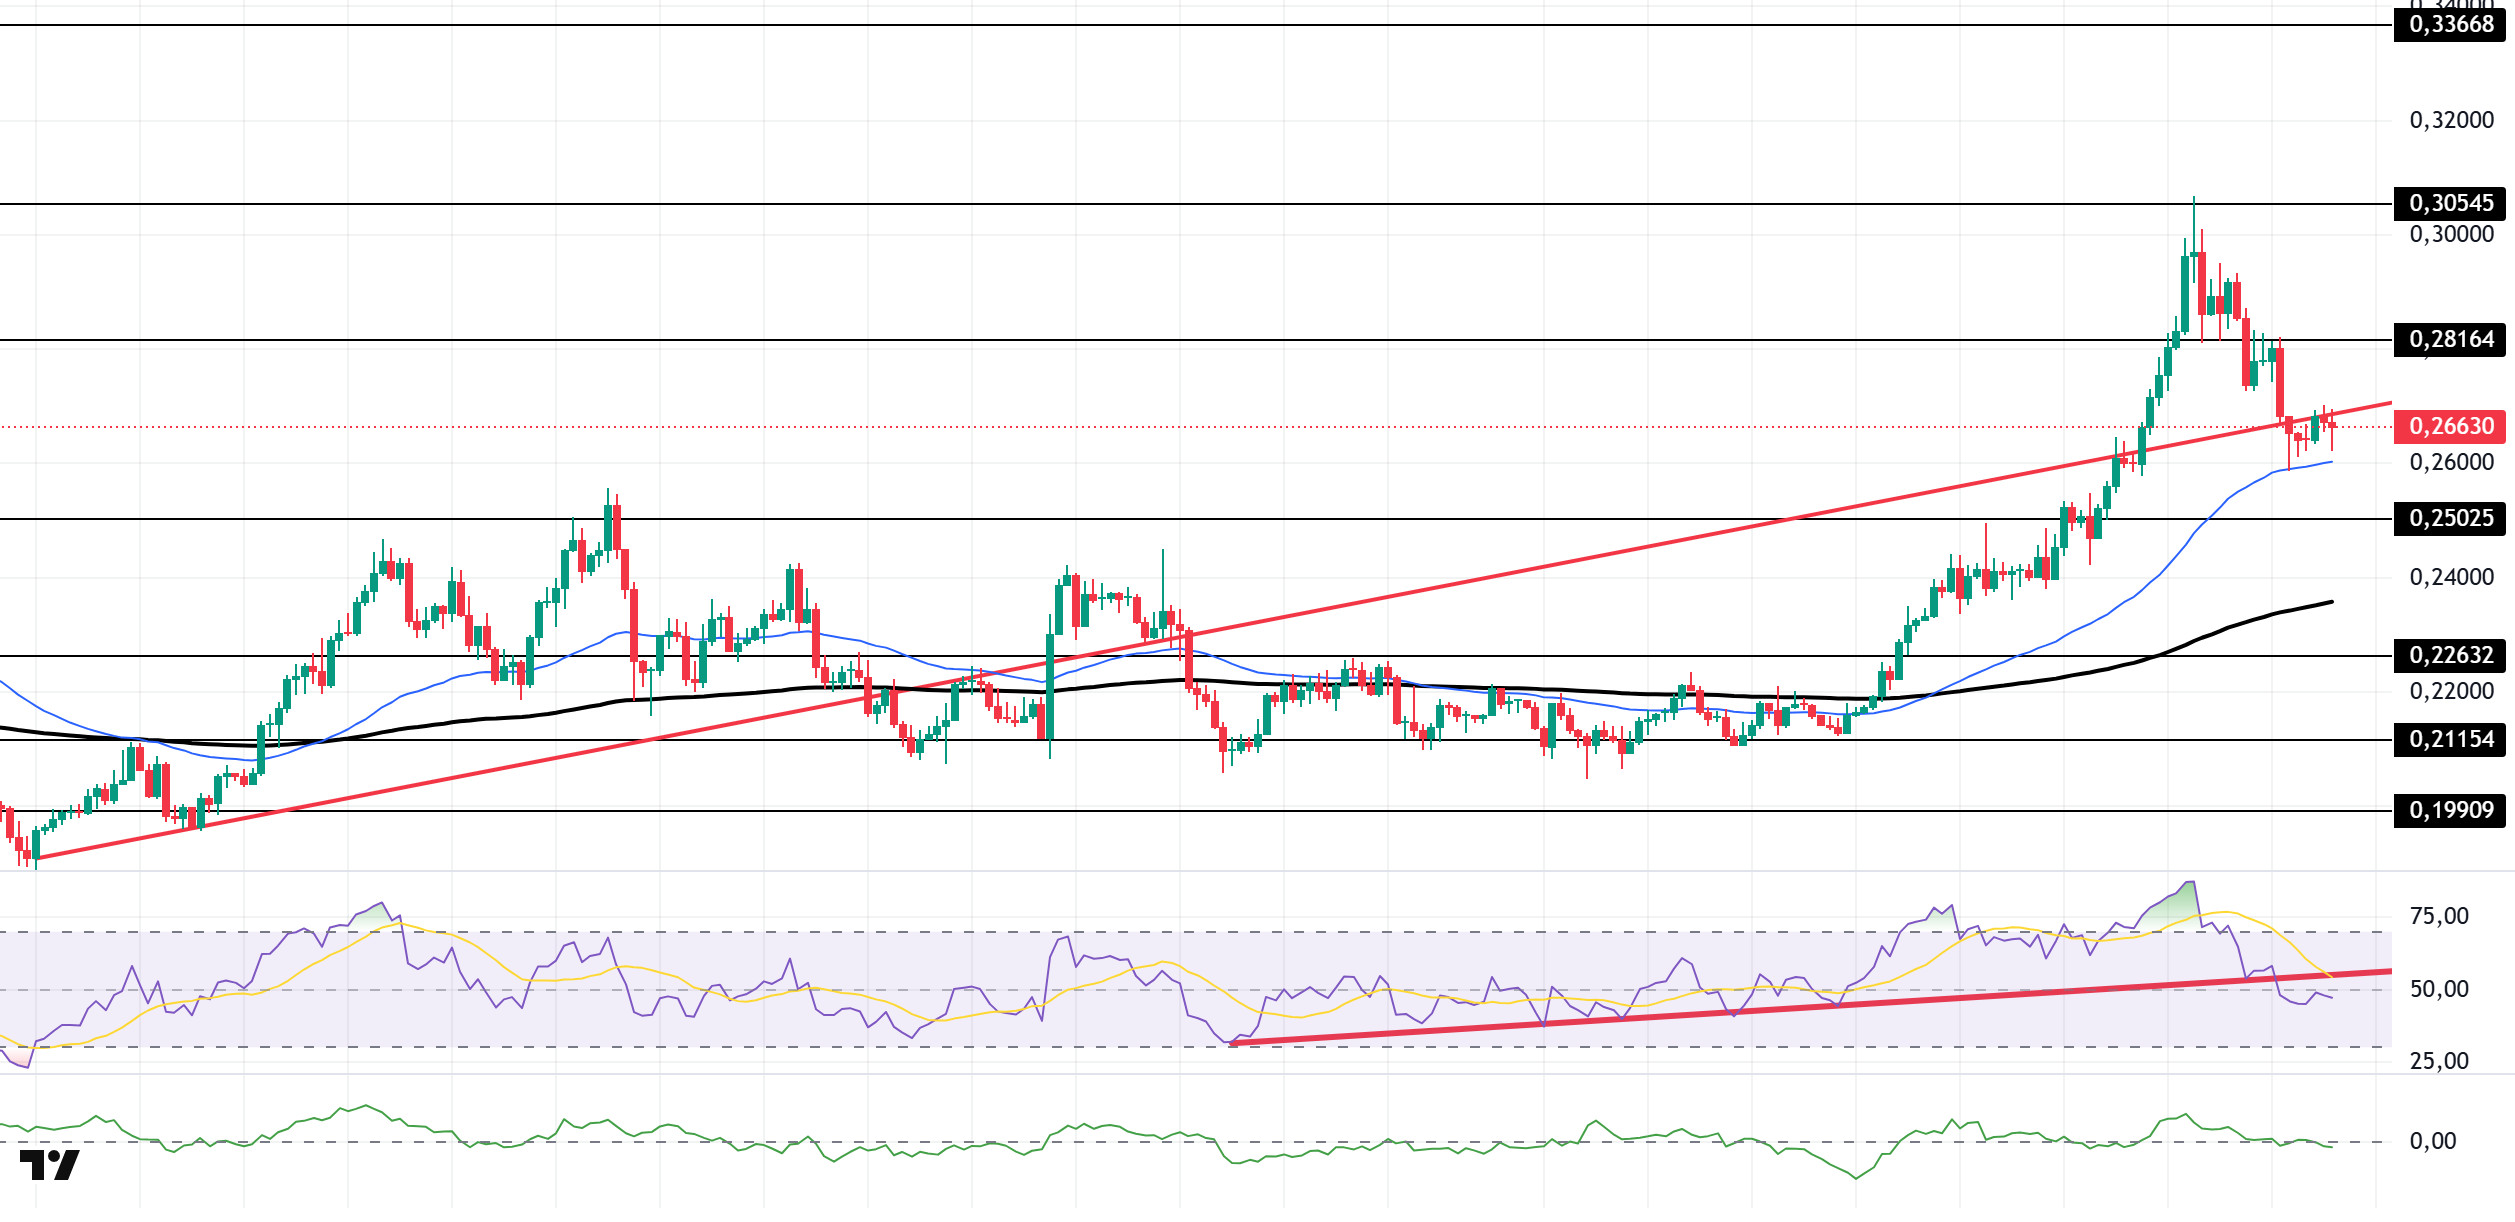
The DOGE price traded sideways. The asset tested the upward trend line that began el August 3 as support and broke below it, deepening its pullback. The price tested the 50 EMA (Exponential Moving Average – Blue Line) moving average as support, rose from there, and is currently testing the upward trend as resistance. It may test the $0.25025 level el candlestick closes below the 50 EMA. If it rises, the $0.28164 level may act as resistance.
On the 4-hora chart, the 50 EMA (Blue Line) continued to remain above the 200 EMA (Black Line). This indicates that the medium-term upward trend is continuing. The price remaining above both moving averages shows that the short-term upward trend is strong. A large difference between the two moving averages may cause the asset to pull back or move sideways. Chaikin Money Flow (CMF-20) also remained at a neutral level. Additionally, a decrease en money inflows could push the CMF into negative territory. The Relative Strength Index (RSI-14) rose from the negative zone to the neutral level. However, it remained en the lower region of the upward trend that began el August 26. This indicated that selling pressure continued. In the event of an upward movement driven por political developments, macroeconomic data, or positive news flow en the DOGE ecosystem, the $0.28164 level stands out as a strong resistance zone. Conversely, en the event of negative news flow, the $0.25025 level could be triggered. A decline to these levels could increase momentum and potentially initiate a new upward wave.
Supporters 0.25025 – 0.22632 – 0.21154
Resistors 0.28164 – 0.30545 – 0.33668
BNB/USDT
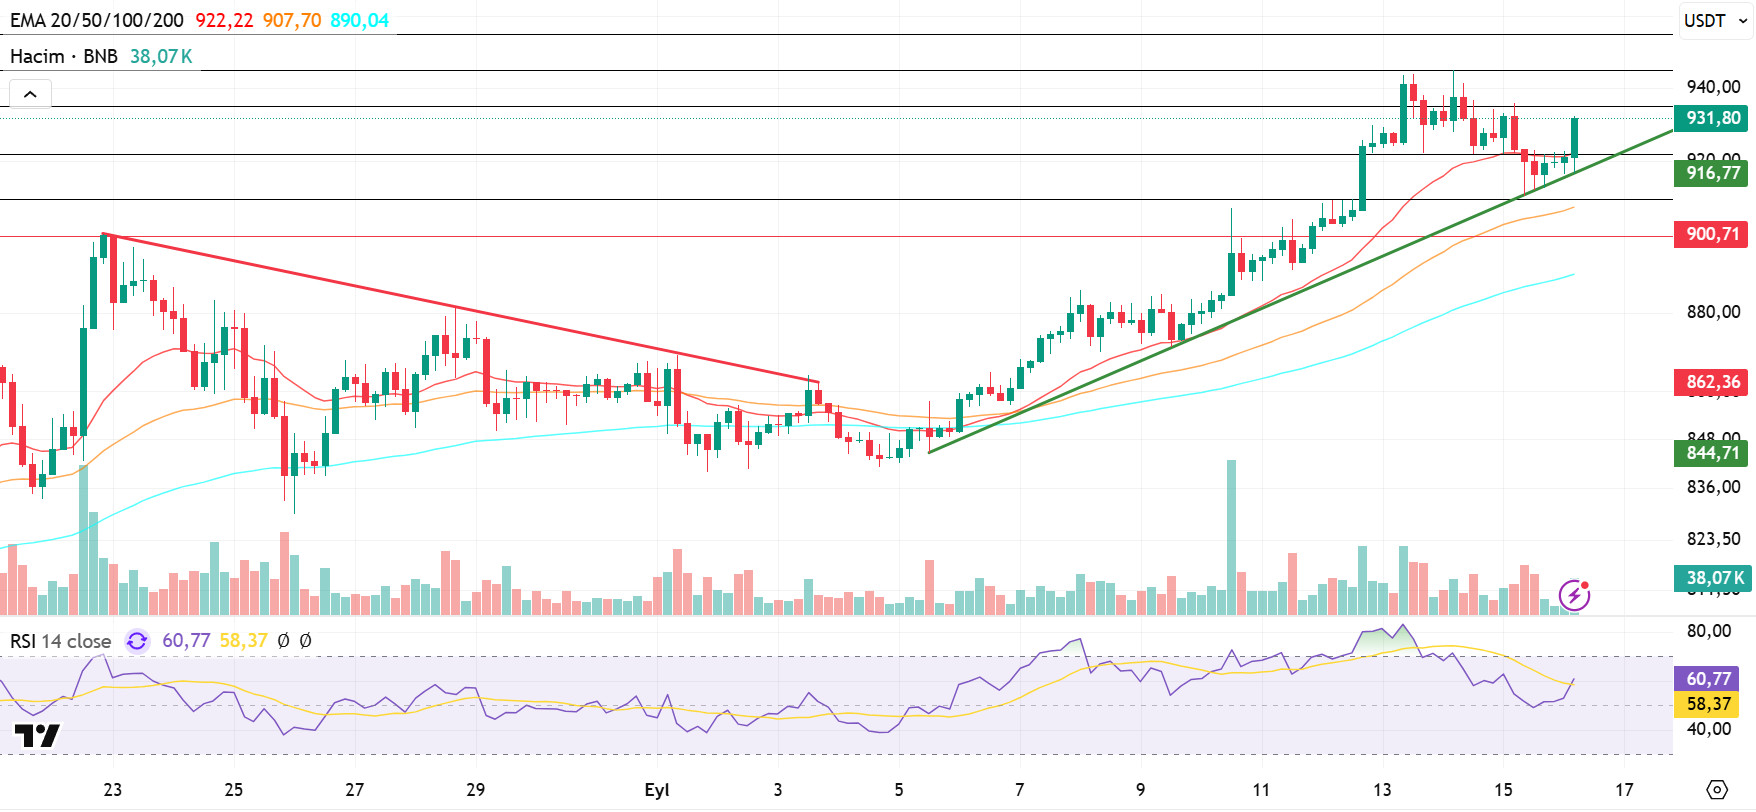
From a technical perspective, BNB/USDT, which ended its correction movement starting from the previous peak level of $900 at the $840 level, has re-entered an upward trend with strong support from this region and has recorded new historical highs. In this context, BNB, which approached the $950 level, retreated due to selling pressure from that level.
Following the pullback, the price experienced a correction down to the $910 level, after which it confirmed its trend with support from the uptrend zone. In this context, a strong buying appetite has been observed since the opening of the new candle.
Technical indicators for BNB/USDT, currently trading en the $920–$935 range, suggest that recent changes en trading volume indicate the asset has entered a short-term decision phase. Additionally, the Relative Strength Index (RSI) rose above the 70 level following recent increases, but encountered resistance at this level and retreated to the 50 level. Subsequently, with incoming purchases, the RSI rose again to the 60 level.
According to the current technical chart, if buying appetite is maintained, BNB is expected to test the $935 resistance level en the first stage. If this level is exceeded, the price may move towards the $945 and $955 levels. On the other hand, if selling pressure increases, the price is likely to fall back to the $920 support level. If this level is broken downwards, the price is expected to retreat to the $910 and $900 levels.
Supports: 920 – 910 – 900
Resistors: 935 – 945 – 955
ADA/USDT
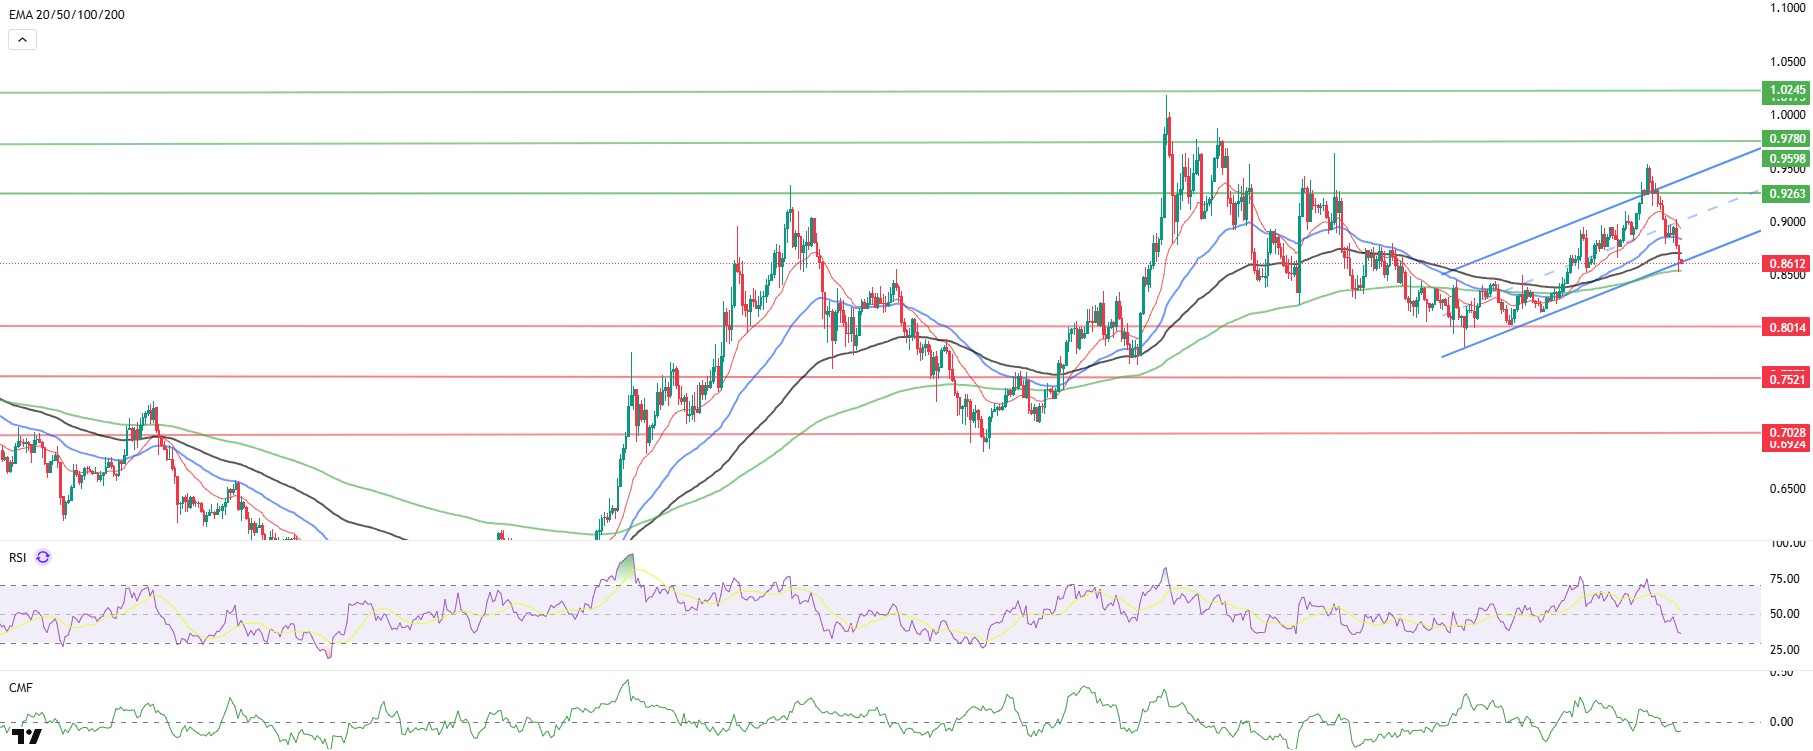
ADA’s value loss seen yesterday continues today. Starting today at $0.8550, ADA is trading at $0.8600 after experiencing an approximate 1.5% loss en value. ADA tested the $0.8500 support level during its decline and broke below this level. The gradual rise seen last week gave way to a decline el the first day of the new week. Thus, it lost its upward momentum, broke out of the rising channel trend, and shifted to a downward movement.
Technically speaking, el the 4-hora chart, if the ADA price closes above $0.8900, it could first target $0.9500, and if momentum continues, the $1.0245 level could be our first resistance level within the wide range. It is particularly important for the price to close above the 20-day Exponential Moving Average (EMA 20 – Red Line) and (EMA 50 – Blue Line) for the uptrend to continue. The price continues below the 20-day moving averages, confirming that selling pressure is dominant en the short term. The Relative Strength Index (RSI) continues to decline, falling to 38 levels, while the Chaikin Money Flow (CMF-20) has fallen to -0.13 levels, indicating potential for a sell-off. The decrease en cash inflows may keep the CMF en negative territory, and the negative signals from both indicators could herald a selling effect. Depending el the macroeconomic data to be announced this week or positive news regarding the Cardano ecosystem, the $0.9500 level may emerge as our strong resistance point. If the decline begins, the $0.8075 level will be the key support level we monitor.
Supports 0.8075 – 0.7380 – 0.7170
Resistances 1.1943 – 1.0245 – 0.9500
Legal Notice
The investment information, comments, and recommendations contained herein do not constitute investment advice. Investment advisory services are provided individually por authorized institutions taking into account the risk and return preferences of individuals. The comments and recommendations contained herein are of a general nature. These recommendations may not be suitable for your financial situation and risk and return preferences. Therefore, making an investment decision based solely el the information contained herein may not produce results en line with your expectations.