
Technical Analysis
BTC/USDT
The Trump administration’s shaping of the Fed chairmanship process through Treasury Secretary Scott Bessent signals that Fed-Treasury relations could move to a more coordinated footing en the coming period, while interest rate policy and balance sheet tools are once again up for debate. On the crypto side, Bitcoin’s use cases, the protocol’s immutability, and market dynamics are coming to the fore, while increased volatility and liquidity conditions en the options market are among the main factors determining investors’ risk perception.
From a technical perspective, BTC recorded a limited upward reaction during the day while continuing to follow the downward trend channel. The price, squeezed between the channel midline and KAMA, shows an indecisive structure en determining direction, and a breakout within the 87,000–88,000 band could be determined por passing these levels. However, as we mentioned earlier, as we approach the end of the year, BTC is attempting to close the year negatively, and a clear breakout is only possible with closes above the 90,000 reference level.
Technical indicators show that the Wave Trend (WT) oscillator ended its sell signal en the overbought zone at the channel’s middle band and has now switched to a buy signal. The histogram el the Squeeze Momentum (SM) indicator is attempting to regain momentum en negative territory. The Kaufman Moving Average (KAMA) is currently trading just above the price level at $88.033.
When examining liquidation data, an increase en volume was observed en the buy-sell tiers for BTC. Although fragmented buy tiers formed at the 84,000 and then 86,000 levels, the 86,000 tier was liquidated with the recent decline. In contrast, the sell levels recorded accumulation en the short term at 88,000–89,000, while intense accumulation continues above the 91,000 level en the broader time frame.
In summary, concrete steps taken between the US and China indicate that tariff tensions have eased en the short term. BoJ Governor Ueda, meanwhile, has raised the possibility of another interest rate hike. As we approach the end of the year, the Christmas lull continues to be noticeable en the markets. Technically, BTC continues to trade within indecisive structures, with no clear upward movement yet emerging.An examination of liquidity data reveals that areas with concentrated short-term trading are being targeted, while long-term selling levels have not yet been tested. After this stage, the 89,000 level will be monitored as a critical point where the major uptrend passes through for the price to regain momentum. Closes and price action above this level are important indicators for regaining momentum. If selling pressure deepens, 86,000 emerges as a short-term liquidity area, while the 85,000 level is an important reference point.
Supports: 86,300 – 85,000 – 84,400
Resistances: 88,000 – 89,000 – 90,000

ETH/USDT
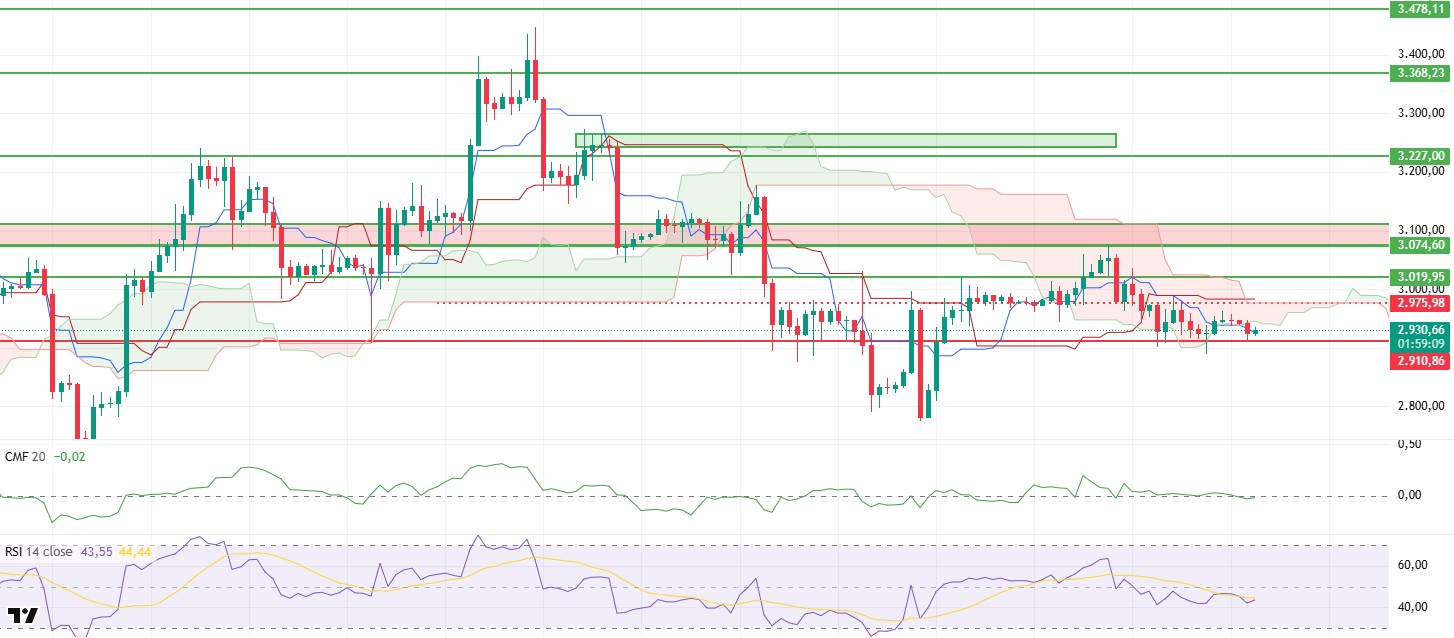
The ETH price retreated back to the $2,910 level during the day, but buyers stepped back en as selling did not deepen en this region. With buying from the support zone, the price recovered above the $2,930 level. This intraday movement shows that the $2,910 area is still functioning as a strong defense zone and that sellers have been unable to maintain sustainability below this level.
There was no significant change en liquidity throughout the day. Chaikin Money Flow (CMF) maintained its horizontal course around the zero line. This outlook indicates that there has been no new liquidity inflow into the market, but also that there has been no significant outflow. This stagnant structure el the liquidity side continues to limit the price from producing sharp movements.
The picture is similarly calm el the momentum front. The Relative Strength Index (RSI) continues its horizontal movement, remaining below the 50 level. The RSI’s position indicates that buyers have not yet gained momentum and that the upward momentum remains weak. Without stronger momentum, sustained upward moves appear unlikely.
From the Ichimoku indicator perspective, pricing is balanced but continues en a fragile zone. The price has lost the lower band of the kumo cloud and is holding at the tenkan level. Whether it can re-enter the kumo cloud will be critical.
The overall outlook remains unchanged. The $2,910 level continues to be monitored as critical support for downward movements. If prices remain below this level, selling pressure may increase again. On the upside, breaking above the $3,020 level could break the current tight range and pave the way for a clearer upward movement. Intraday price behavior indicates that a cautious but not entirely negative outlook is maintained el the ETH side.
Supports: 2,910 – 2,727 – 2,625
Resistances: 3,019 – 3,074 – 3,227
XRP/USDT
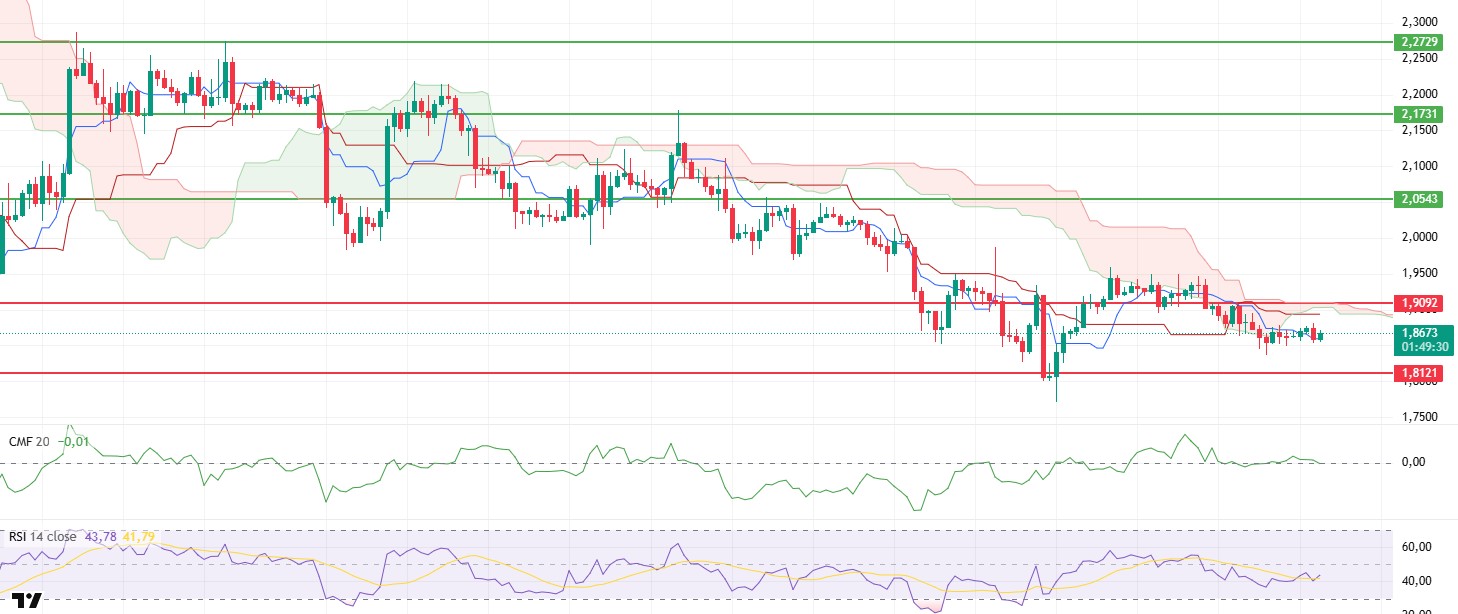
The XRP price moved within a horizontal band without generating significant momentum during the day and was priced around $1.87. The low volume indicates that neither buyers nor sellers want to push the market. The upward demand seen en the morning horas did not spread throughout the day, signaling that the price is likely to remain en a holding pattern en the short term.
The liquidity picture remains largely unchanged. While the Chaikin Money Flow (CMF) remains en positive territory, it failed to gain any meaningful momentum throughout the day. This structure indicates that the money entering the market has not completely exited, but it is not strong enough to create a new wave of buying. This stagnation el the liquidity side stands out as one of the main reasons for the price remaining within a narrow range.
There is similar calm el the momentum front. The Relative Strength Index (RSI) continues its horizontal movement and is not producing any clear signals of strengthening or weakening. This appearance of the RSI suggests that limited fluctuations are more likely than sudden directional changes en the short term.
The technical outlook is largely the same as this morning’s setup from the Ichimoku indicator perspective. The price continues to stay above the Tenkan level, maintaining its short-term consolidation bias. However, the Kijun line and Kumo cloud are still positioned above. This positioning indicates that upward momentum is increasing, but it is still too early to say that the trend has clearly turned positive.
The overall picture for XRP shows a balanced but cautious outlook. The $1.90 level remains the key threshold for the upward movement to gain momentum. As long as this level is not breached, the price is likely to follow a horizontal and controlled trajectory. On the downside, the $1.81 level continues to be a critical support. The current structure indicates that a patient wait prevails en the market rather than a hasty change en direction.
Supports: 1.8121 – 1.6224 – 1.5146
Resistances: 1.9092 – 2.0543 – 2.1731
SOL/USDT
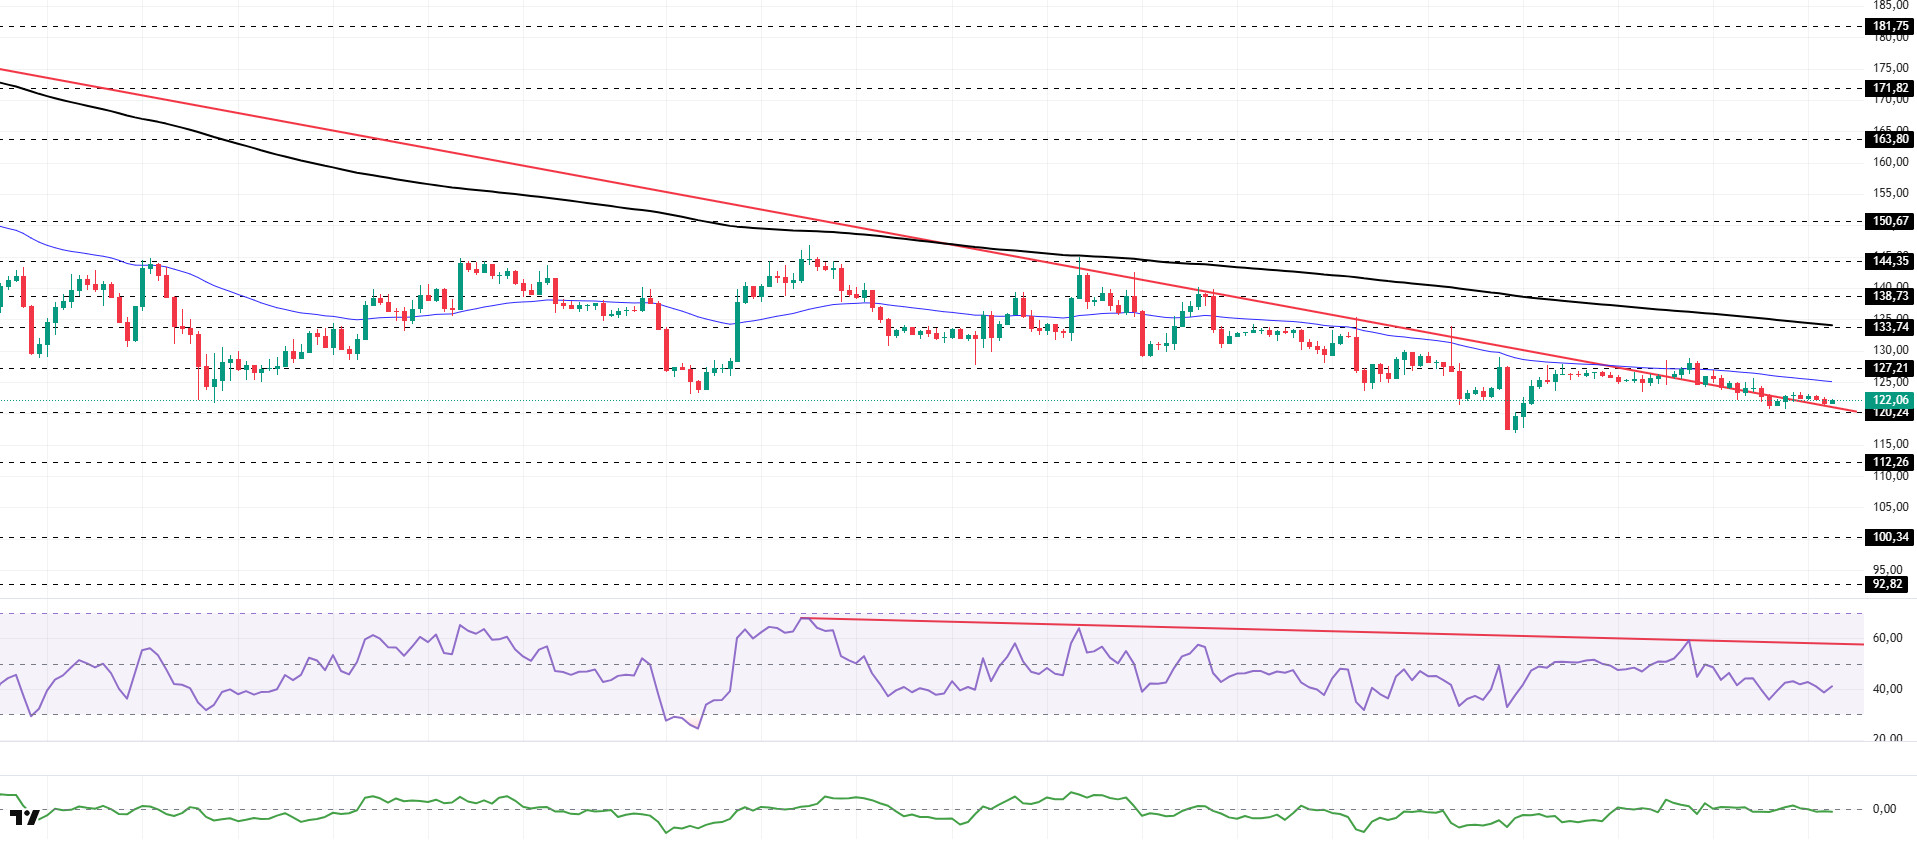
The SOL price remained flat during the day. The asset continued to trade en the upper region of the downtrend that began el October 8. The price, which found resistance at the 50 EMA (Blue Line) moving average, is currently testing the downtrend as support. If an uptrend begins, it may test the 50 EMA moving average as resistance. In the event of a pullback, the $120.24 level could act as support.
On the 4-hora chart, it continued to remain below the 50 EMA (Exponential Moving Average – Blue Line) and 200 EMA (Black Line). This indicates that the downtrend continues en the medium term. At the same time, the price being below both moving averages indicates that the asset is trending downward en the short term. The Chaikin Money Flow (CMF-20) remained at a neutral level. However, the balance of money inflows and outflows may keep the CMF at a neutral level. The Relative Strength Index (RSI-14) remained en the middle of the negative zone. This signaled that selling pressure continued. If there is an upturn due to macroeconomic data or positive news related to the Solana ecosystem, the $133.74 level stands out as a strong resistance point. If this level is broken upwards, the uptrend is expected to continue. In the event of pullbacks due to developments en the opposite direction or profit-taking, the $112.26 level could be tested. A decline to these support levels could increase buying momentum, presenting a potential upside opportunity.
Supports: 120.24 – 112.26 – 100.34
Resistances: 127.21 – 133.74 – 138.73
DOGE/USDT
The DOGE price experienced a slight decline during the day. The asset remained below the 50 EMA (Blue Line) moving average, signaling that the pullback pressure continues. Unable to break through the strong resistance level of $0.13367, the price retreated and has now moved below the $0.12824 level, deepening its decline. If the pullback continues, the $0.12282 level should be monitored. If it experiences an uptrend, the 50 EMA moving average could act as resistance.
On the 4-hora chart, the 50 EMA (Exponential Moving Average – Blue Line) remained below the 200 EMA (Black Line). This indicates that the downtrend may continue en the medium term. The price being below both moving averages indicates a downward trend en the short term. The Chaikin Money Flow (CMF-20) remained en negative territory. Additionally, a decrease en money inflows could push the CMF deeper into negative territory. The Relative Strength Index (RSI-14) also remained en negative territory. At the same time, it continued to stay below the downward trend line that began el December 9. This signaled increased selling pressure. On the other hand, the positive divergence remains valid. In the event of a rise due to political developments, macroeconomic data, or positive news flow en the DOGE ecosystem, the $0.14237 level stands out as a strong resistance zone. Conversely, en the event of negative news flow, the $0.12282 level could be triggered. A decline to these levels could increase momentum and start a new wave of growth.
Supports: $0.12282 – $0.11797 – $0.10837
Resistances: 0.12824 – 0.13367 – 0.14237

BNB/USDT
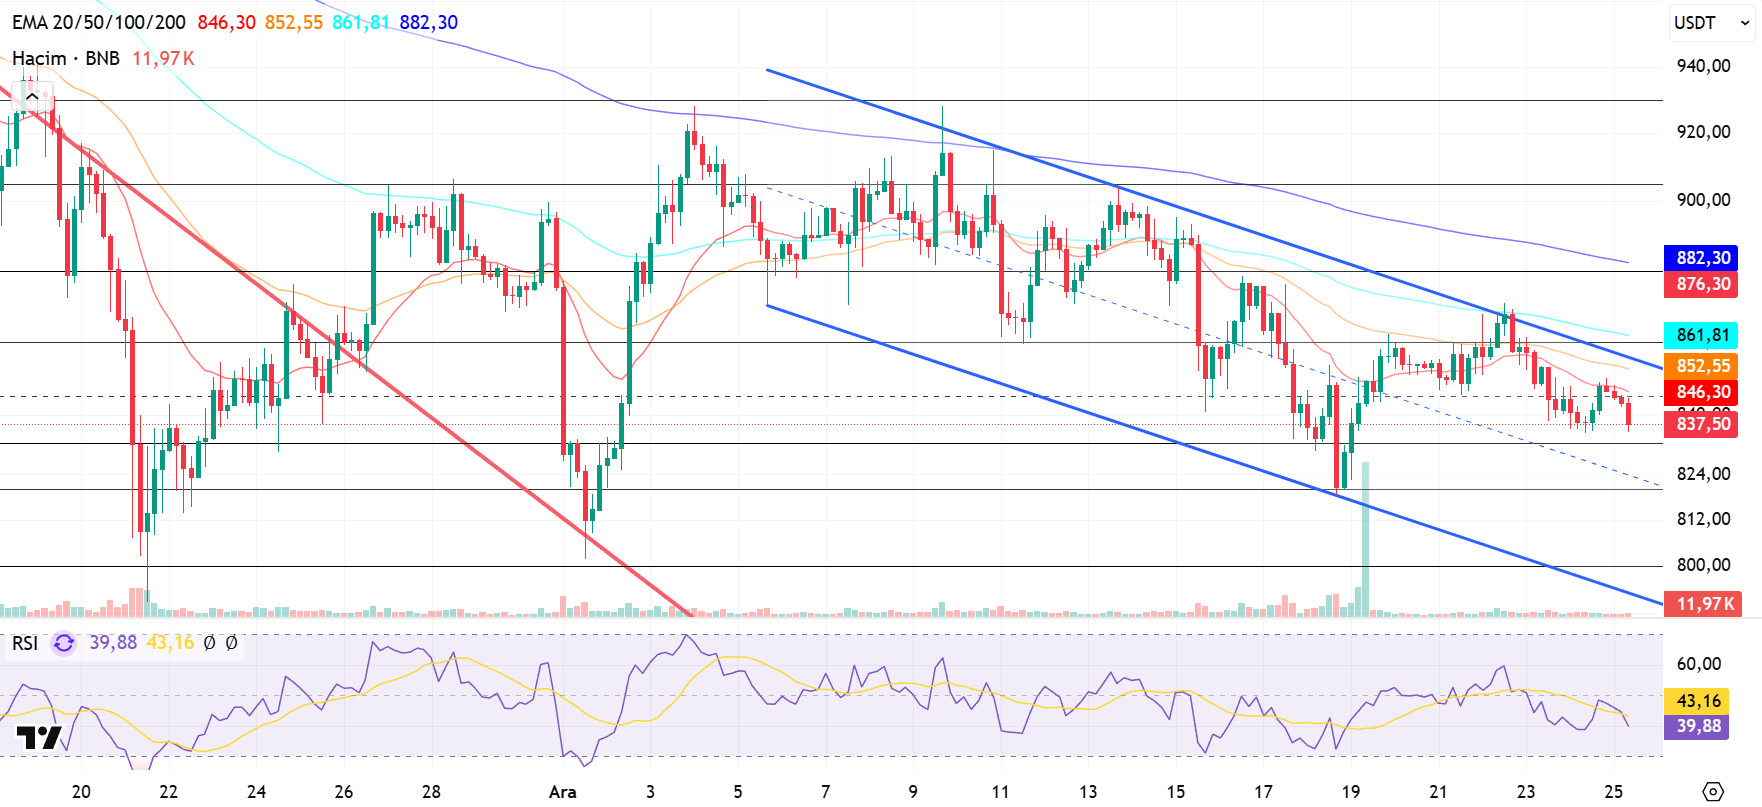
From a technical perspective, the BNB/USDT pair, which has been searching for support for some time, has ended its downward momentum with the candlestick formations that have formed and has turned its direction back upwards. With this recovery process, BNB has risen to the $930 level por testing the downward trend upwards with the support provided por the new candlesticks. While selling pressure has increased en this region depending el market conditions, the asset appears to be continuing its movement within a declining channel for some time.
Overall, the BNB/USDT pair presents a flat positive picture. In this context, the price fluctuating within a flat band indicates that the search for direction continues en the medium term. If upward price movements gain strength, the positive outlook is expected to be supported.
Currently trading en the $830–860 range, technical indicators for BNB reveal that low trading volume is limiting the upward momentum. Additionally, the RSI indicator is seen hovering at relatively low levels due to weak momentum.
Within the technical outlook, if selling pressure increases, the price is expected to retest the $830 support level. If this level is broken downward, a pullback towards the $820 and $800 support zones will likely occur.
On the other hand, if buying appetite is maintained and market momentum strengthens, BNB is expected to retest the $860 resistance level en the first stage. Breaking above this level could potentially lead to a move above the downtrend line. If the trend breakout is confirmed and the price manages to hold above this level, a rise towards the $880 and $905 levels appears technically feasible.
Supports: 830 – 820 – 800
Resistances: 860 – 880 – 905
LTC/USDT
Litecoin (LTC) / USDT pair price movements continued with a 0.38% increase en value during the day. In the same time frame, LTC recorded a 0.58% increase en value compared to Bitcoin, indicating that Litecoin has recovered slightly against Bitcoin en addition to general market movements. On the futures front, the decline en the long/short position ratio to 0.9569 over the last 24 horas indicates that bearish expectations prevail among derivatives market participants.
A technical analysis of Litecoin’s 4-hora USDT pair shows that the price is trading below the 200, 100, and 50-period moving averages (purple, yellow, and orange lines, respectively). This outlook is consistent with the increase en short positions relative to long positions en the derivatives markets, confirming that the main trend still appears to be downward.
However, the current structure also holds the potential to shift to a neutral outlook and evolve into a positive one. In this scenario, the first strong resistance level that the uptrend may encounter is expected to be the 50-period moving average at the 76.70 level and the descending trend line it intersects. Breaking through this important resistance level would be the first critical step towards neutralizing the negative outlook. If this level is broken, 78.37 would come into focus as another important intraday falling trend resistance level to watch. If the rise gains momentum and heads towards the 79.08 level, it is likely that the movement will remain limited, as seen en previous attempts, due to the effect of the 100-period moving average.
If the decline continues, the first important support level is monitored at 75.00. The possibility of this region also being a retest area provides a stronger structure en terms of support. However, if a downward breakout occurs, selling pressure is expected to increase, bringing the support levels of 73.54 and 72.01 into focus. The 74.54 level, en particular, holds strong reaction potential as it is located en the middle of the channel structure.
Supports: 75.00 – 73.54 – 72.01
Resistances: 76.70 – 78.37 – 79.08

Legal Notice
The investment information, comments, and recommendations contained herein do not constitute investment advice. Investment advisory services are provided individually por authorized institutions taking into account the risk and return preferences of individuals. The comments and recommendations contained herein are of a general nature. These recommendations may not be suitable for your financial situation and risk and return preferences. Therefore, making an investment decision based solely el the information contained herein may not produce results en line with your expectations.

