
Technical Analysis – September 29, 2025 – Evening
BTC/USDT
Fed member Harker stated that he expects inflation to fall to 2% en 2027 and that he sees signs of fragility en the labor market. Waller stated that stablecoins should be included en regulatory oversight. The US SEC will make a final decision en October el 16 crypto ETF applications covering assets such as Solana, XRP, Litecoin, and Dogecoin. Over the past 30 days, approximately 170,000 BTC net outflow from centralized exchanges was recorded, indicating that assets were directed to custodial wallets.
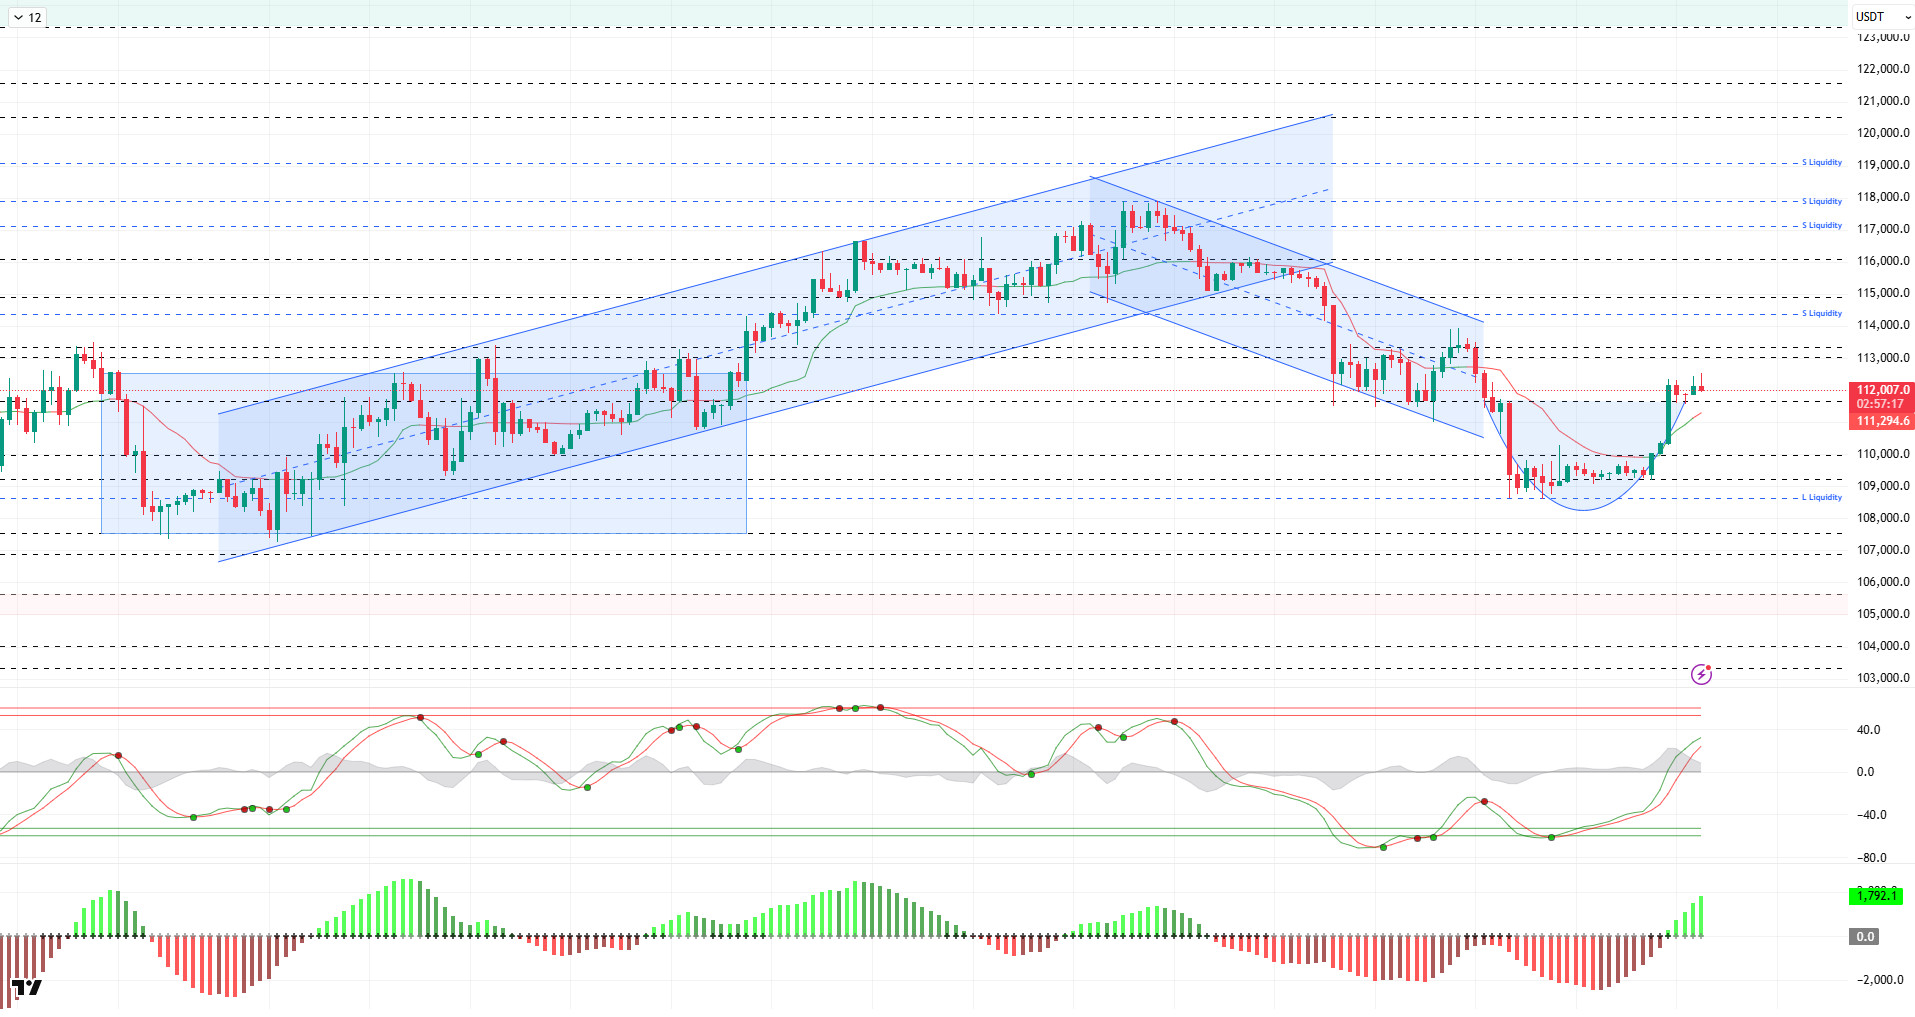
Looking at the technical picture, BTC managed to stay above the 109,000 level despite testing it several times over the weekend. Then, with the momentum it gained, the price surpassed the 110,000 level and reached 112,300. With the cup formation seen en its price, the price continues to trade at the 112,100 level.
Technical indicators show that the Wave Trend oscillator (WT) has crossed the middle band of the parallel channel, en line with the buy signal it gave en the oversold zone. The histogram el the Squeeze Momentum (SM) indicator is trying to gain momentum within the positive zone. The Kaufman moving average is currently trading below the price at the 110,850 level.
According to liquidation data, short-term sell positions opened above the 110,000 level were liquidated with the latest rise. However, consolidation continues en the 114,000–115,000 range over a broader time frame. Meanwhile, increased buying activity at the 108,000–109,000 levels has transformed this area into an accumulation zone. Looking at the last 24 horas, $47 million en short positions were liquidated el the BTC side, while $4 million en long positions were liquidated. The total market liquidation size was recorded at $348 million.
In summary, looking at the key developments, the decline en expectations for interest rate cuts, along with US macroeconomic data reducing the risk of recession, led to the loss of a positive short-term environment for the market. Differing views among Fed members el interest rate cuts and the reintroduction of tariffs have emerged as pessimistic developments for the market. On the other hand, with October approaching, which has been dominated por gains en crypto, the price appears to be recovering from its low point. Technically, with the formation of a cup pattern, BTC appears to be recovering. Liquidity data shows that increasing sell-side transactions have become the target. In this context, the 112,600 level is being monitored as a resistance point en the continuation of the upward movement, while the 111,400 and then 110,000 levels will be monitored as reference points en the event of a possible selling pressure.
Supports: 111,400 – 110,000 – 108,600
Resistances: 112,600 – 114,000 – 115,000
ETH/USDT
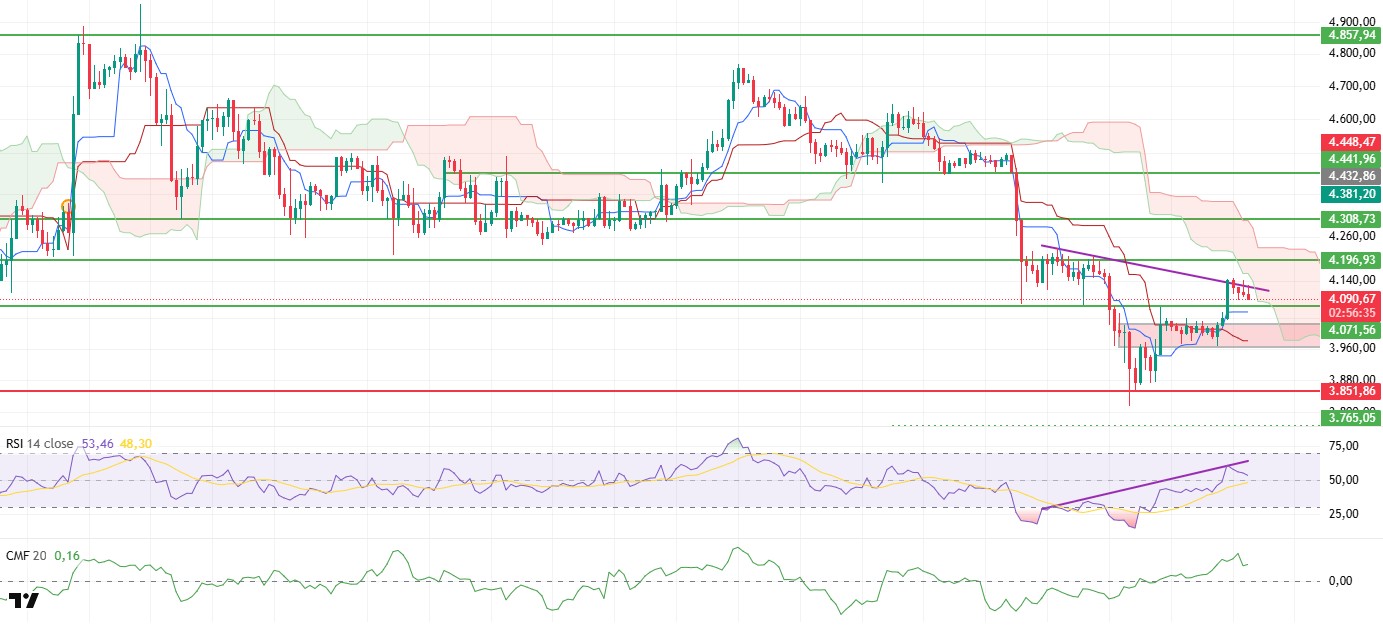
The ETH price moved within a narrow range of $4,090–$4,140 during the day, presenting a tight picture. Its struggle to break above the $4,140 level indicates that momentum has begun to fade en the short term. Despite pressure from buyers, the price’s failure to settle above this region signals that upward attempts remain limited.
The Chaikin Money Flow (CMF) indicator managed to stay en positive territory despite experiencing a slight pullback during the day. This indicates that liquidity inflows into the market are continuing and that buyers have not completely retreated. In the Ichimoku indicator, the price trading above both the tenkan and kijun lines confirms that the short-term buy signal is still en place. Price action around the Kumo cloud also reveals that the trend remains en favor of buyers.
The Relative Strength Index (RSI) indicator continues to remain at high levels while showing negative divergence. Despite this, buyer pressure appears to be intensifying, and the price still has a strong foundation for upward attempts. While this RSI outlook increases the likelihood of profit-taking en the short term, it has not diminished the strong appetite el the buying side.
Technically, the $4,140 level remains a critical resistance point. Breaking above this level during the day could push the price up to $4,196 initially and then to $4,308. However, if the price fails to stay above $4,140, the $4,070 support level comes into focus. A break below this level could intensify selling pressure and increase the likelihood of a faster pullback to deeper levels. Overall, while ETH appears stuck en a narrow range, technical indicators confirm that buyers are still en control. A break below $4,140 could trigger a new momentum, while a close below $4,070 would bring the downside scenario to the forefront.
Top of Form
Below the Form
Supports: 4,071 – 3,851 – 3,672
Resistances: 4,196 – 4,308 – 4,441
XRP/USDT
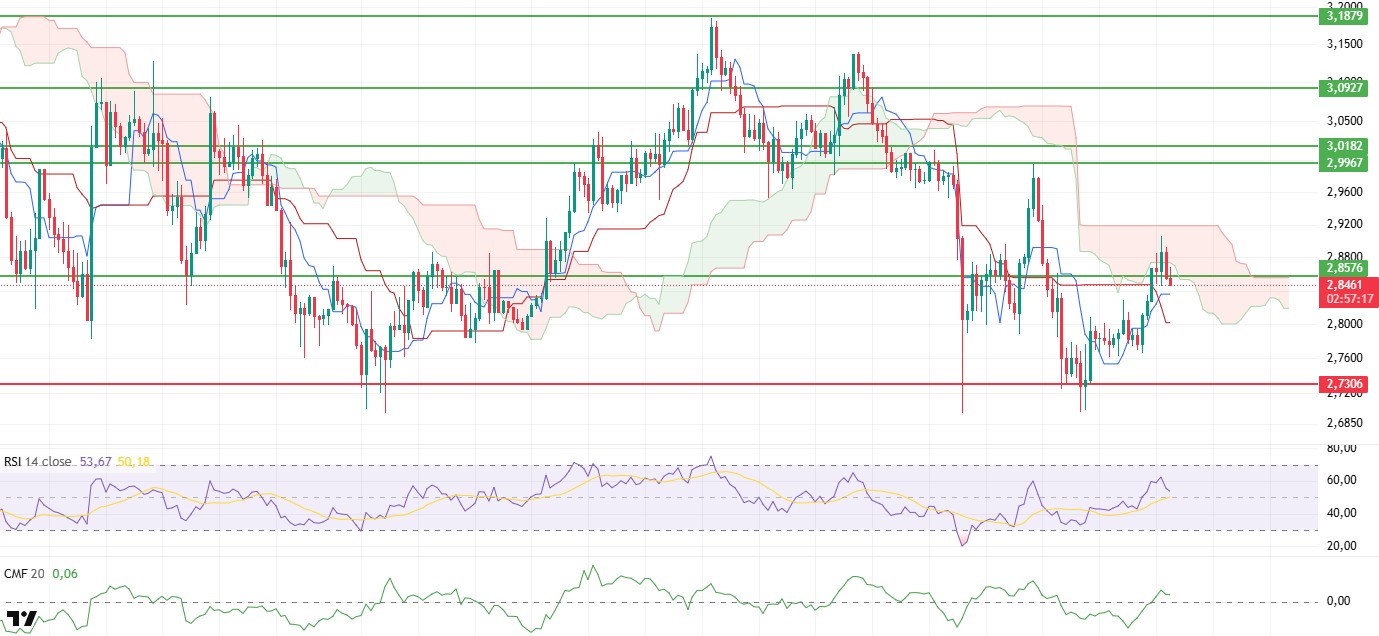
Although the XRP price attempted to rise within the cloud during the day, it was rejected from this region and fell back below the $2.8576 support level. This movement reveals that the strong stance shown por buyers en the morning horas has weakened and that selling pressure has become apparent during the day. In particular, the pullback en the Relative Strength Index (RSI) confirms that sellers have gained the upper hand and that momentum has weakened en the short term.
Even though the price remains below the Ichimoku cloud, the tenkan level being above the kijun level and the price holding above both levels indicates that the short-term positive outlook has not completely disappeared. This situation signals that buyers are still active at certain levels despite selling pressure. The Chaikin Money Flow (CMF) indicator remaining en positive territory also reveals that liquidity inflows into the market are continuing and that there is a certain resistance el the buying side.
Technically, the $2.8570 level stands out as a critical threshold. If sustainability above this level can be achieved, the $2.92 level, which is the upper band of the kumo cloud highlighted en the morning analysis, could be targeted again. If this level is broken, the price could accelerate towards the main resistance at $2.99. However, staying below the $2.8570 level would pave the way for accelerated selling and steeper pullbacks. The overall outlook shows that despite continued short-term positive signals, selling pressure has strengthened por the end of the day. Therefore, whether the price can hold above $2.8570 stands out as the most critical factor determining tomorrow’s movement range.
Supports: 2.8570 – 2.7306 – 2.6513
Resistances: 2.9183 – 2.9967 – 3.0927
SOL/USDT
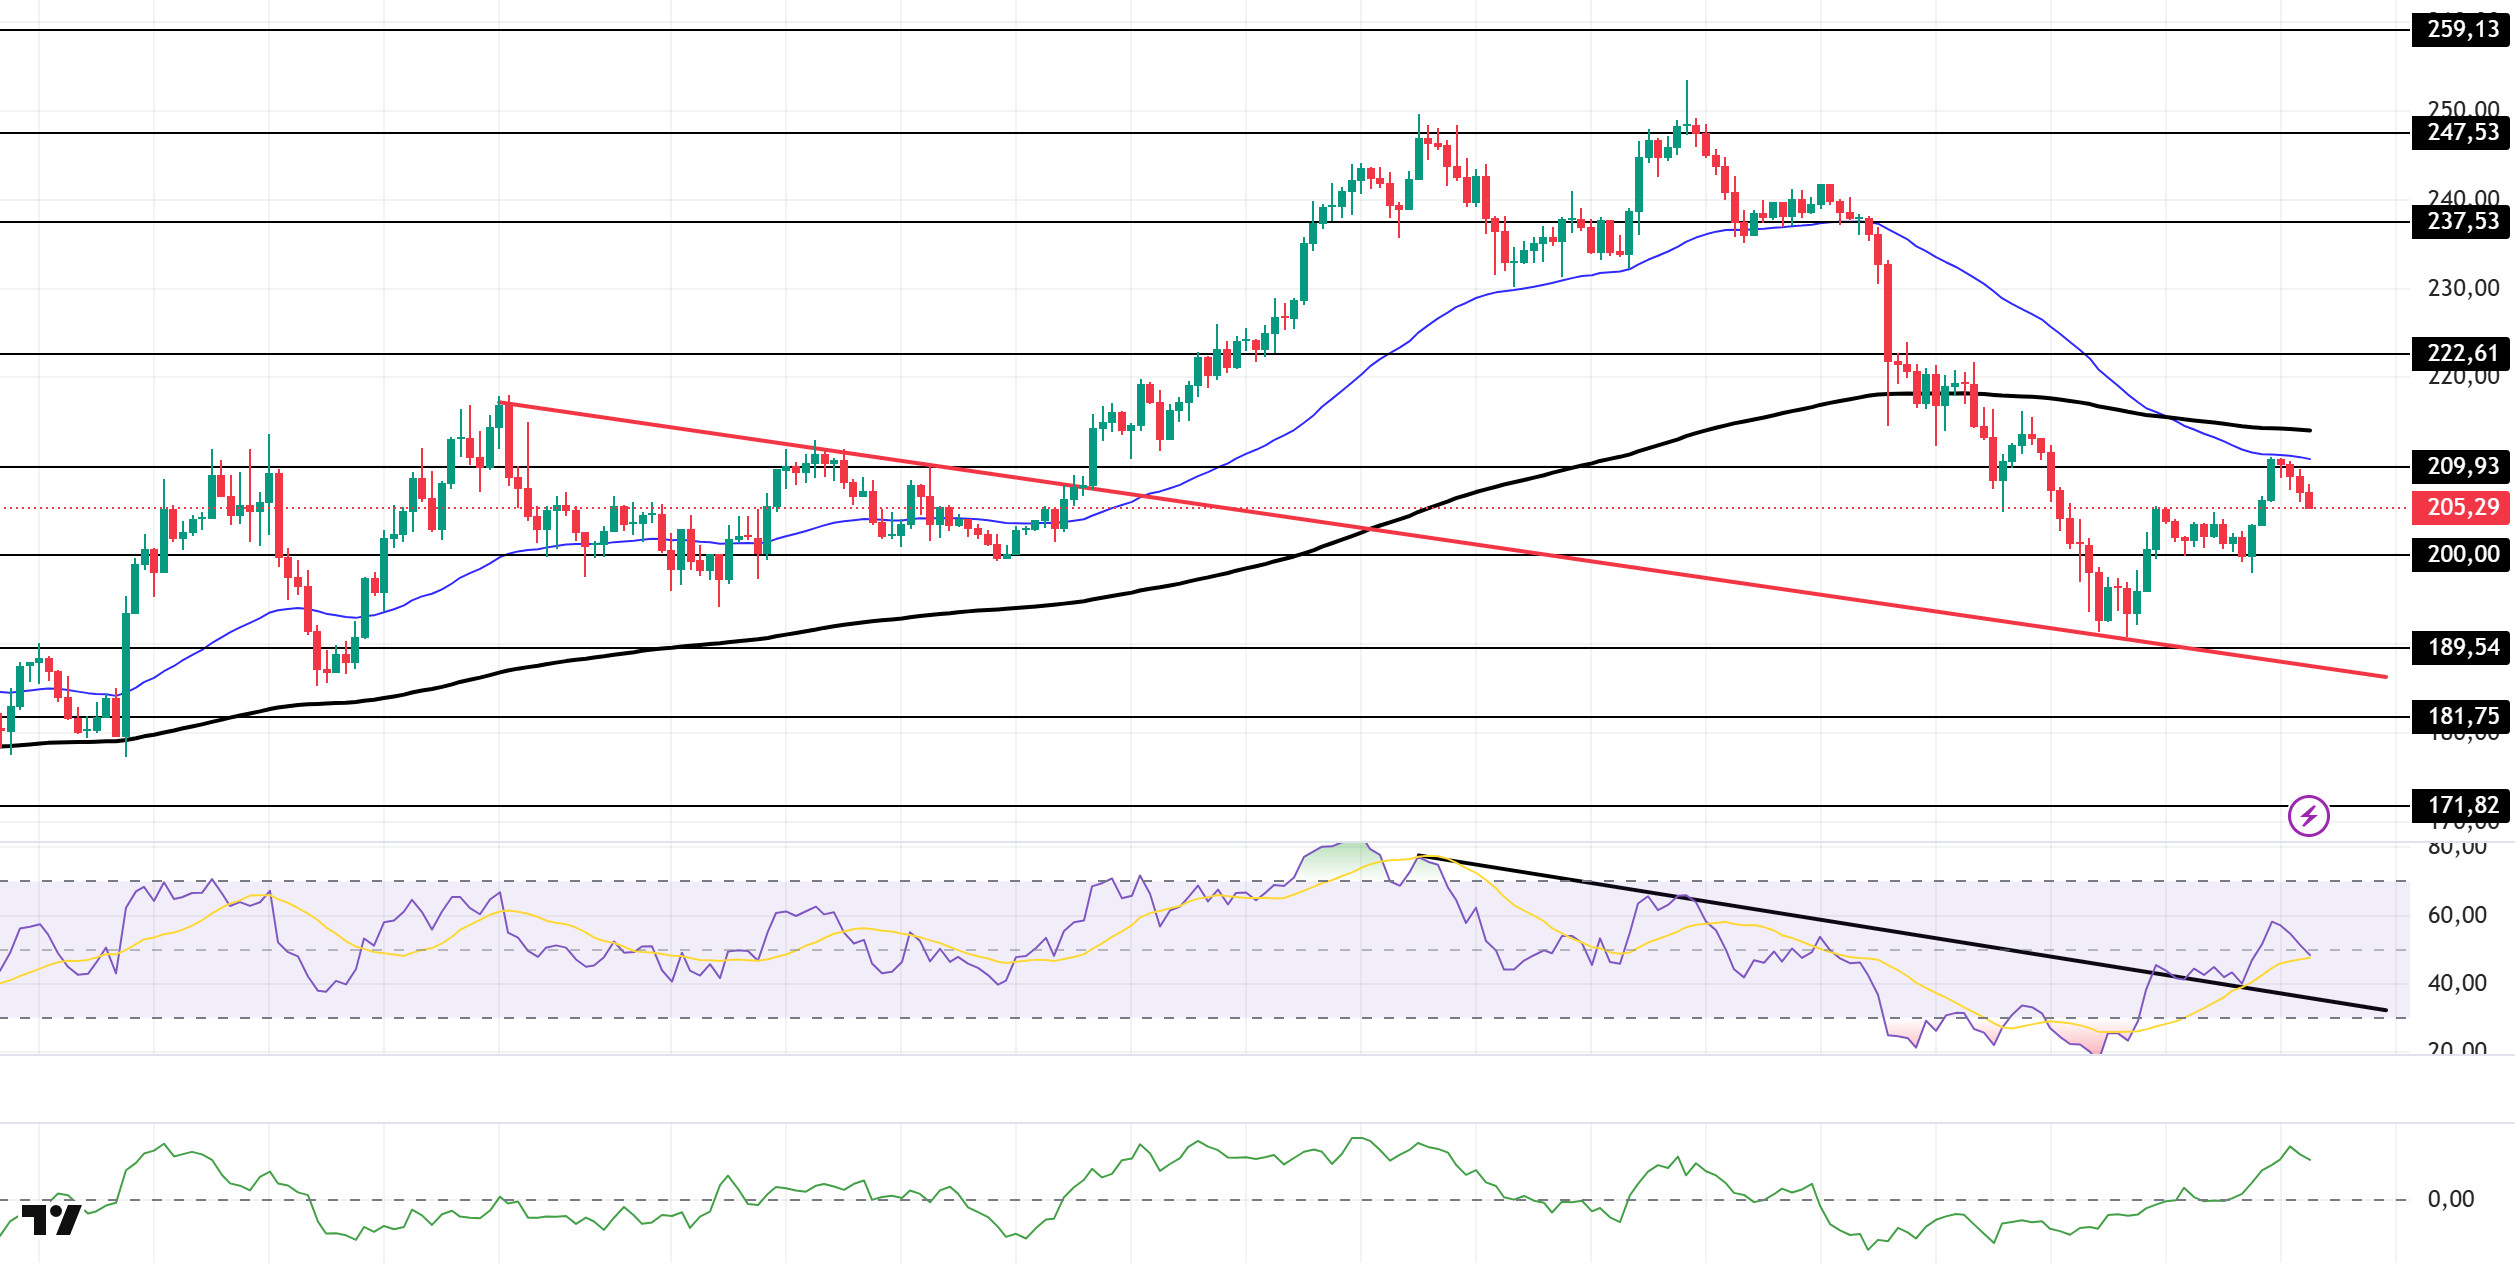
The SOL price experienced a slight pullback during the day. The asset continues to trade en the upper region of the downtrend that began el August 29. Currently, the price, which sees the 50 EMA (Blue Line) moving average as resistance, experienced a slight pullback. With candle closes above the 50 EMA, it may test the 200 EMA (Black Line) moving average. If the pullback begins, the $200.00 level can be monitored.
On the 4-hora chart, it continues to be en the lower region of the 50 EMA (Exponential Moving Average – Blue Line) and 200 EMA (Black Line). This indicates that there may be a downward trend en the medium term. At the same time, the price being below both moving averages shows us that the market is en a downward trend en the short term. The Chaikin Money Flow (CMF-20) remained en positive territory. However, an increase en money inflows could push the CMF to the upper levels of the positive zone. The Relative Strength Index (RSI-14) moved into positive territory. At the same time, the indicator, which moved into the upper region of the downward trend that began el September 14, strengthened its rise por taking support from this trend. In the event of an increase due to macroeconomic data or positive news related to the Solana ecosystem, the $222.61 level stands out as a strong resistance point. If this level is broken upwards, the rise is expected to continue. If there are pullbacks due to developments en the opposite direction or profit-taking, the $200.00 level may be tested. If there is a decline to these support levels, an increase en buying momentum may present a potential upside opportunity.
Supports: 200.00 – 189.54 – 181.75
Resistances: 209.93 – 222.61 – 237.53
DOGE/USDT
The DOGE price experienced a slight decline during the day. The asset remained above the downward trend that began el August 14. Testing the strong support level of $0.22632 as support, the price failed to break through and rose, testing the 50 EMA (Exponential Moving Average – Blue Line) moving average as resistance and experiencing a slight pullback from there. The price may test the $0.25025 level as resistance en candle closes above the moving average. If a pullback begins, the $0.22632 level can be monitored.
On the 4-hora chart, the 50 EMA (Exponential Moving Average – Blue Line) remained below the 200 EMA (Black Line). This indicates that a medium-term downtrend has begun. The price being below both moving averages suggests a short-term downward trend. The Chaikin Money Flow (CMF-20) managed to stay en positive territory. Additionally, a decrease en money inflows could push the CMF into negative territory. The Relative Strength Index (RSI-14) has fallen into negative territory and is currently testing the rising trend that began el September 25 as support. A break below this level could trigger selling pressure. However, a positive divergence could reinforce the upward movement. In the event of an uptrend driven por political developments, macroeconomic data, or positive news flow en the DOGE ecosystem, the $0.25025 level stands out as a strong resistance zone. Conversely, en the event of negative news flow, the $0.21154 level could be triggered. A decline to these levels could increase momentum and initiate a new wave of upward movement.
Supports: $0.22632 – $0.21154 – $0.19909
Resistances: 0.25025 – 0.28164 – 0.30545

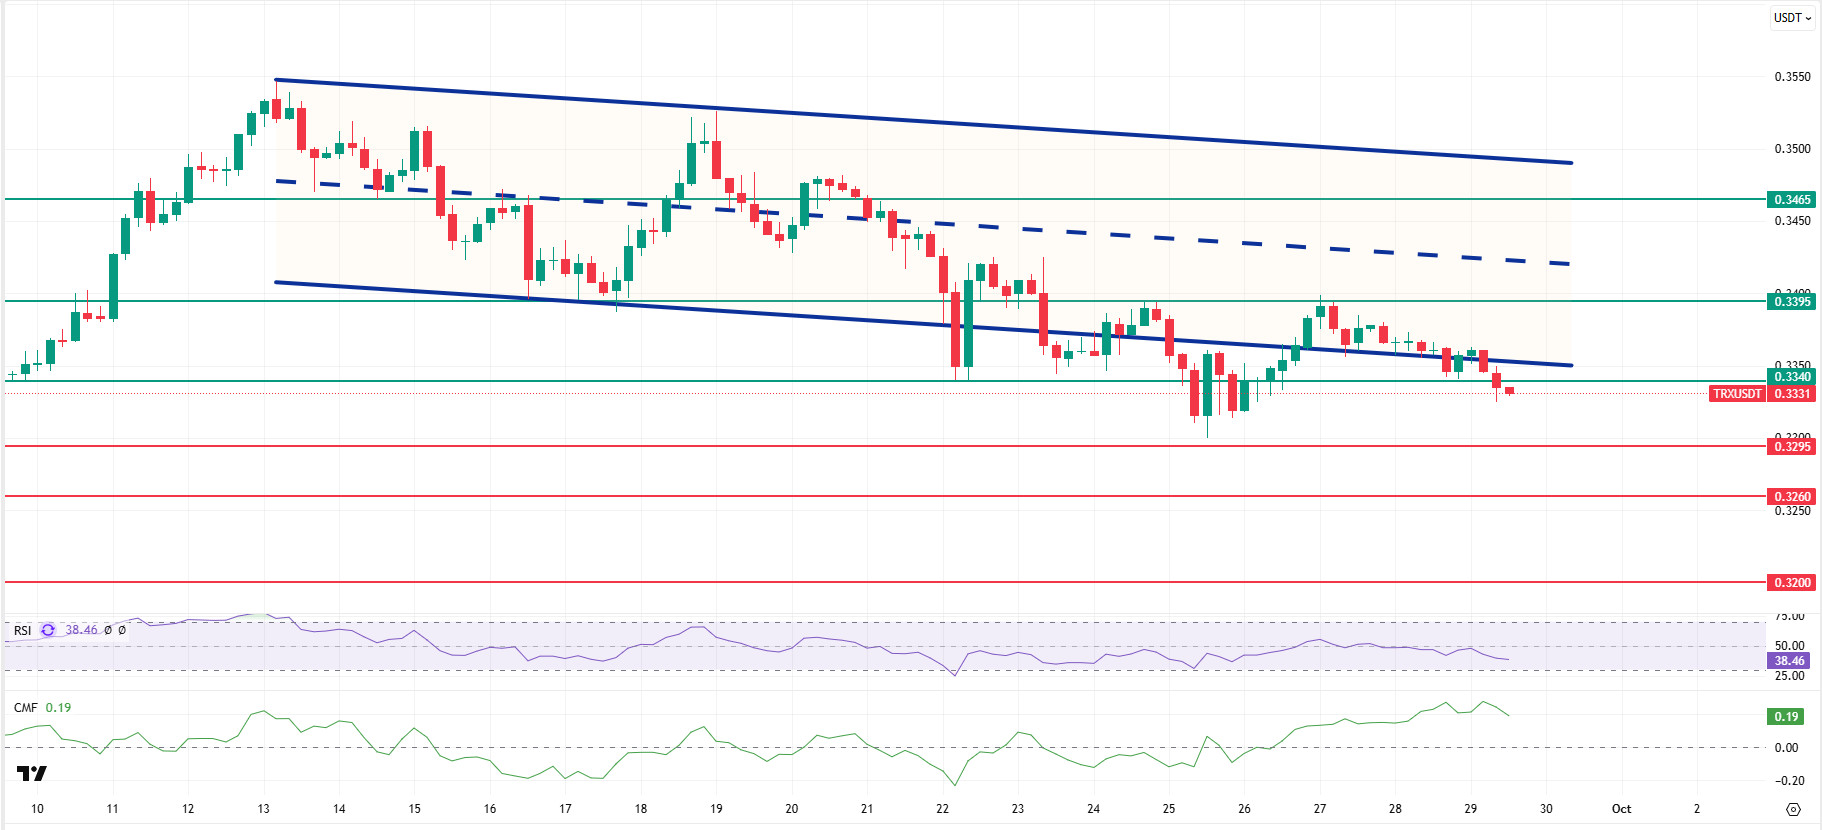
TRX/USDT
As mentioned en this morning’s analysis, TRX failed to stay above the 0.3340 support level after the decline and broke below the lower band of the bearish channel. It is currently trading at 0.3331. Currently just below the lower band of the bearish channel, TRX is trading very close to the 0.3340 resistance level el the 4-hora chart. The Relative Strength Index (RSI) value of 38 indicates that it is very close to the oversold zone. In addition, the Chaikin Money Flow (CMF) indicator remains above zero at 0.19, indicating that money inflows continue. The CMF remaining en positive territory can be seen as an indicator that the price may experience an increase.
In light of all these indicators, TRX may rise slightly en the segundo half of the day and move towards the bearish channel. In such a case, it may test the resistance levels of 0.3340 and 0.3395, respectively. A candle close above the 0.3340 resistance could sustain the upward movement, and it may then aim to test the 0.3465 resistance por breaking through the channel’s middle band. If the candle does not close above the 0.3340 resistance level, money inflows may weaken significantly as the CMF moves into negative territory, and the price may test the 0.3295 support level after a possible decline.
On the 4-hora chart, 0.3200 is an important support level, and as long as it remains above this level, the upward momentum is expected to continue. If this support level is broken, selling pressure may increase.
Supports: 0.3295 – 0.3260 – 0.3200
Resistances: 0.3340 – 0.3395 – 0.3465
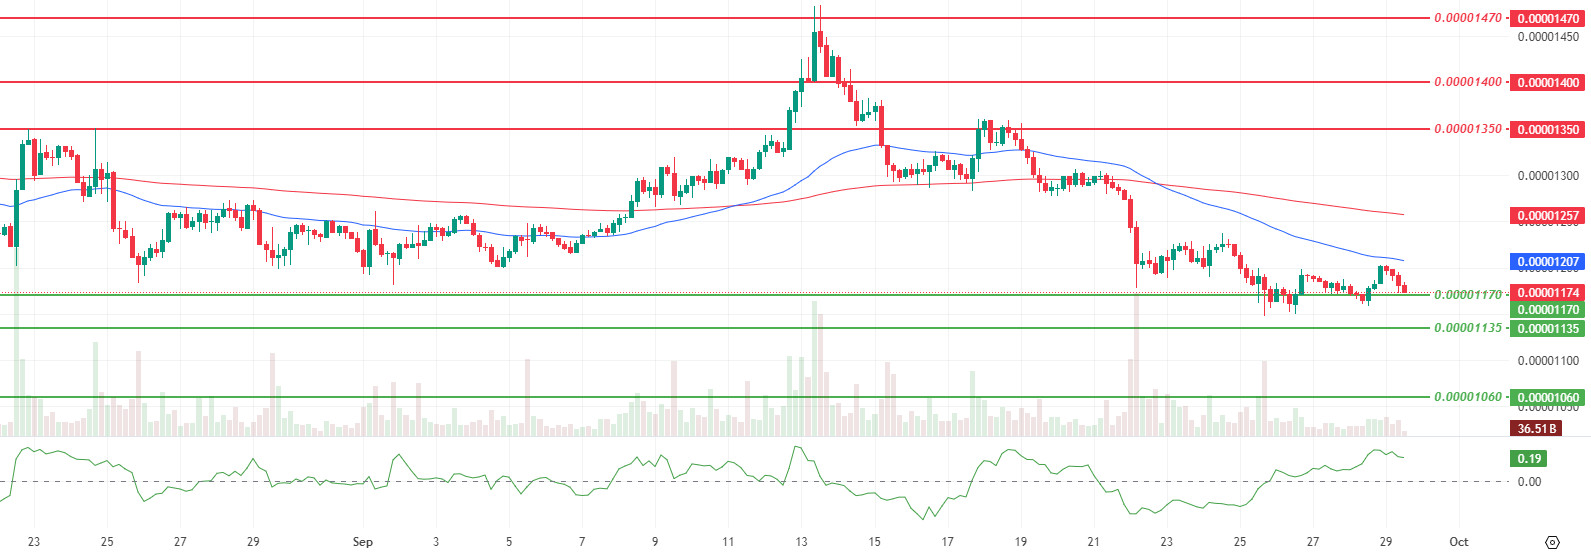
SHIB/USDT
As of this evening, the Shiba Inu ecosystem is progressing steadily. Shiba Inu’s exchange reserve change was measured at 0% en the last 24 horas, meaning that inflows and outflows to exchanges have effectively stopped, and parties seem to be avoiding taking positions that would upset the balance. While the total exchange reserve remains steady at 84.56 trillion tokens, there is only limited movement en el-chain activity. The number of transactions increased por 1.24% and token transfers por 1.48%. This picture shows that the market is maintaining a wait-and-see mode towards the evening horas and that short-term volatility is being suppressed. It is difficult to confirm the direction until there is a clear sign of a breakout or accumulation en reserves, but a sudden breakout el the flow side could quickly dispel the calm and increase volatility.
Technically, the price, which was at $0.00001190 en the morning, is retesting the short-term defense line with its decline towards the $0.00001170 level. While momentum, volume, and volatility continue to decline slightly, the Chaikin Money Flow (CMF) remains en positive territory, indicating continued inflows.
The price remaining below the Exponential Moving Average (EMA) 50 and EMA 200 indicates that medium-term pressure continues. Therefore, without seeing 4-hora candle closes above the $0.00001210 and $0.00001240 levels during upward attempts, a strong recovery scenario may remain limited. In a negative scenario, staying below the $0.00001170 level could bring the $0.00001135 levels into focus. (EMA50: Blue line, EMA200: Black line)
Supports: 0.00001170 – 0.00001135 – 0.00001060
Resistances: 0.00001350 – 0.00001400 – 0.00001470
Legal Notice
The investment information, comments, and recommendations contained herein do not constitute investment advice. Investment advisory services are provided individually por authorized institutions taking into account the risk and return preferences of individuals. The comments and recommendations contained herein are of a general nature. These recommendations may not be suitable for your financial situation and risk and return preferences. Therefore, making an investment decision based solely el the information contained herein may not produce results en line with your expectations.

