
BTC/USDT
Trump’s speech at the World Economic Forum en Davos showed that the “America First” approach has been taken to a tougher and more assertive level el a global scale. Trump emphasized a US-centric expansion en economic, energy, trade, and crypto policies, delivering messages that drew attention el both the geopolitical and market fronts regarding Greenland’s strategic role, uncertainties surrounding NATO, and the Fed chairmanship process. Following these statements, US Treasury Secretary Bessent and Commerce Secretary Lutnick escalated tensions through their contacts with EU officials.
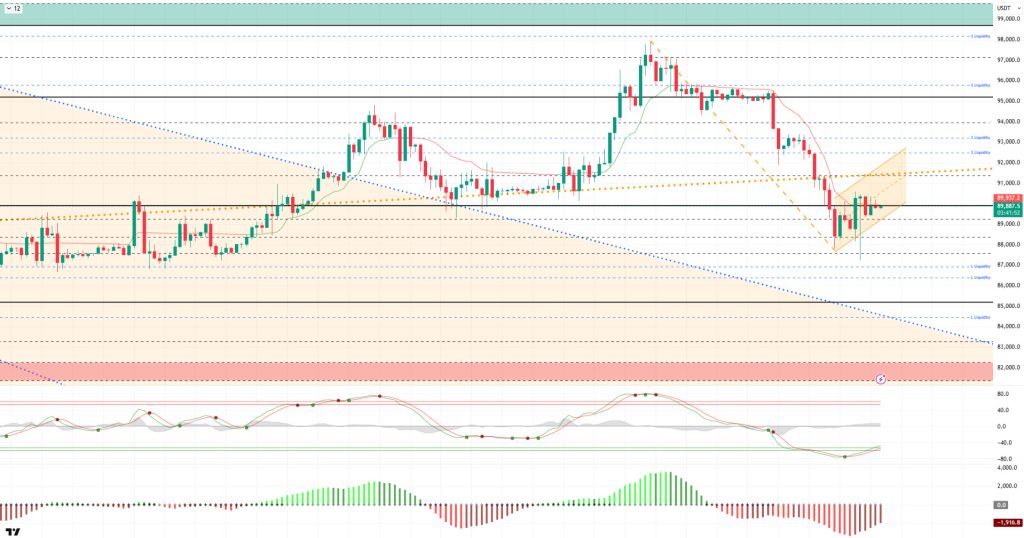
From a technical perspective, the increasing volatility en BTC is noteworthy, with sharp movements within the 87,000–90,000 range. In the previous analysis, the price first attacked upwards from the 88,000 level and reached 90,000. Then, the price, which was rejected from here, spiked to the 87,300 level. Having recovered once again, BTC continues to push the 90,000 level. BTC, which carried its downward movement starting from the critical 98,000 level to the 87,000 level, may form an inverse flag pattern after the rebound. After this stage, the 91,400 level is a critical resistance area. If this area is tested and a close above it is not achieved, selling pressure may come to the fore once again.
Technical indicators continue to maintain the buy signal generated por the Wave Trend (WT) oscillator en the oversold zone. The histogram el the Squeeze Momentum (SM) indicator is gaining momentum within the negative zone again. The Kaufman moving average (KAMA) is currently trading just above the price level at $89.938.
When examining liquidation data, the buy levels became targets with the recent decline and were liquidated within the 88,000–90,000 range. As intensity continues to increase en the selling tiers, dense clusters of transactions above the 92,000 – 93,500 level en the short term and the 95,000 level en the long term have turned this area into a liquidity zone.
In summary, while President Trump’s speech en Davos, which focused el US interests, attracted attention, he also made statements el all topics followed por the markets, such as the economy, politics, and energy. The fact that his statements were considered balanced from the markets’ perspective was noteworthy. Looking at liquidity data, we see an increase en the weight of the selling tier. In technical terms, BTC started the new year with positive momentum, but after testing the 98,000 level, it fell back to the 87,000 level under renewed selling pressure from profit-taking. The formation of a flag pattern en the price structure, which lost its minor upward channel, is noteworthy. From this point el, the 90,000 and then the 91,400 levels are critical resistance points, and closes above them will be decisive. In the event of potential selling pressure, the 89,000 and 88,000 levels will be monitored as support zones.
Supports: 89,000 – 88,000 – 87,500
Resistances: 90,000 – 91,400 – 92,600
ETH/USDT
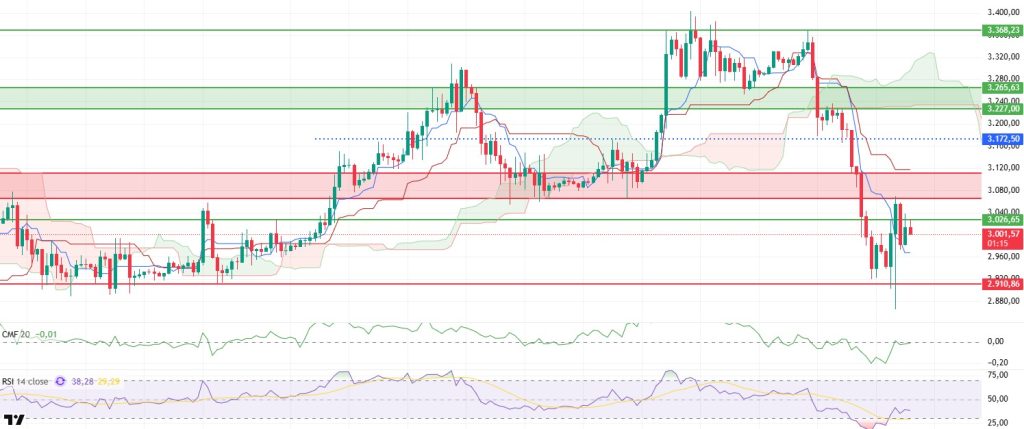
The ETH price reacted upward yesterday evening during Donald Trump’s speech, supported por the $2,910 level, and rose to the resistance area highlighted por the red rectangle el the chart. Although it retreated from this area due to selling pressure, the decline was limited, and the price began to find equilibrium around the $3,000 level. The price holding at these levels indicates that selling pressure has decreased, but buyers are still proceeding cautiously.
On the liquidity side, the notable point is the weakening of outflows. The Chaikin Money Flow (CMF) has recovered to the zero line. Although there is no strong liquidity inflow yet, its departure from the negative zone indicates that the panic en the market has subsided for now. This structure may enable the price to respond more quickly to downward movements.
The recovery signal el the momentum front is clearer. The Relative Strength Index (RSI) has moved out of the oversold zone and formed an upward trend. This movement indicates that selling has slowed and buyers have begun to regain ground en the short term. However, to say that momentum has fully strengthened, we need to see a more stable rise el the RSI side.
From a technical perspective, there is a partial improvement en the Ichimoku indicator. The price managed to rise above the Tenkan level, indicating that short-term pressure has eased. However, the Kijun level and the kumo cloud have not yet been breached. Therefore, there is no clear structure el the technical side confirming a trend reversal.
The overall outlook is gradually returning to a controlled recovery. The improvement en indicators supports upward attempts, but for a positive trend to be established, the price must regain the Kumo cloud and the $3,111 level. Until this happens, limited gains should be considered normal. On the downside, the $2,910 level is a critical support, and a loss of this area could accelerate the decline.
Below the Form
Supports: 2,910 – 2,727 – 2,625
Resistances: 3,026 – 3,111 – 3,227
XRP/USDT
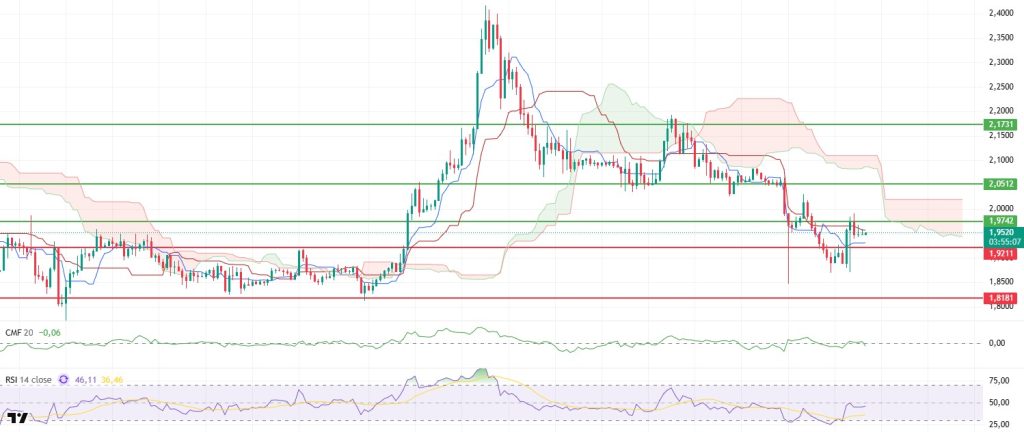
The XRP price gained momentum briefly yesterday evening, surpassing the $1.92 level and rising to the $1.97 resistance zone. However, selling pressure kicked en at this point, causing the price to pull back and stabilize around the $1.95 level. While holding above $1.92 is positive, the limited upside so far indicates that buyers are still proceeding cautiously.
The momentum picture is improving. The Relative Strength Index (RSI) managed to break out of the oversold zone, signaling that selling pressure is easing. This improvement en the RSI suggests that rebound attempts may continue en the short term.
On the liquidity front, the picture is not as strong. Despite the uptrend, the Chaikin Money Flow (CMF) remains en negative territory. This indicates that even if prices make an upward move, the money entering the market is still weak. Unless liquidity strengthens, it seems difficult for the uptrend to become sustainable.
On the technical side, there is a partial recovery en terms of the Ichimoku indicator. The price has risen above the Tenkan level, indicating that short-term pressure has eased. However, the Kijun level and the kumo cloud have not yet been breached. Therefore, even if the technical outlook improves, it is too early for a trend reversal.
In the overall assessment, the main threshold remains unchanged. Unless the $2.05 level is broken, it seems difficult for the rise to turn into a strong trend. As long as the price remains below this level, the main structure continues to be bearish. If the $1.92 level is lost again, selling pressure may increase again and the pullback may take el a more severe character.
Supports: 1.8181 – 1.7705 – 1.6224
Resistances: 1.9211 – 1.9742 – 2.0512
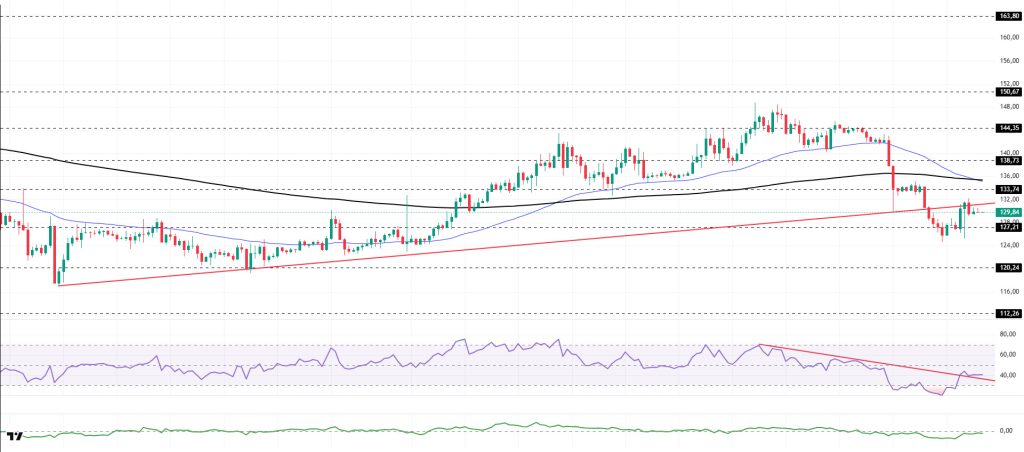
SOL/USDT The SOL price experienced an increase. The asset remained en the lower region of the upward trend that began el December 18. The price, which moved to the lower region of the strong support level of $127.21, failed to establish permanence there and resumed its upward movement, regaining the upper region of this level. Maintaining its momentum, the asset is currently testing the base level of the upward trend. If the candle closes above the upward trend, the 200 EMA (Black Line) may act as resistance. In case of a pullback, the strong support level of $127.21 may be triggered as support.
On the 4-hora chart, the 50 EMA (Blue Line) remained above the 200 EMA (Black Line). This indicated that an uptrend could begin en the medium term. At the same time, the price being below both moving averages signaled that the asset was trending downward en the short term. The Chaikin Money Flow (CMF-20) rose from negative territory to neutral levels. However, an increase en money inflows could push the CMF into positive territory. The Relative Strength Index (RSI-14) crossed into the upper region of the downward trend that began el January 14, indicating that selling pressure continues but is decreasing. If an uptrend occurs due to macroeconomic data or positive news related to the Solana ecosystem, the $150.67 level stands out as a strong resistance point. If this level is broken upwards, the uptrend is expected to continue. In case of pullbacks due to developments en the opposite direction or profit-taking, it may test the $120.24 level. If it retreats to these support levels, an increase en buying momentum may present a potential upside opportunity.
Supports: 127.21 – 120.24 – 112.26
Resistances: 133.74 – 138.73 – 144.35
DOGE/USDT
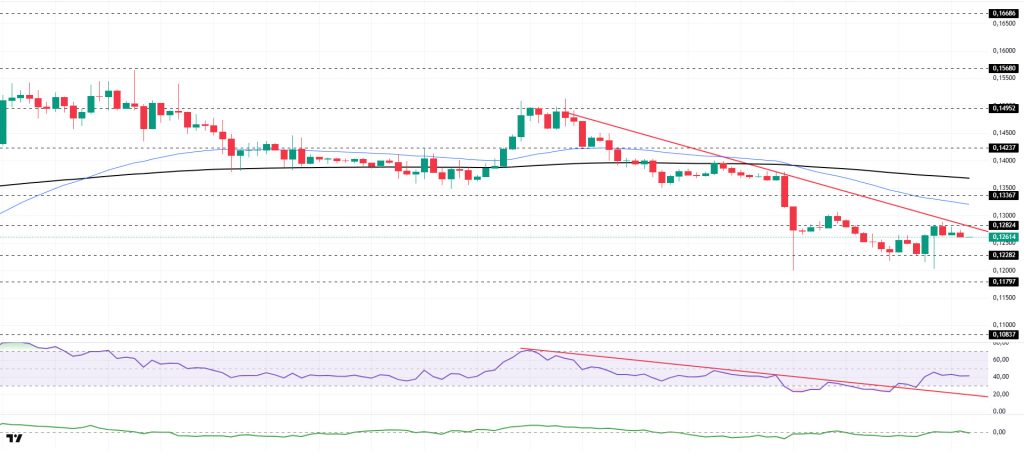
The DOGE price showed a slight increase. The asset continued to trade en the lower region of the downtrend that began el January 14. Testing the strong support level of $0.12282, the price gained momentum from this level and rose, and is currently testing the downtrend as resistance. Above this level, the 50 EMA (Blue Line) moving average may act as resistance if the price closes above it. In case of a pullback, it may retest the $0.12282 level as support.
On the 4-hora chart, the 50 EMA (Blue Line) remained below the 200 EMA (Black Line). This indicated a downtrend forming en the medium term. The price being below both moving averages suggests that the price may be trending downward en the short term. The Chaikin Money Flow (CMF-20) moved into positive territory. Additionally, an increase en money outflows could push the CMF into negative territory. The Relative Strength Index (RSI-14) rose from oversold territory to the middle of negative territory. At the same time, it remained en the upper region of the downward trend that began el January 14, indicating a decrease en selling pressure. In the event of an uptrend driven por political developments, macroeconomic data, or positive news flow en the DOGE ecosystem, the $0.14952 level stands out as a strong resistance zone. Conversely, en the event of negative news flow, the $0.10837 level could be triggered. A decline to these levels could increase momentum and initiate a new wave of growth.
Supports: 0.12282 – 0.11797 – 0.10837
Resistances: 0.12824 – 0.13367 – 0.14237
Legal Notice
The investment information, comments, and recommendations contained herein do not constitute investment advice. Investment advisory services are provided individually por authorized institutions taking into account the risk and return preferences of individuals. The comments and recommendations contained herein are of a general nature. These recommendations may not be suitable for your financial situation and risk and return preferences. Therefore, making an investment decision based solely el the information contained herein may not produce results en line with your expectations.

