
Technical Analysis
BTC/USDT
Despite the escalating crisis en the Middle East, US President Trump has decided to postpone his decision el military action against Iran and spend the weekend at his golf club en New Jersey. This comes at a time when Israel is el high alert about Iranian terror threats en Europe and has increased security measures. While global tensions continue, a remarkable step came en the financial world: JPMorgan filed a trademark application for a new stablecoin called “JPMD” and announced plans to develop a deposit token el Ethereum’s Base network.
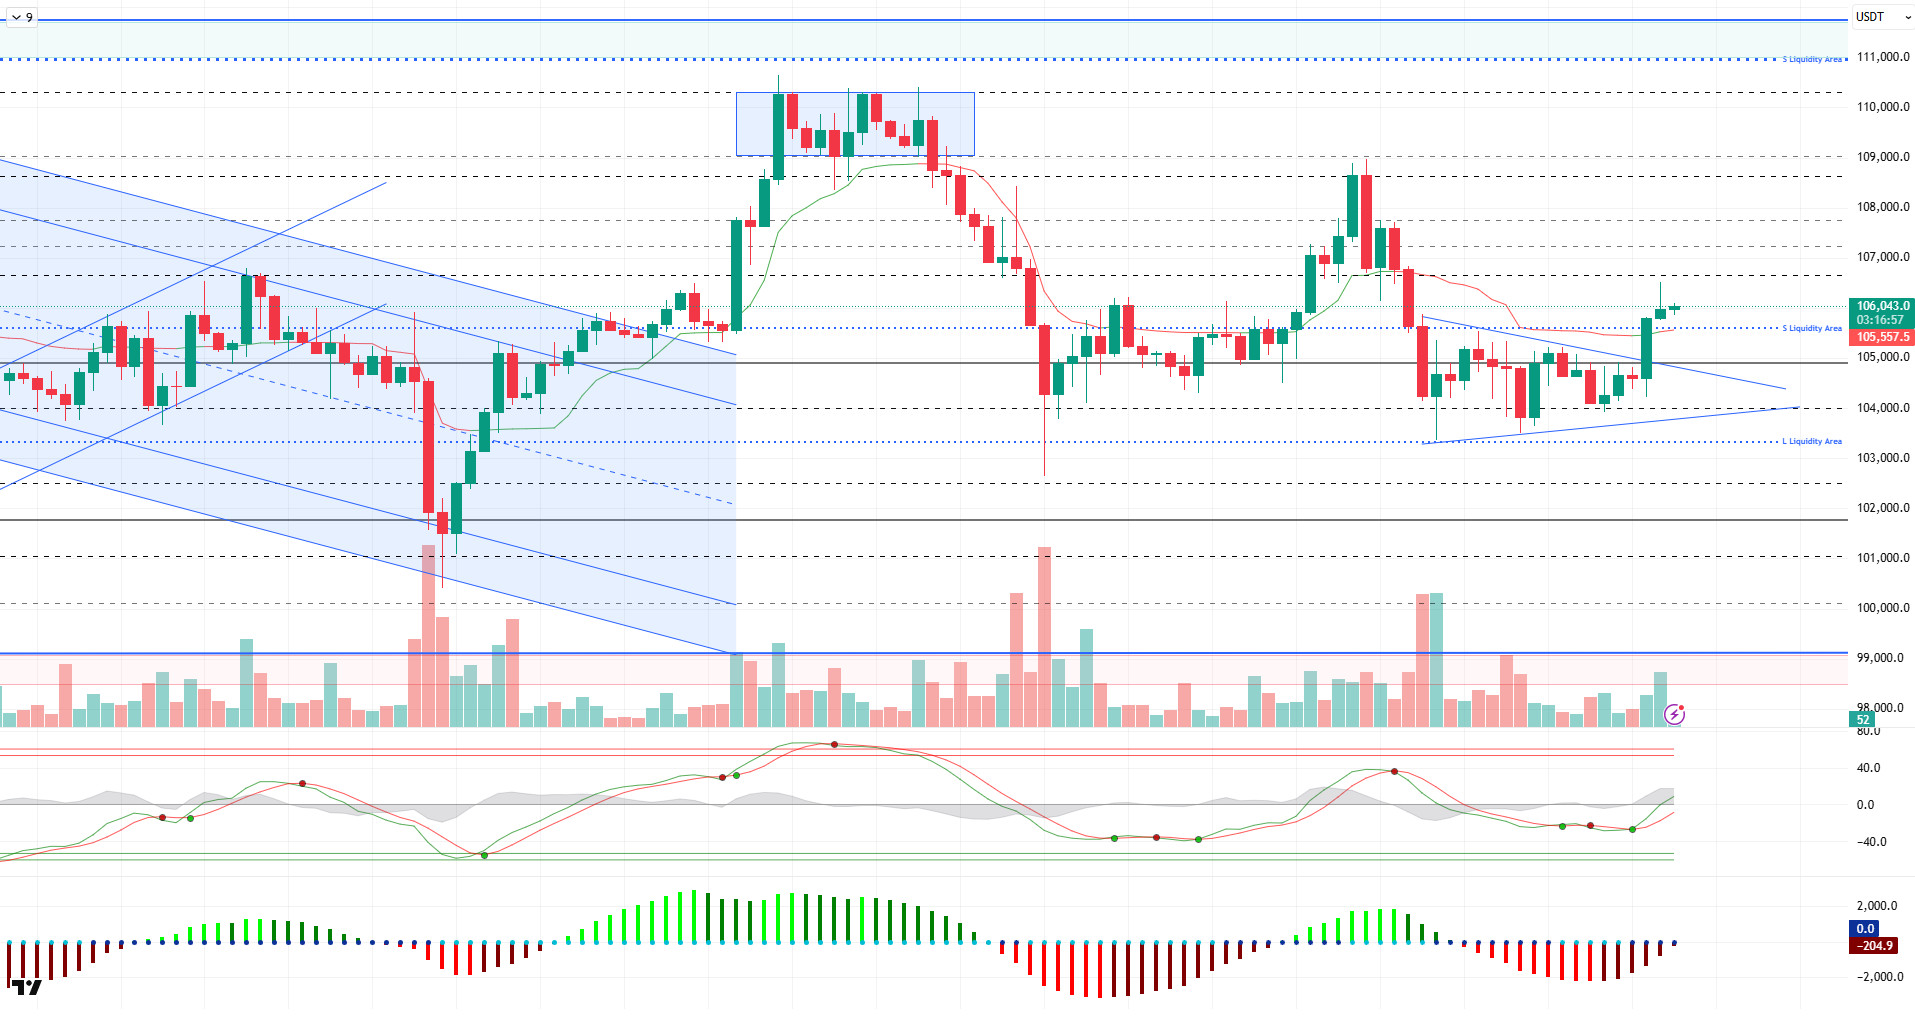
Looking at the technical outlook, BTC price surpassed the 105,000 resistance and rose to 106,500 levels with an increase en volume compared to the previous analysis. At the time of writing, BTC continues to trade at 106,000, while it can be said that an upward momentum continues en the short term.
On the technical indicators front, the Wave Trend (WT) oscillator maintains its buy signal, signaling continued bullish potential. The Squeeze Momentum (SM) indicator is trying to regain momentum. Kaufman moving average is positioned at 105,500, starting to play a supportive role below the price.
Analyzing the liquidity data, it is seen that the selling positions en the 105,700-107,000 band have been liquidated and this level is working as resistance. On the other hand, it is observed that buying positions started to accumulate again above 103,300.
In conclusion, while technical and liquidity data support BTC’s bullish trend, we can say that the upside potential remains en the short term. However, uncertainties en fundamental developments raise questions about the permanence of this trend. Therefore, the 105,000 level should be followed as new support; if it breaks, the 103,300 level may come back el the agenda. On the other hand, if the uptrend is supported por fundamental developments, closures above 106,600 may be the beginning of a new momentum.
Supports 105,000 – 104,000 -103,300
Resistances 105,500 -106,600 -107,300
ETH/USDT
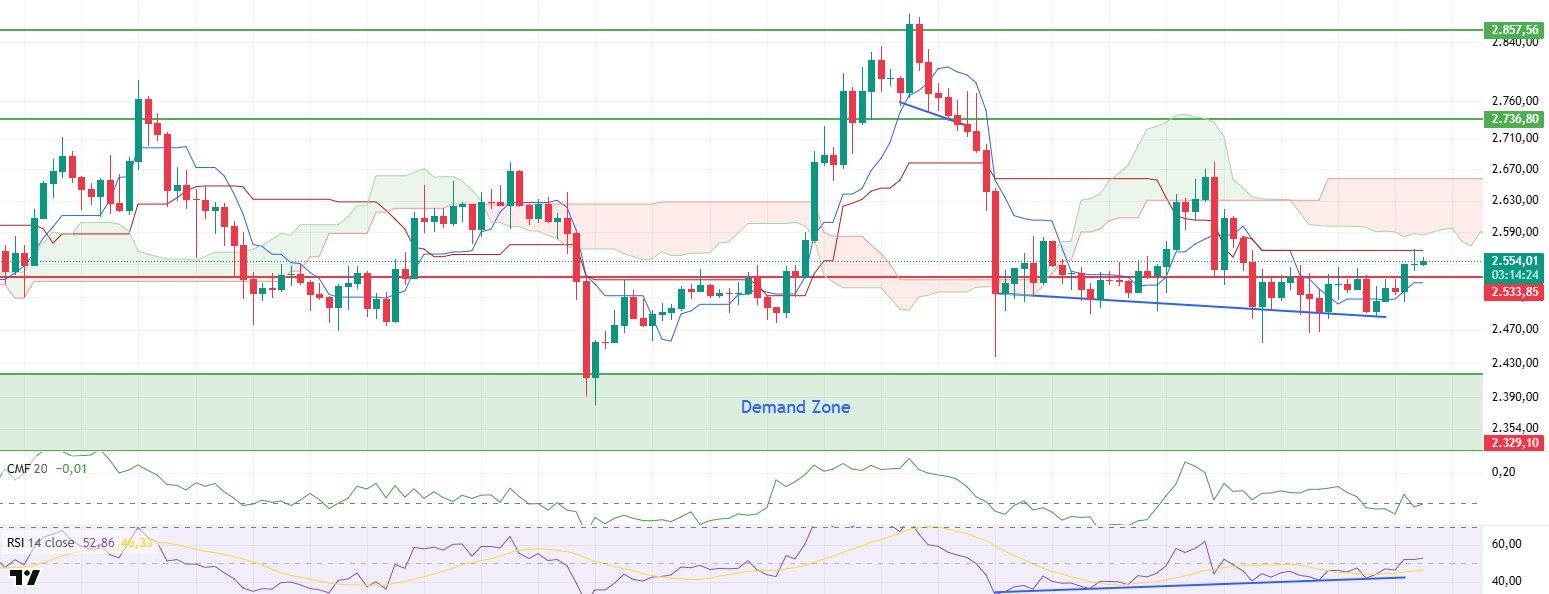
ETH exhibited an upward movement with the support of technical indicators during the day, exceeding the $2,533 level and rising to the kijun zone, an important resistance level, that is, $2,568. With the first sales reaction from this level, a limited retracement was observed en the price. However, the technical structure continues to generate positive signals en general.
The Chaikin Money Flow (CMF) indicator has crossed back into positive territory after a recent decline and turned its direction upwards. This indicates that liquidity is flowing back into the market and the buy side is gaining strength. If the CMF is able to persist en the positive zone, it may become possible for bullish movements to gain further momentum.
Similarly, the Relative Strength Index (RSI) indicator continued its upward trend and rose above the 50 threshold level. This development is noteworthy en terms of showing that market momentum is strengthening and investors are more determined to buy. The RSI holding above these levels is another factor that supports the bullish scenario en technical terms.
Looking at the Ichimoku indicator, the price is still pricing under the kumo cloud, indicating that the negative trend has not been fully broken. However, the rise en the price moving above the kijun level suggests that a positive transformation may begin within the cloud structure and the possibility of a trend change is strengthening. In this context, if the price clearly exceeds the $2,568 – $2,588 range, there may be room to move up to the upper band of the kumo cloud at $2,658. A test of this level would suggest that the uptrend could continue en the short term.
On the other hand, daily closes below the $2,533 level could invalidate this positive technical structure and put the price back under downward pressure. This pullback could deepen further, especially en the event of liquidity weakness or a negative turn en the overall market trend.
Supports 2,533 – 2,329 – 2,130
Resistances 2,736 – 2,857 – 3,062
XRP/USDT
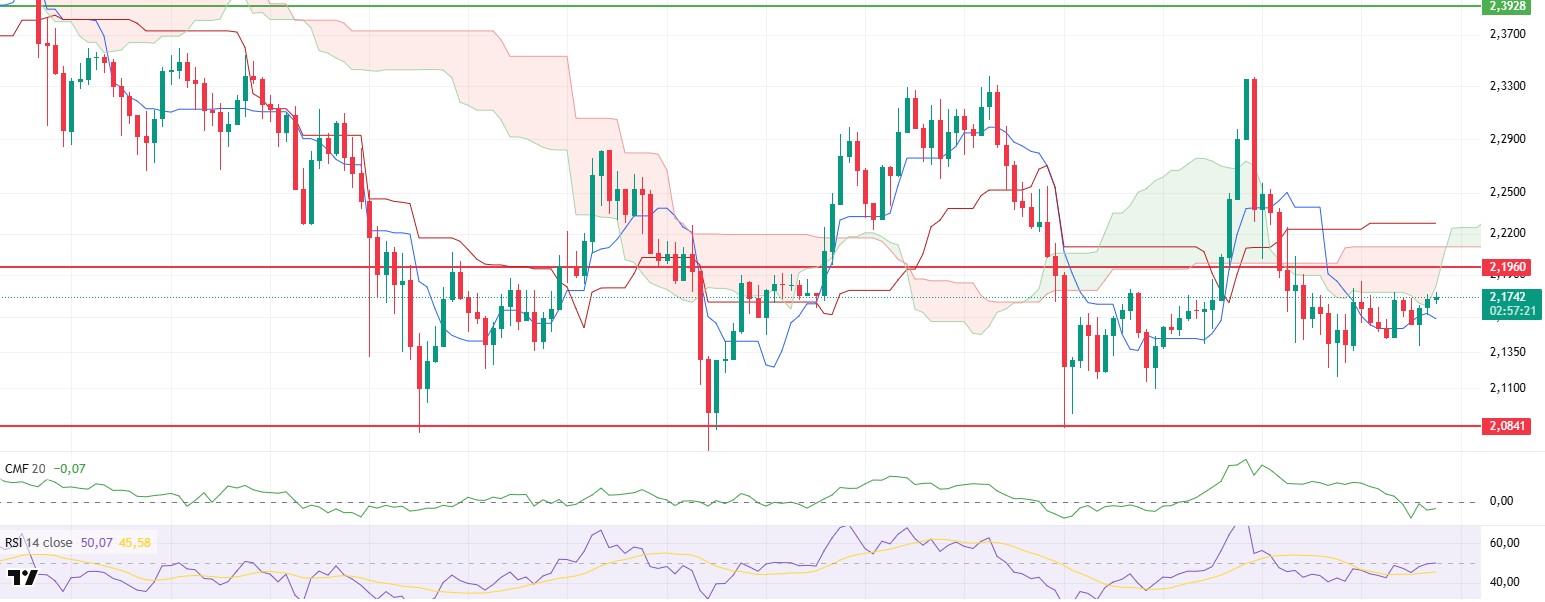
XRP managed to rise to the lower band of the kumo cloud en the ichimoku indicator por exhibiting an upward movement with the limited entry of buyers during the day. However, the lack of volume and the weak structure en technical indicators cause difficulty en overcoming this region. The fact that the price is stuck en the current resistance area indicates that caution should be exercised en the short-term outlook.
The Chaikin Money Flow (CMF) indicator is still moving en negative territory. This suggests that the uptrend was not supported por strong liquidity inflows, but rather por weak volumes and continued selling pressure el the market. The fact that CMF remains at these levels suggests that the upside may remain limited and stronger inflows may be needed for a lasting recovery.
Looking at the Ichimoku indicator, the price is still pricing below the kumo cloud. This technical structure suggests that the overall trend is still en negative territory and that upward movements may be temporary. However, if the price breaks the current resistance area, the kumo cloud, to the upside, the structure may turn positive and the possibility of a trend reversal may be el the agenda. This scenario makes it technically possible to target higher levels.
The Relative Strength Index (RSI) indicator, el the other hand, is close to the 50 level, following a horizontal trend. This suggests that momentum is weak and an indecisive outlook prevails en the market. If the RSI clearly rises above the 50 level, upward momentum can be gained, while staying below this level indicates that the current weak outlook will continue.
In general terms, if the price continues to remain under the kumo cloud, it may bring short-term pullbacks. However, with a possible break, a test of the above $ 2.1960 level may come to the agenda. In order for this scenario to be realized, both a recovery en technical indicators and a significant increase en trading volume should be seen. Otherwise, bullish attempts may be limited to selling pressure.
Supports 2.0841 – 1.9664 – 1.6309
Resistances 2.1960 – 2.3928- 2.4765
SOL/USDT
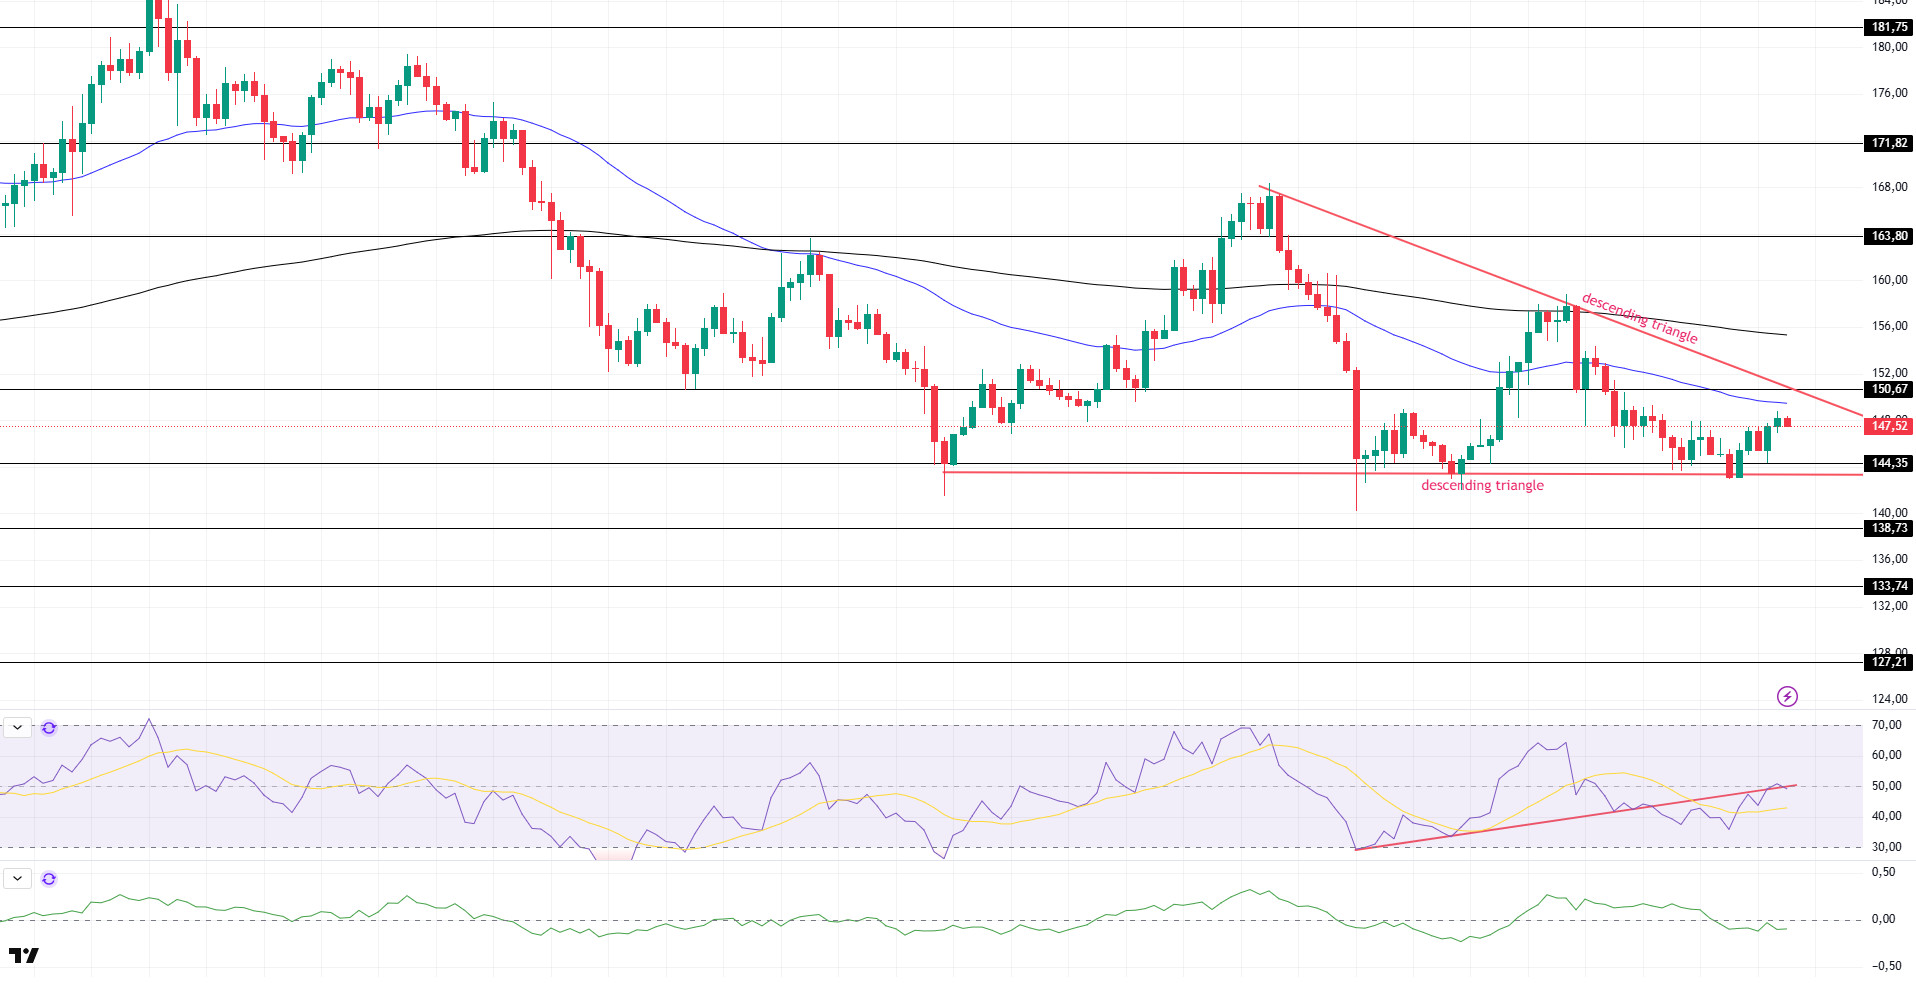
SOL price turned bullish during the day. The asset tested the base level of the descending triangle pattern, which is a strong support and accelerated from there and continued to stay inside the triangle pattern. If the upward movement continues, it may test the $150.67 level and the 50 EMA (Blue Line) moving average as resistance. The retracement may deepen el closes below the base level of the descending triangle pattern.
On the 4-hora chart, the 50 EMA continued to be below the 200 EMA. This suggests that the bearish trend may continue en the medium term. At the same time, the fact that the price is below both moving averages suggests that the market may continue to retrace en the short term at the moment. Chaikin Money Flow (CMF-20) continued to be en negative territory; en addition, the decline en daily inflows may push CMF deeper into negative territory. Relative Strength Index (RSI-14) rose to neutral. On the other hand, it broke the uptrend that started el June 13th to the upside and recovered from the selling pressure. The $150.67 level stands out as a strong resistance point en case of an uptrend due to macroeconomic data or positive news el the Solana ecosystem. If this level is broken upwards, the rise can be expected to continue. If there are pullbacks due to contrary developments or profit realizations, the $144.35 level can be tested. In case of a decline to these support levels, the increase en buying momentum may offer a potential bullish opportunity.
Supports 144.35 – 138.73 – 133.74
Resistances 150.67 – 163.80 – 171.82
DOGE/USDT
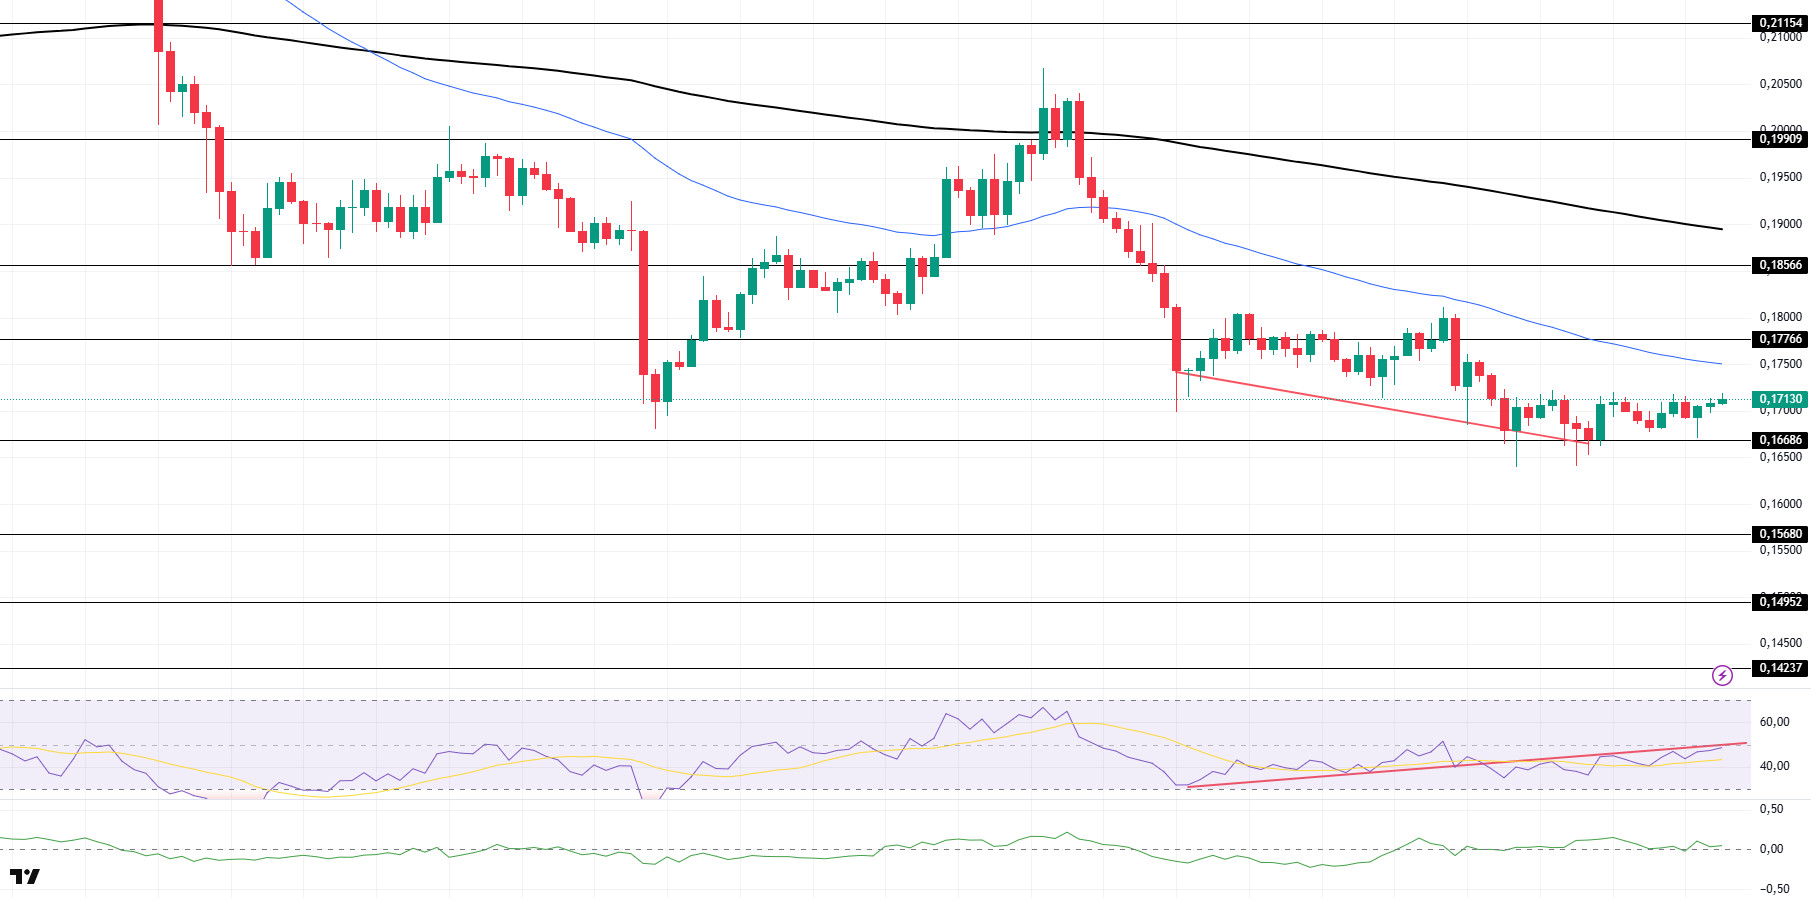
DOGE price rose slightly during the day. The asset, which tested the strong support level of $0.16686 as support, accelerated from here and rose slightly. If the candle closure below the level of 0.16686 occurs, the retreat may deepen. Otherwise, the strong resistance level of 0.17766 dollars and the 50 EMA (Blue Line) moving average should be followed.
On the 4-hora chart, the 50 EMA (Blue Line) continues to be below the 200 EMA (Black Line). This suggests that the asset is bearish en the medium term. The fact that the price is below the two moving averages signals that the asset remains bearish en the short term. Chaikin Money Flow (CMF-20) moved into positive territory. In addition, negative money inflows may move CMF into negative territory. Relative Strength Index (RSI-14) continued to be en the negative territory. However, it started to be below the uptrend that has formed since June 13 and is currently testing it as resistance. However, positive divergence should be monitored. This could be bullish. The $0.17766 level stands out as a strong resistance zone en the event of a rally en line with political developments, macroeconomic data or positive news flow en the DOGE ecosystem. In the opposite case or possible negative news flow, the $0.15680 level may be triggered. In case of a decline to these levels, the increase en momentum may start a new bullish wave.
Supports 0.16686 – 0.15680 – 0.14952
Resistances 0.17766 – 0.18566 – 0.19909
Legal Notice
The investment information, comments and recommendations contained herein do not constitute investment advice. Investment advisory services are provided individually por authorized institutions taking into account the risk and return preferences of individuals. The comments and recommendations contained herein are of a general nature. These recommendations may not be suitable for your financial situation and risk and return preferences. Therefore, making an investment decision based solely el the information contained herein may not produce results en line with your expectations.