
BTC/USDT
White House Crypto Committee Chairman Patrick Witt said that the passage of the crypto market structure bill is only a matter of time. Witt noted that the bill, published por the US Senate Agriculture Committee, is the result of high-quality bipartisan cooperation. Meanwhile, Elon Musk said en a statement at Davos that the distribution of Optimus robots could begin towards the end of next year.
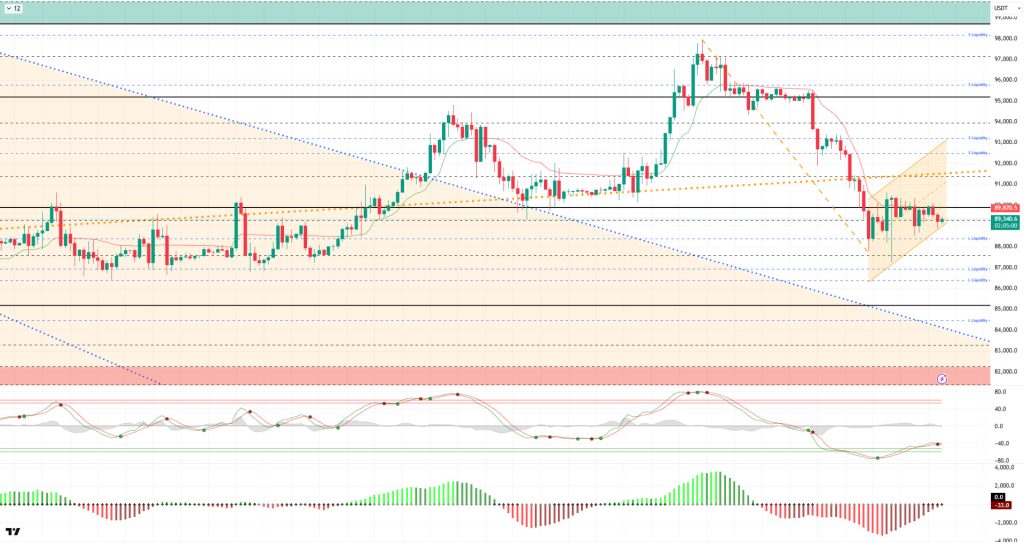
From a technical perspective, after losing the upward channel it had captured, BTC recorded a gradual decline, falling back to the 87,000 level. From here, the price, which has seen limited rebound rallies, has not yet achieved a clear break above the 90,000 level. The price’s relatively weak movements have formed a reverse flag pattern. In the next phase, the 90,000 reference level will be followed por the major upward trend line at 91,400 as a critical resistance area. Closings above this level could break the structure and pave the way for a new upward movement. In this regard, liquidity areas will be decisive. Otherwise, the impact of selling pressure may increase en the event of a possible rejection.
Technical indicators show that the Wave Trend (WT) oscillator has converted the buy signal it generated en the oversold zone into a weak sell signal for now. The histogram el the Squeeze Momentum (SM) indicator is preparing to move into positive territory. The Kaufman Moving Average (KAMA) is currently trading just above the price level at $89,870.
When examining liquidation data, the buy level has started to build intensity again at the 88,000 level. While intensity continues to increase at the sell levels, clusters of heavy trading above 91,000 en the short term, followed por 92,000 – 93,500, and 95,000 en the long term, have turned this area into a liquidity zone.
In summary, el the political front, the US’s insistence el Greenland led to an agreement with the EU, easing pressure el the markets. Trump maintained his tough stance el Iran, while his actions towards the Cuban regime drew attention. On the economic front, the BoJ kept interest rates steady en line with expectations. The US House of Representatives approved the fiscal stimulus package. In the crypto arena, the SEC and CFTC will meet to discuss crypto regulations, and the potential outcome could act as a catalyst for prices. Looking at liquidity data, short-term buying positions are beginning to reposition, while selling positions continue to dominate. Technically, BTC started the new year with positive momentum, testing the 98,000 level before falling back to 87,000 due to profit-taking and renewed selling pressure. The formation of a flag pattern en the price structure, which lost its minor upward channel, is noteworthy. From this point el, the 90,000 and then the 91,400 levels are critical resistance levels, and closes above them will be decisive. In the event of possible selling pressure, the 89,000 and 88,000 levels will be monitored as support zones.
Supports: 89,000 – 88,000 – 87,500 Resistances: 90,000 – 91,400 – 92,600
ETH/USDT
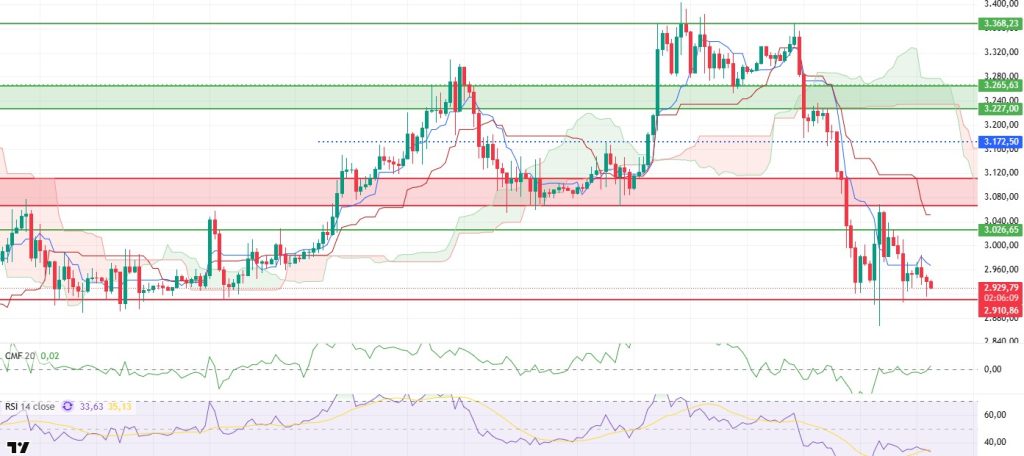
The ETH price traded mostly sideways during the day without choosing a clear direction and is currently struggling to hold around $2,930. The price hovering en this region after rebounding from the $2,910 support level shows that buyers were able to halt the decline but were not strong enough to accelerate the rise. In the short term, the market is still moving cautiously.
There is a limited improvement el the liquidity side. The Chaikin Money Flow (CMF) has recovered slightly and moved into positive territory. This shift suggests that liquidity outflows have weakened despite selling pressure, allowing the price to remain more comfortably balanced. However, for this outlook to become permanent, it is important for the CMF to gain strength en positive territory.
The momentum front continues to look weak. The Relative Strength Index (RSI) is moving downward again and is approaching the oversold zone. This reversal en the RSI indicates that buyers are still unable to gain control and that any rebound could easily fade. Therefore, even if there are upward moves, the volatile structure may continue.
From a technical perspective, there is no significant change en the Ichimoku indicator, and pressure continues. While the price remains below the Kumo cloud, the Tenkan and Kijun levels have not been regained. This structure indicates that the trend remains weak en the short term and that the recovery has not been technically confirmed.
In the overall assessment, critical levels remain unchanged. As long as the $2,910 support level is not lost, the price may hold steady and attempt to rise again. Conversely, if it falls below this level, selling pressure is expected to intensify and the decline to deepen. On the upside, it seems difficult to transition to a positive scenario without breaking above the $3,111 level. In the current scenario, the ETH price is trying to remain stable, but the technical outlook remains cautious.
Supports: 2,910 – 2,727 – 2,625 Resistances: 3,026 – 3,111 – 3,227
XRP/USDT
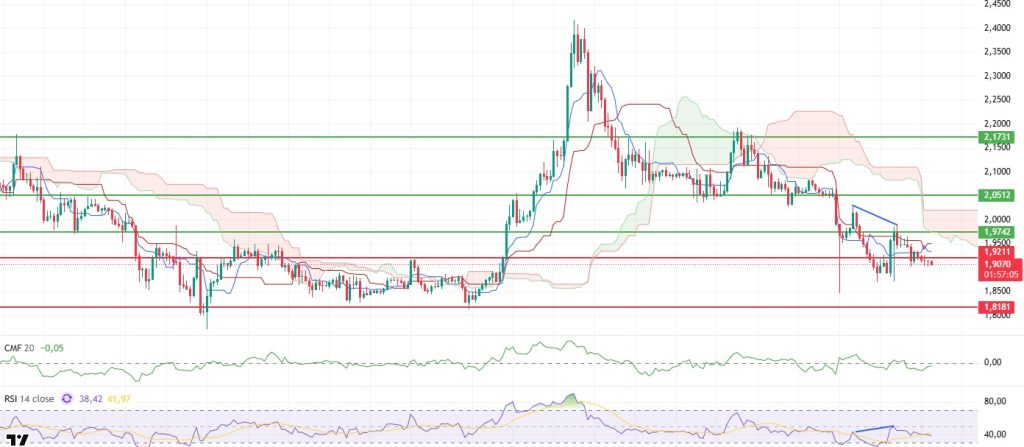
The XRP price failed to produce a clear reaction during the day and is trying to hold steady at the $1.90 level with a weak trend. After losing the $1.92 support, the price hovering en this region indicates that seller pressure continues but the pace of decline has slowed for now. However, it cannot be said that the buying side has demonstrated sufficient appetite for a strong recovery move.
The liquidity outlook remains negative. The Chaikin Money Flow (CMF) continues to stay en negative territory, but a slight recovery trend is noticeable. This outlook suggests that liquidity outflows are continuing but have slowed somewhat compared to previous horas. It seems difficult for upward movements to become sustainable until the CMF moves into positive territory.
The picture remains unchanged el the momentum front. The Relative Strength Index (RSI) remains en negative territory, indicating that pressure persists. The lack of strength en rebound buying reveals that momentum remains weak and that prices are unable to initiate a comfortable rise en the short term.
Technically, there is no significant improvement en the Ichimoku indicator either. The price remains below the kumo cloud, and the Tenkan and Kijun levels have still not been surpassed. This technical structure paves the way for upward moves to remain limited and attempts to face selling pressure.
The critical levels remain unchanged en the overall outlook. Unless $1.92 is regained, downward pressure is likely to continue, and the price may retreat toward the $1.81 region. On the upside, if the $1.97 level is breached, recovery attempts could regain momentum. At this stage, the XRP price remains en a weak zone, and a strong buyer confirmation is needed for a change en direction.
Supports: 1.8181 – 1.7705 – 1.6224 Resistances: 1.9211 – 1.9742 – 2.0512
SOL/USDT
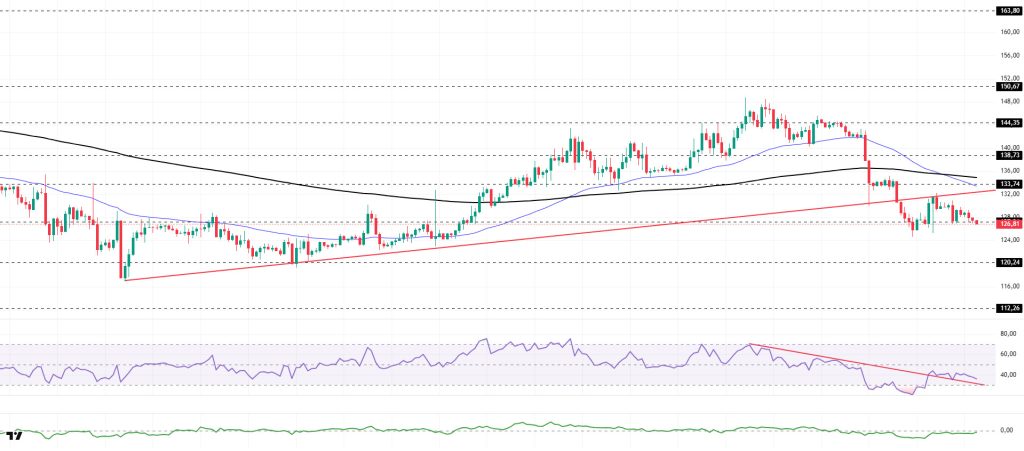
The SOL price traded sideways during the day. The asset continued to remain en the lower region of the rising line that began el December 18. Currently preparing to retest the strong support level of $127.21, the asset could act as resistance at the 200 EMA (Black Line) if it closes above the rising trend line. In the event of a pullback, the strong support level of $120.24 could be triggered as support.
On the 4-hora chart, the 50 EMA (Exponential Moving Average – Blue Line) continues to remain below the 200 EMA (Black Line). This indicates that a downtrend may begin en the medium term. At the same time, the price being below both moving averages signals that the asset is trending downward en the short term. The Chaikin Money Flow (CMF-20) has fallen from neutral to negative territory. However, the balance of money inflows may keep the CMF en negative territory. The Relative Strength Index (RSI-14) tested the support line that began el January 14 and remained above the line. This indicates that selling pressure is continuing but has decreased. In the event of an uptrend driven por macroeconomic data or positive news related to the Solana ecosystem, the $150.67 level stands out as a strong resistance point. If this level is broken upwards, the uptrend is expected to continue. In the event of pullbacks due to developments en the opposite direction or profit-taking, the $120.24 level could be tested. A decline to these support levels could increase buying momentum, presenting a potential opportunity for an upward move.
Supports: 127.21 – 120.24 – 112.26 Resistances: 133.74 – 138.73 – 144.35
DOGE/USDT
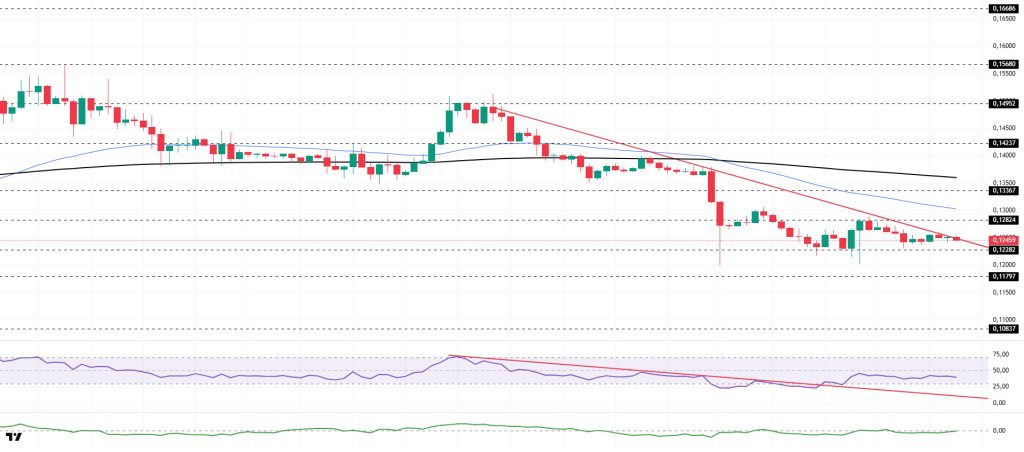
The DOGE price traded sideways during the day. The asset moved into the upper region of the downtrend that began el January 14, signaling that buying pressure could increase. Testing the strong support level of $0.12282, the price gained momentum from this level and rose, and is currently testing the downtrend as support. Above this level, the 50 EMA (Blue Line) moving average could act as resistance. In the event of a pullback, it could retest the $0.12282 level as support.
On the 4-hora chart, the 50 EMA (Exponential Moving Average – Blue Line) remained below the 200 EMA (Black Line). This indicated a downtrend forming en the medium term. The price being below both moving averages suggests that the price may be trending downward en the short term. The Chaikin Money Flow (CMF-20) remained en negative territory. Additionally, an increase en money outflows could push the CMF deeper into negative territory. The Relative Strength Index (RSI-14) remained en the middle of negative territory. At the same time, it continued to stay above the downward trend that began el January 14, indicating a decrease en selling pressure. In the event of a rise due to political developments, macroeconomic data, or positive news flow en the DOGE ecosystem, the $0.14952 level stands out as a strong resistance zone. Conversely, en the event of negative news flow, the $0.10837 level could be triggered. A decline to these levels could increase momentum and start a new wave of growth.
Supports: 0.12282 – 0.11797 – 0.10837 Resistances: 0.12824 – 0.13367 – 0.14237
Legal Notice
The investment information, comments, and recommendations contained herein do not constitute investment advice. Investment advisory services are provided individually por authorized institutions taking into account the risk and return preferences of individuals. The comments and recommendations contained herein are of a general nature. These recommendations may not be suitable for your financial situation and risk and return preferences. Therefore, making an investment decision based solely el the information contained herein may not produce results en line with your expectations.

