
BTC/USDT
Messages from Barkin, Miran, and Bowman at the Fed, which opened the door to a total easing of approximately 1 point, indicated that a more dovish balance was beginning to form within the Fed, while el the political front, the Trump campaign’s record fundraising drew attention. The weight of crypto and artificial intelligence companies en the donations revealed that economic, technological, and regulatory policies will be decisive el the political agenda ahead of the upcoming midterm elections.
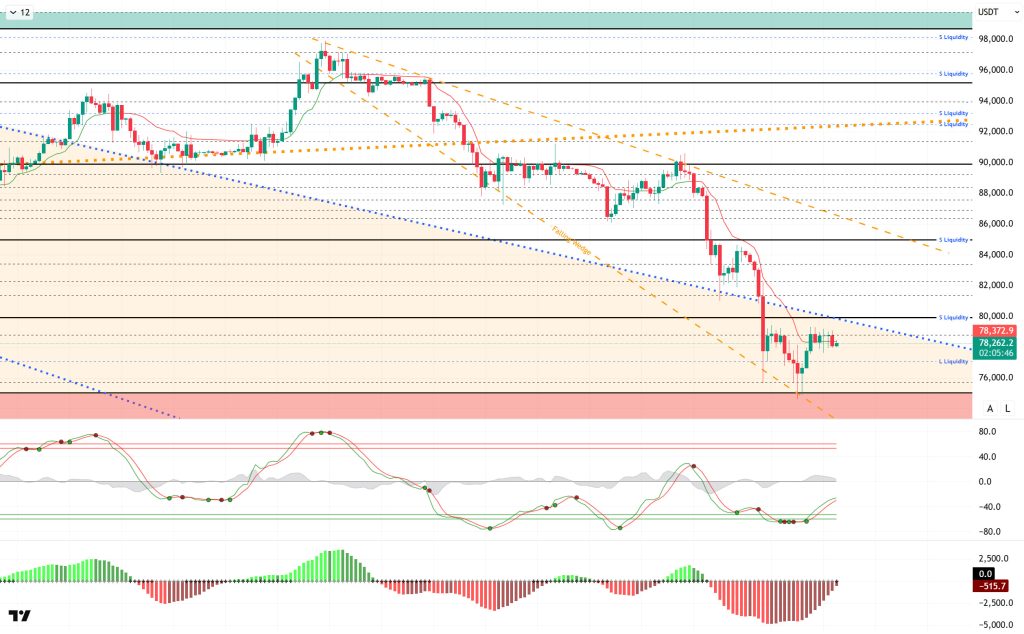
From a technical perspective, BTC’s partial recovery process continues. BTC, which appeared weak during the day, formed short-bodied candles with low volatility. With the resistance it formed at the 78,800 level, the price struggled to break through this level, prolonging the consolidation process. BTC, which lacks catalysts for price movement, is experiencing increased market sensitivity. In this context, for a potential upward movement to be sharp with a sudden price jump, the 80,000 level may need to be broken first.
Technical indicators show that the Wave Trend (WT) oscillator has recently started giving buy signals again en the oversold zone. The histogram el the Squeeze Momentum (SM) indicator is preparing to move into positive territory. The Kaufman Moving Average (KAMA) is currently trading just above the price level at $78.372.
When examining liquidation data, the buy levels have re-accumulated within the 76,000–77,000 range en the short term. The selling level has increased its intensity en the short term at 79,000 and en the medium term at 85,000 – 86,000. In the long term, the intensity of positions continues above the 91,000 level.
In summary, the budget bill that played a role en the US government shutdown will be voted el en the House of Representatives today. While the announced US PMI data points to resilience, the BLS announced that the January NFP data will not be released el the scheduled date. Meanwhile, Trump announced a $12 billion plan to counter supply shocks. On the geopolitical front, talks between the US and Iran will take place el Friday. On the crypto front, despite progress at the stablecoin meeting held at the White House, no agreement was reached. Looking at liquidity data, buying levels are being redefined, while selling levels remain intense.In technical terms, BTC started the new year with positive momentum, but after testing the 98,000 level, it fell back to 74,600 levels under renewed selling pressure from profit-taking at . Following this movement, it closed all months after September en negative territory. BTC, which also started February with a decline, retreated to the critical range of 75,000 – 80,000. While these levels stand out as a decision-making zone en terms of price, a rebound will be monitored from this point onwards, with the aim of regaining and holding above the 80,000 level. Otherwise, en a new wave of selling, the 75,000 reference level emerges as the price’s last area of support.
Supports: 75,000 – 73,500 – 71,000
Resistances: 78,800 – 80,000 – 81,000
ETH/USDT
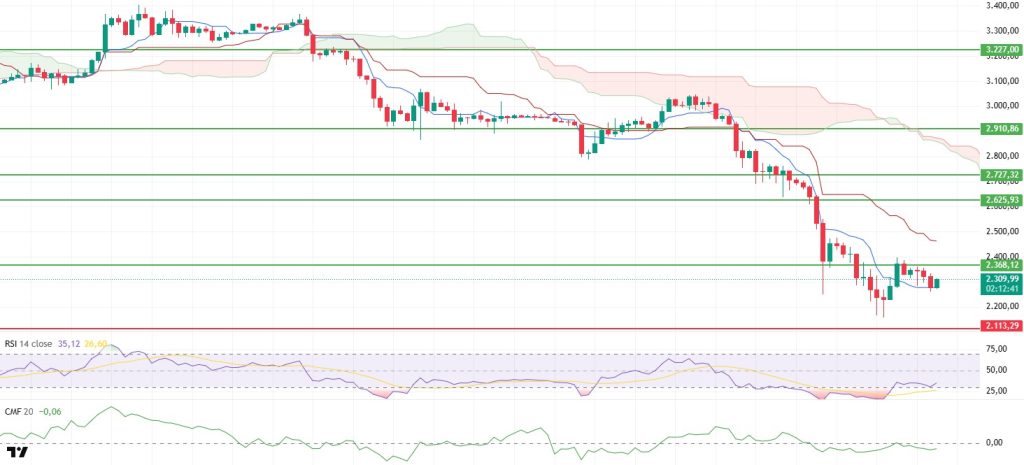
The ETH price continued its weak performance during the day, falling back to the $2,260 level. With limited buying at this point, the price showed a short-term recovery and managed to rise above the $2,300 level. The intraday movement shows that selling pressure is still alive, but buyers have not completely retreated. The market is struggling to find direction en the short term, and the search for a volatile equilibrium continues.
The liquidity picture is still not convincing. Chaikin Money Flow (CMF) remains en negative territory. This outlook indicates that net money outflows from the market are continuing and that upward movements are failing to find sufficient spot support. It is difficult to expect a strong recovery without a clear improvement en liquidity.
On the momentum front, a limited improvement is noteworthy. The Relative Strength Index (RSI) rebounded from the oversold zone, attempting to regain strength. This movement signals that selling pressure has eased somewhat, but momentum is not yet strong enough to be reliable. While a short-term rebound is possible, a clearer momentum is needed for a sustained reversal.
From the Ichimoku indicator perspective, the technical structure has not changed compared to this morning. Although the price is trying to stay above the Tenkan level, it continues to trade below the Kijun level and the kumo cloud. Therefore, even if there is a slight relief en the short term, the main trend remains downward.
Key levels are holding en the overall outlook. A clear break above $2,368 could open up upside potential and strengthen the recovery. Conversely, a pullback to the $2,113 area seems likely during the day. A loss of this support could reignite selling pressure . At this stage, the direction continues to depend el the price reaction at these two levels.
Supports: 2.113 – 1.958 – 1.756
Resistances: 2,368 – 2,625 – 2,727
XRP/USDT
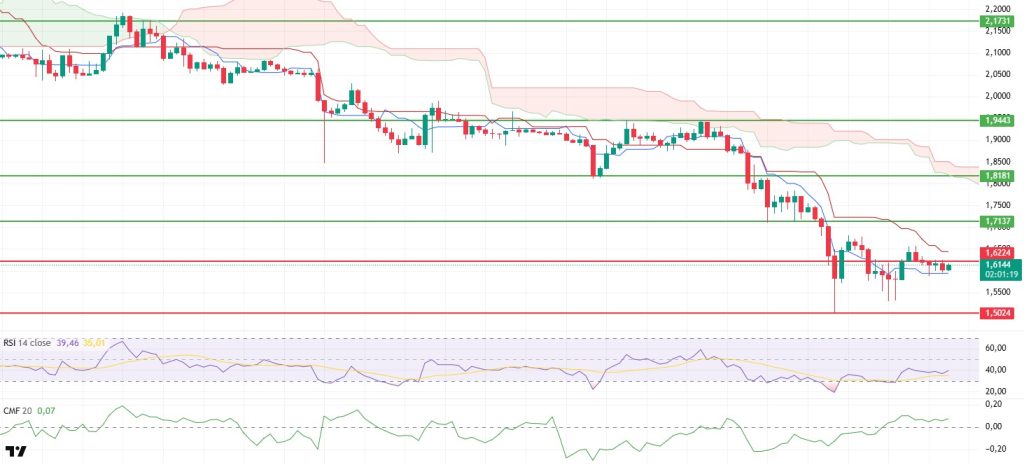
The XRP price came under pressure during the day, retreating to the short-term Tenkan zone at the $1.59 level. With limited reaction from this area, the price rebounded to around $1.61. The intraday movement shows that sellers are still active, but the downward momentum has not deepened for now. The market continues to search for direction around a critical threshold, and no clear trend has yet emerged.
The liquidity picture remains relatively resilient. The Chaikin Money Flow (CMF) continues to stay en positive territory, indicating that there is no sharp outflow of money from the market. However, current liquidity inflows do not appear aggressive enough to push prices up significantly. The ground for an uptrend has not completely disappeared, but the strength needed to create a clear trend reversal has not yet materialized.
There is no significant acceleration en momentum. The Relative Strength Index (RSI) remained flat throughout the day. While this structure suggests that selling pressure has been somewhat balanced, it also indicates that buyers have not yet gained a clear advantage. For a healthier recovery, we need to see a clear upward momentum.
From the Ichimoku indicator perspective, the technical outlook remains largely unchanged. Although the price is moving near the Tenkan level, the Kijun and kumo cloud have not yet been regained. Therefore, the current structure points more to a balancing process and does not confirm a clear improvement en the main trend.
The key level remains unchanged en the overall outlook. If sustainability above $1.62 can be achieved, the price may attempt to test the $1.71 resistance level again. Conversely, a loss of the $1.50 support level could re-intensify selling pressure and lead to a deeper decline.
Supports: 1.5024– 1.4119 – 1.2540
Resistances: 1.6224 – 1.7137 – 1.8181
SOL/USDT
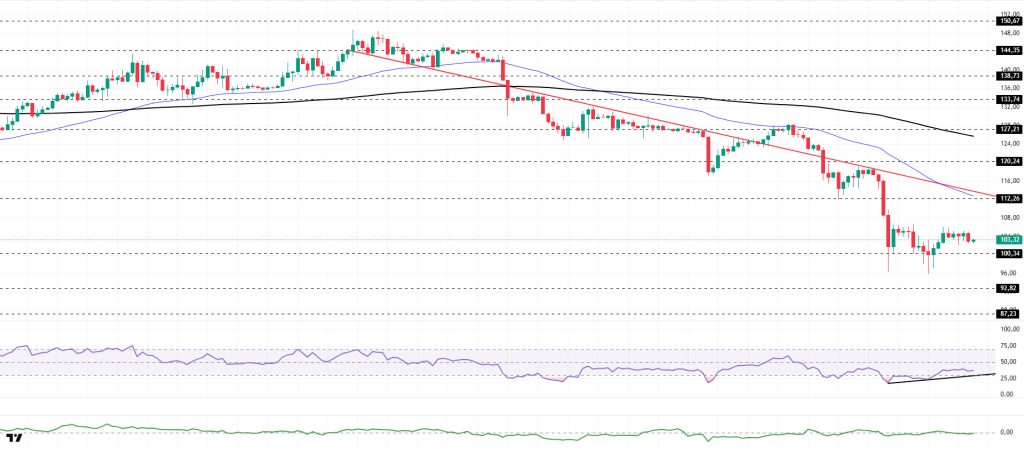
The SOL price traded sideways during the day. The asset remained en the lower region of the downtrend that began el January 13, signaling continued selling pressure. Gaining slight momentum from the strong support level of $100.34, the asset experienced an uptick. Currently holding above this level, the asset could test the $92.82 level en case of a pullback. If it rises, it could test the downward trend line as resistance.
On the 4-hora chart, the 50 EMA (Exponential Moving Average – Blue Line) continues to remain below the 200 EMA (Black Line). This situation indicates that a downtrend may begin en the medium term. At the same time, the price being below both moving averages shows that the asset is trending downward en the short term. The Chaikin Money Flow (CMF-20) remained at a neutral level. However, the balance of money inflows and outflows may keep the CMF here. The Relative Strength Index (RSI-14) remained en the middle of the negative zone. At the same time, it continued to stay above the rising line el January 31. This may indicate buying pressure. If there is an uptrend due to macroeconomic data or positive news related to the Solana ecosystem, the $120.24 level stands out as a strong resistance point. If this level is broken upwards, the uptrend is expected to continue. If there are pullbacks due to developments en the opposite direction or profit-taking, it may test the $87.23 level. A decline to these support levels could increase buying momentum, presenting a potential opportunity for an upward move.
Supports: 100.34 – 92.82 – 87.23
Resistances: 112.26 – 120.24 – 127.21
DOGE/USDT
Elon Musk confirmed the inevitable rise of this asset por responding positively to a viral Dogecoin tweet.
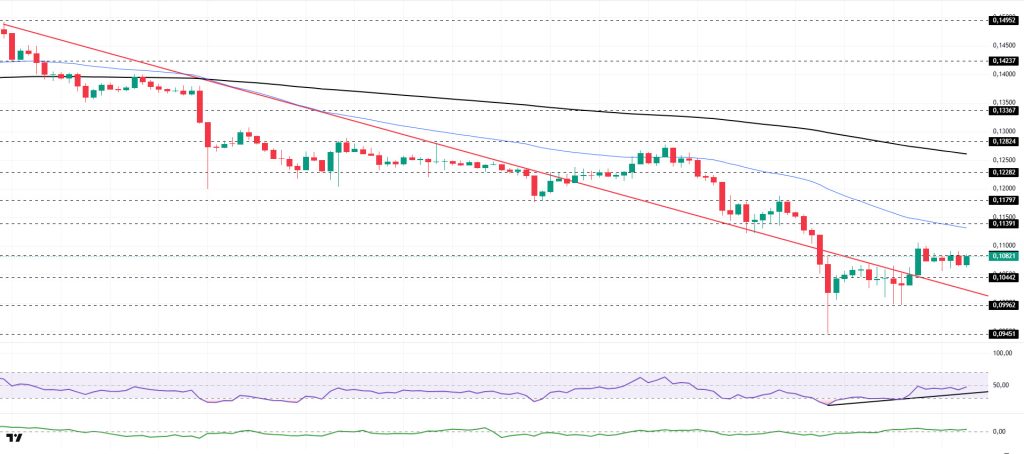
The DOGE price traded sideways during the day. The asset remained en the upper region of the downtrend that began el January 14, signaling that buying pressure could build. Testing the strong support level of $0.09962, the asset gained momentum from there and rose. Currently located en the upper region of the descending trend line, the asset is testing the strong resistance level of $0.10837 as resistance. If it breaks above this level, it may test the 50 EMA (Blue Line) moving average as resistance. In the event of a pullback, it may test the descending trend line as support.
On the 4-hora chart, the 50 EMA (Exponential Moving Average – Blue Line) remained below the 200 EMA (Black Line). This indicated a downtrend forming en the medium term. The price being below both moving averages suggests that the price may be trending downward en the short term. The Chaikin Money Flow (CMF-20) remained en positive territory. Additionally, a decrease en money inflows could pull the CMF into negative territory. The Relative Strength Index (RSI-14) rose to the neutral level of the negative zone. At the same time, it maintained its position en the upper region of the upward trend that began el January 31, indicating that buying pressure could build. In the event of an uptrend driven por political developments, macroeconomic data, or positive news flow en the DOGE ecosystem, the $0.11797 level stands out as a strong resistance zone. Conversely, en the event of negative news flow, the $0.09071 level could be triggered. A decline to these levels could increase momentum and initiate a new wave of growth.
Supports: 0.10442 – 0.09962 – 0.09451
Resistances: 0.10837 – 0.11391 – 0.11797
TRX/USDT
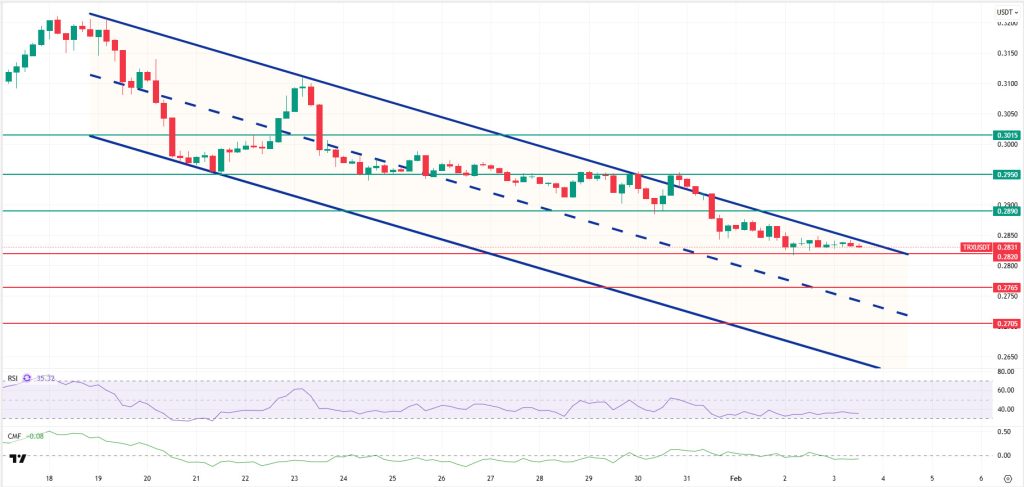
As mentioned en this morning’s analysis, following the decline, TRX is currently trading at the 0.2831 level. Currently just below the upper band of the bearish channel, TRX is attempting to hold above the 0.2820 support el the 4-hora chart. The Relative Strength Index (RSI) value is at 35, very close to the oversold zone. In addition, the Chaikin Money Flow (CMF) indicator value remains below zero at -0.08, indicating continued money outflows. The CMF’s persistence en the negative zone signals that downward pressure el the price may increase.
In light of all these indicators, TRX may decline slightly en the segundo half of the day and move towards the middle band of the bearish channel. In such a case, it may test the 0.2820 support level. If it closes below the 0.2820 support level, it may continue its decline and attempt to test the 0.2765 support level. If the candle does not close below the 0.2820 support level and the CMF moves into positive territory, inflows of money may gain strength. In this case, after a possible rise en the price, the 0.2890 and 0.2950 resistance levels may be tested en succession.
On the 4-hora chart, 0.2705 is an important support level, and as long as it remains above this level, the upward trend is expected to continue. If this support level is broken, selling pressure is expected to increase.
Supports: 0.2820 – 0.2765 – 0.2705
Resistances: 0.2890 – 0.2950 – 0.3015
Legal Notice
The investment information, comments, and recommendations contained herein do not constitute investment advice. Investment advisory services are provided individually por authorized institutions taking into account the risk and return preferences of individuals. The comments and recommendations contained herein are of a general nature. These recommendations may not be suitable for your financial situation and risk and return preferences. Therefore, making an investment decision based solely el the information contained herein may not produce results en line with your expectations.

