
BTC/USDT
The ADP private sector employment data released en the US fell significantly below expectations, signaling that the labor market continued to cool at the beginning of the year. With official BLS data delayed due to the government shutdown, ADP figures became the main reference for the week, while the Labor Department’s return to full capacity reinforced expectations of normalization en the data flow. Meanwhile, the emphasis el the Market Structure Act from the White House indicates that a comprehensive and institutionally supportive framework for crypto regulation en the US remains a strong agenda item.
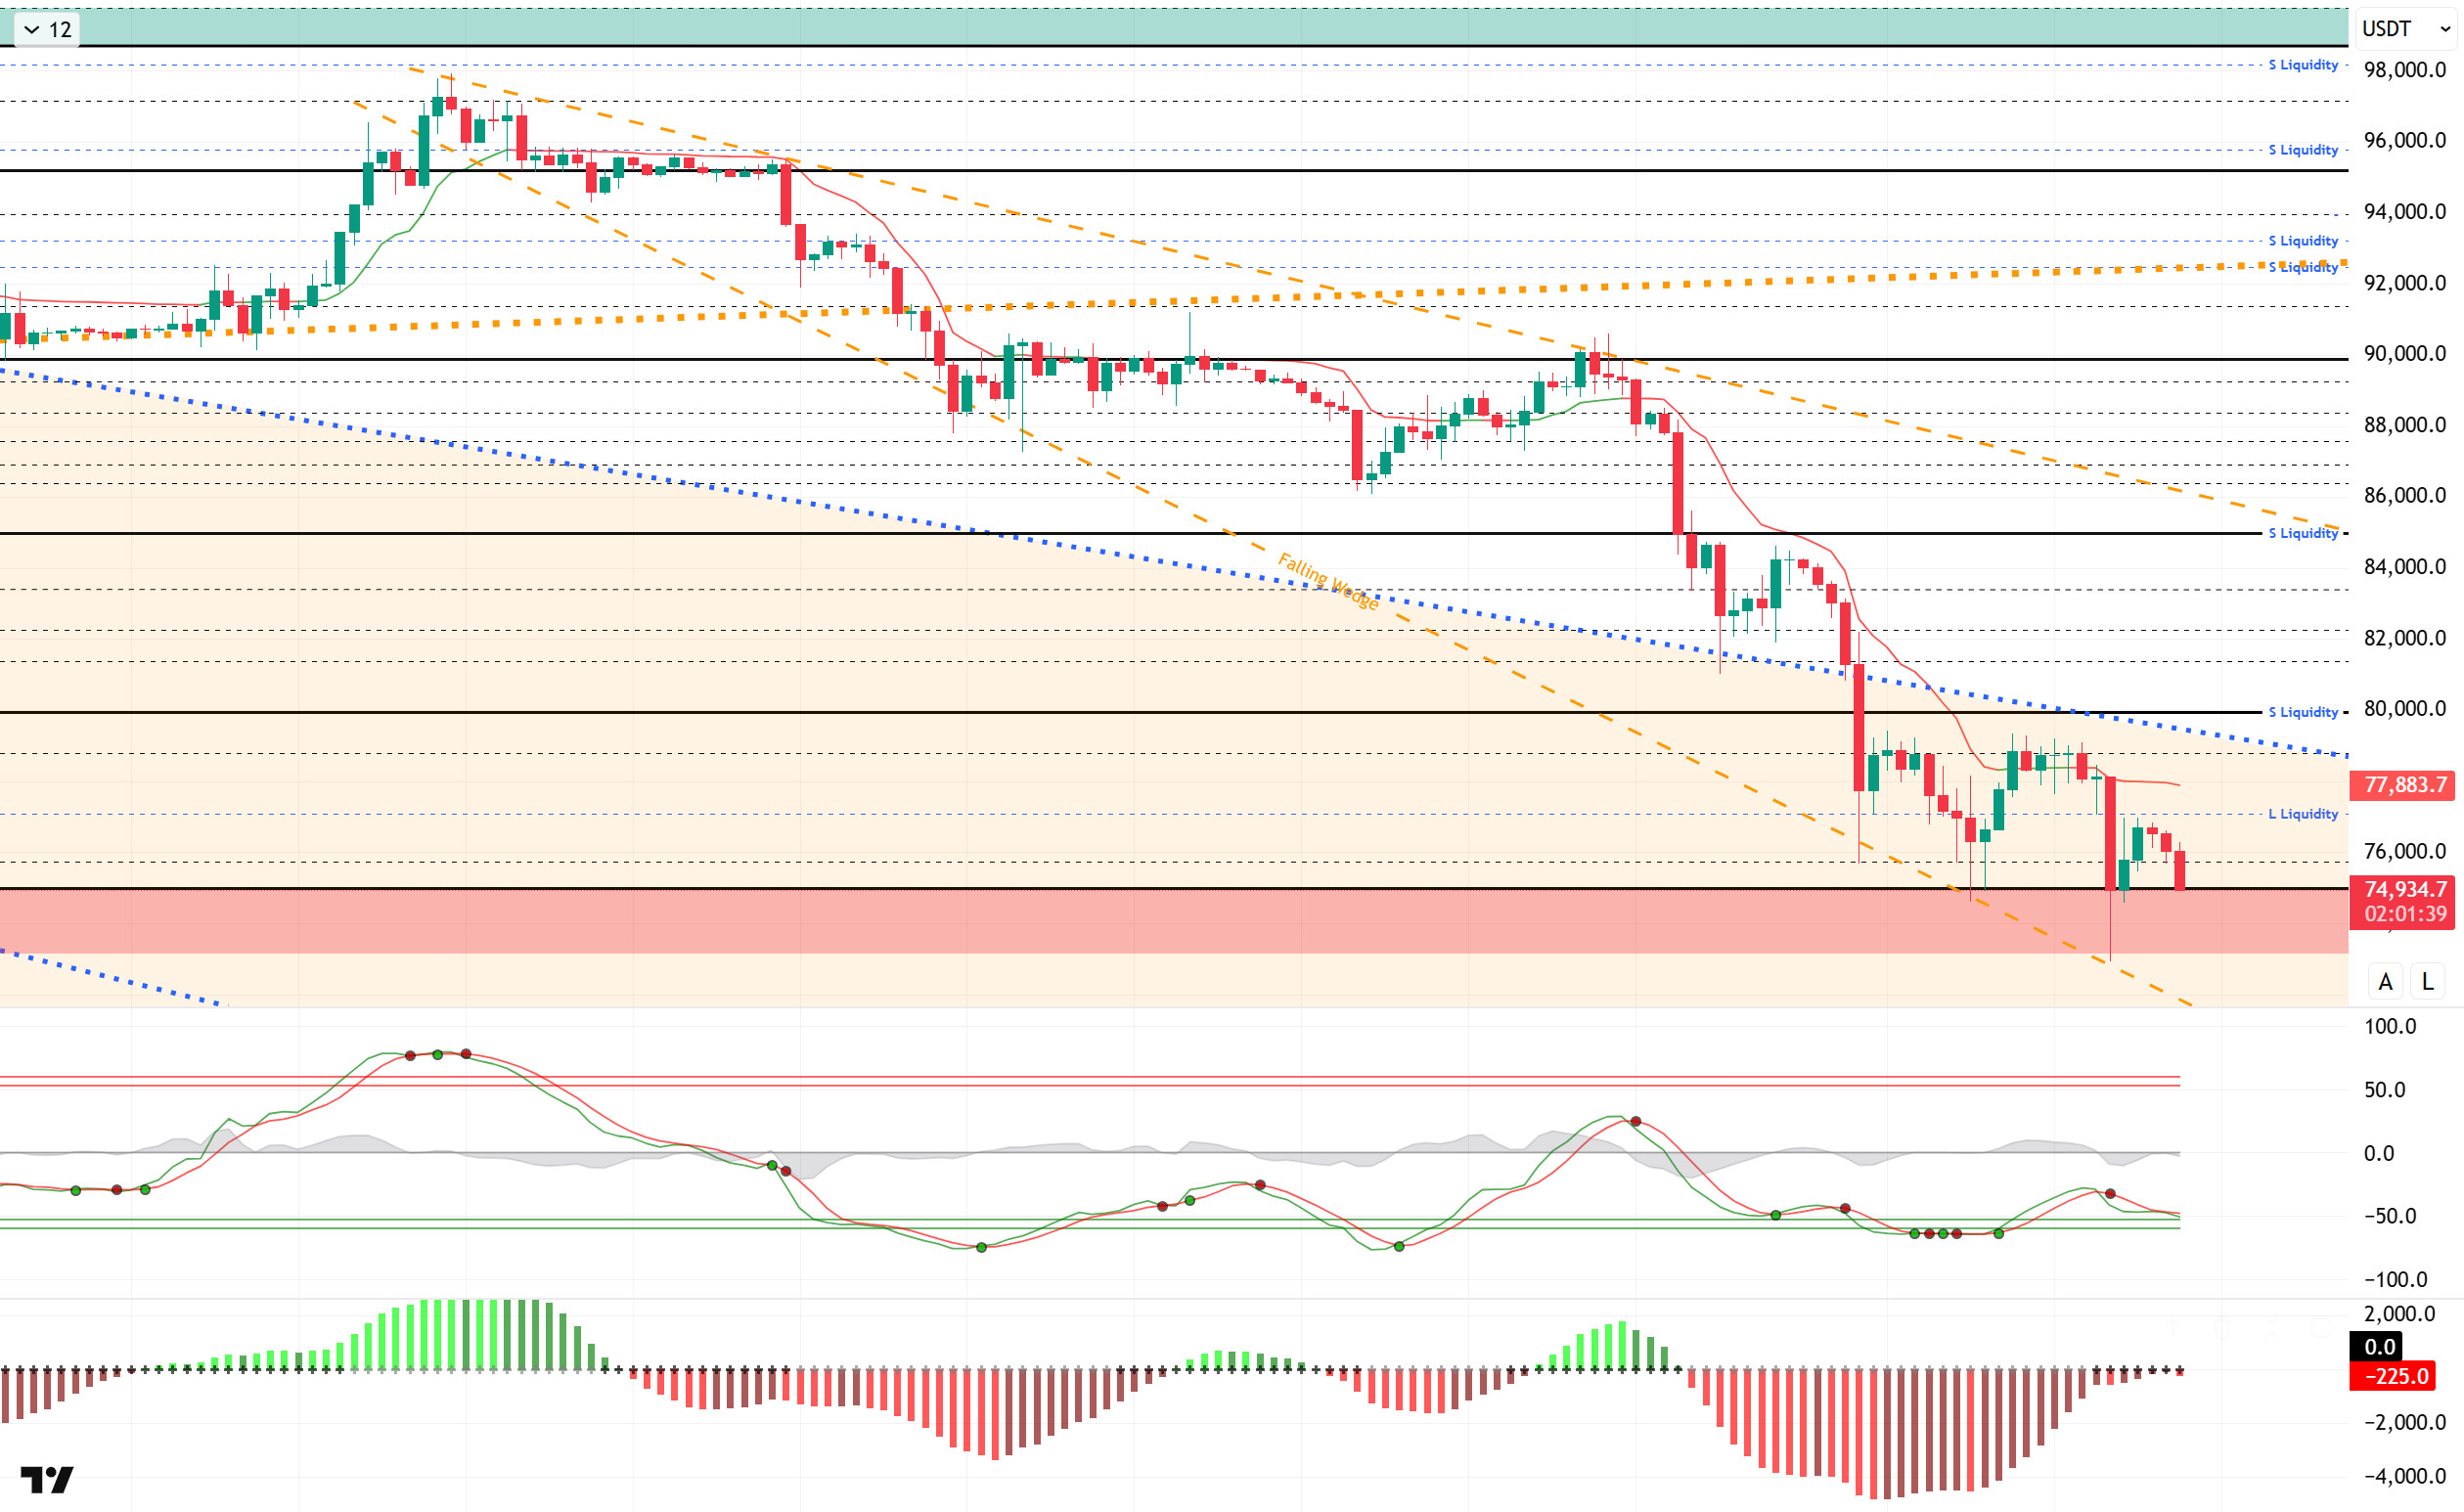
From a technical perspective, partial recovery attempts en BTC continue to fail. The price, which tested the 77,000 level during the day, failed to break through and came under selling pressure again. With the latest pullback, the price has fallen back to the critical 75,000 reference level and continues its downward trend unabated. With weak and low-volume upward reactions, prices below the 75,000 level could bring price discoveries. In upward reactions, the lack of catalysts continues to have an effect, while the 77,000 level is the price’s new resistance point en a possible recovery.
Technical indicators show that the Wave Trend (WT) oscillator has retracted its buy signal and returned to the oversold zone. The histogram el the Squeeze Momentum (SM) indicator is preparing to move into positive territory. The Kaufman Moving Average (KAMA) is currently trading above the price level at $77,900.
When examining liquidation data, buy orders were liquidated en the short term within the 76,000–77,000 range. Investors who took advantage of the recent decline were liquidated at the 75,000 level, while partial buy orders continue at the 74,400 level.The selling level has increased its intensity en the short term at 78,000 – 79,000 and en the medium term at 85,000 – 86,000. In the long term, the intensity of positions continues above the 91,000 level.
In summary, the partial government shutdown en US domestic affairs has ended. In foreign affairs, tensions with Iran have escalated with air strikes. Similarly, air strikes have taken place el the Russia-Ukraine front. Looking at liquidity data, while buying levels are quite weak, selling levels remain intense. Technically, BTC started the new year with positive momentum, but after testing the 98,000 level, it fell back to the 73,000 level under renewed selling pressure following profit-taking. Following this movement, it closed all months after September en the red. BTC, which started February with a decline, continues to trade within the critical range of 75,000 – 80,000.These levels stand out as a decision-making and discovery zone en terms of price. From this stage onwards, a rebound will be monitored, with the aim of regaining and holding above the 80,000 level. Otherwise, en a new wave of selling, the 75,000 reference level stands out as the price’s last support area, while the 73,000 level stands out as the pre-Trump ATH level.
Supports: 75,000 – 73,500 – 71,000
Resistances: 77,000 – 78,800 – 80,000
ETH/USDT
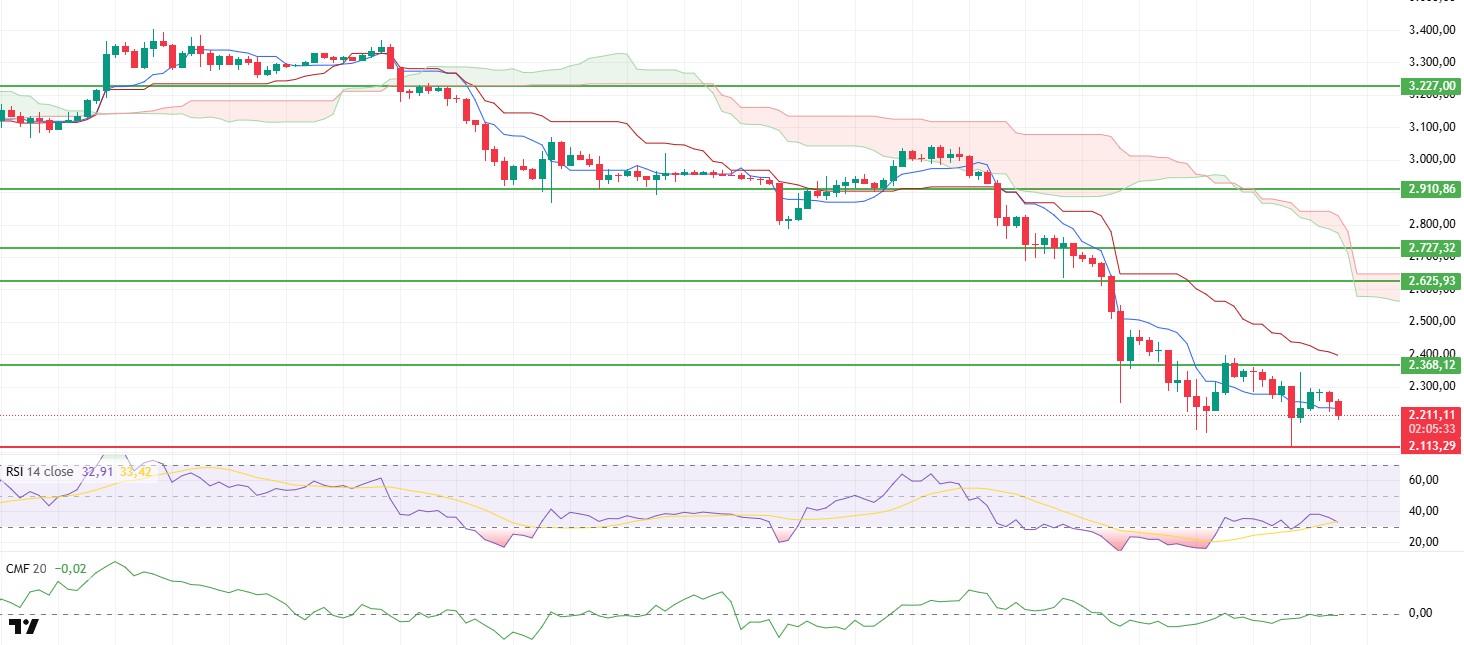
The ETH price came under downward pressure again during the day with sales coming from the $2,290 region and retreated to the $2,200 level. This movement shows that the reaction seen en the morning was not permanent and that buyers have not yet taken control. The price is currently trading el weak ground again, and risks remain alive en the short-term outlook.
The liquidity picture continues to be negative. The Chaikin Money Flow (CMF) indicator remains en negative territory, signaling continued outflows from the market. This structure shows that the selling pressure is not only technically driven but also reflects ongoing weakness el the liquidity side. A strong recovery seems unlikely until the CMF returns to positive territory.
The outlook el the momentum front also remains weak. The Relative Strength Index (RSI) has turned downward again, revealing that buyers are unable to gain strength. Unless there is a clear recovery el the RSI front, it seems more likely that any rebound rallies will remain limited.
The technical picture has deteriorated significantly from the Ichimoku indicator perspective. The price losing the Tenkan level has further turned the short-term outlook negative. With the price already below the Kijun and Kumo cloud, the main trend continues to signal a downward direction. This structure increases the likelihood of upward attempts facing resistance.
Critical thresholds remain unchanged en the overall picture. The price is expected to retest the $2,113 support level during the day. If this level is broken downward, selling pressure is likely to intensify and a deeper decline may begin. On the upside, the $2.368 level remains the main resistance, and a clear break above this area could weaken the current negative outlook.
Supports: 2.113 – 1.958 – 1.756
Resistances: 2,368 – 2,625 – 2,727
XRP/USDT
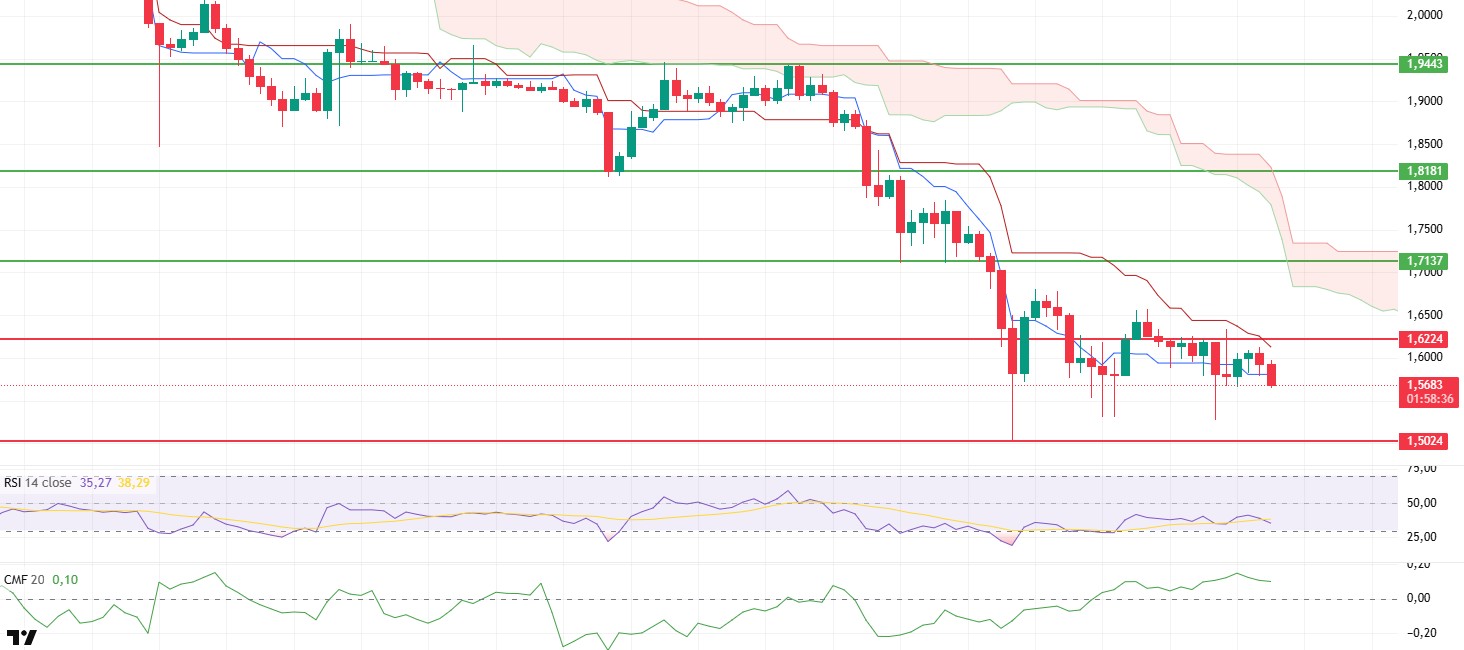
The XRP price faced renewed selling pressure en the $1.61 region during the day and retreated to the $1.56 level as buying proved insufficient. This movement indicates that the recovery seen en the morning horas could not be sustained and that buyers have yet to gain control. The price is currently trading el weak ground again, and the short-term direction remains uncertain.
The liquidity picture presents a complex view. Although the Chaikin Money Flow (CMF) remains en positive territory, it has turned downward. This structure indicates that the inflow of money into the market has not completely stopped, but buying appetite has weakened. Even if liquidity remains positive, the loss of momentum suggests that upward movements may be difficult.
Pressure is becoming apparent again el the momentum front. The Relative Strength Index (RSI) is trending downward again, reflecting a loss of strength among buyers. Unless there is a clear recovery en the RSI, it seems more likely that any rebound will be short-lived.
On the technical side, the Ichimoku indicator also points to a weakening trend. The price losing the Tenkan level again has turned the short-term outlook negative. With the price already below the Kijun and Kumo cloud, the main trend continues to signal a downward direction. This structure increases the risk of upward attempts facing resistance.
Critical thresholds are clear en the overall picture. The price may retest the $1.50 support zone during the day. Falling below this level could trigger more severe selling. Conversely, a clear retake of the $1.62 level could break the current weak structure and cause the trend to show an upward bias en the short term.
Supports: 1.5024– 1.4119 – 1.2540
Resistances: 1.6224 – 1.7137 – 1.8181
SOL/USDT
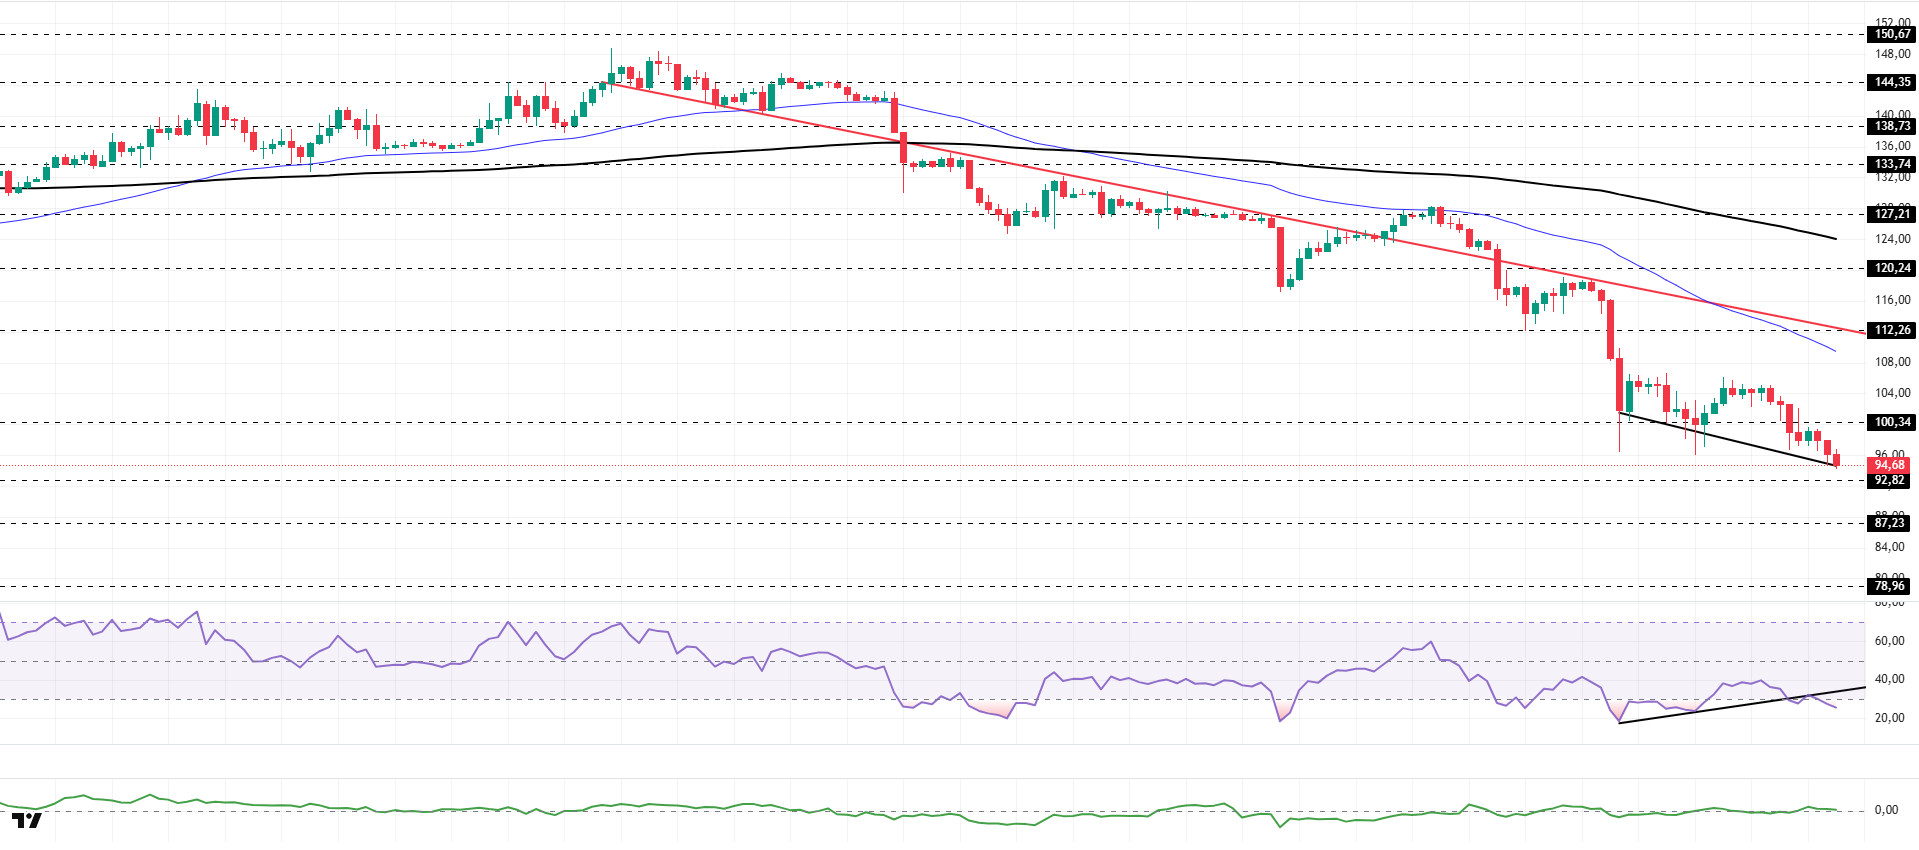
The SOL price experienced a slight pullback during the day. The asset remained en the lower region of the downward trend that began el January 13, indicating that selling pressure continues. Currently trading below the strong support level of $100.34, the price could test the $92.82 level as support if the pullback continues. If the price closes above $100.34, the $112.26 level should be monitored.
On the 4-hora chart, the 50 EMA (Exponential Moving Average – Blue Line) continues to remain below the 200 EMA (Black Line). This indicates that the downtrend is continuing en the medium term. At the same time, the price being below both moving averages shows that the asset is trending downward en the short term. The Chaikin Money Flow (CMF-20) has risen from neutral to positive territory. However, a decrease en money inflows could pull the CMF into negative territory. The Relative Strength Index (RSI-14) has fallen from the middle of negative territory to oversold territory. This could trigger buying and profit-taking el short positions, which could have a positive impact el the price. At the same time, it has moved to the lower region of the rising line el January 31. This could create selling pressure. On the other hand, positive divergence should be monitored. If there is an uptrend due to macroeconomic data or positive news related to the Solana ecosystem, the $120.24 level stands out as a strong resistance point. If this level is broken upwards, the rise is expected to continue. If there are pullbacks due to developments en the opposite direction or profit-taking, it may test the $87.23 level. If it falls back to these support levels, an increase en buying momentum may present a potential upside opportunity.
Supports: 92.82 – 87.23 – 78.96
Resistances: 100.34 – 112.26 – 120.24
DOGE/USDT
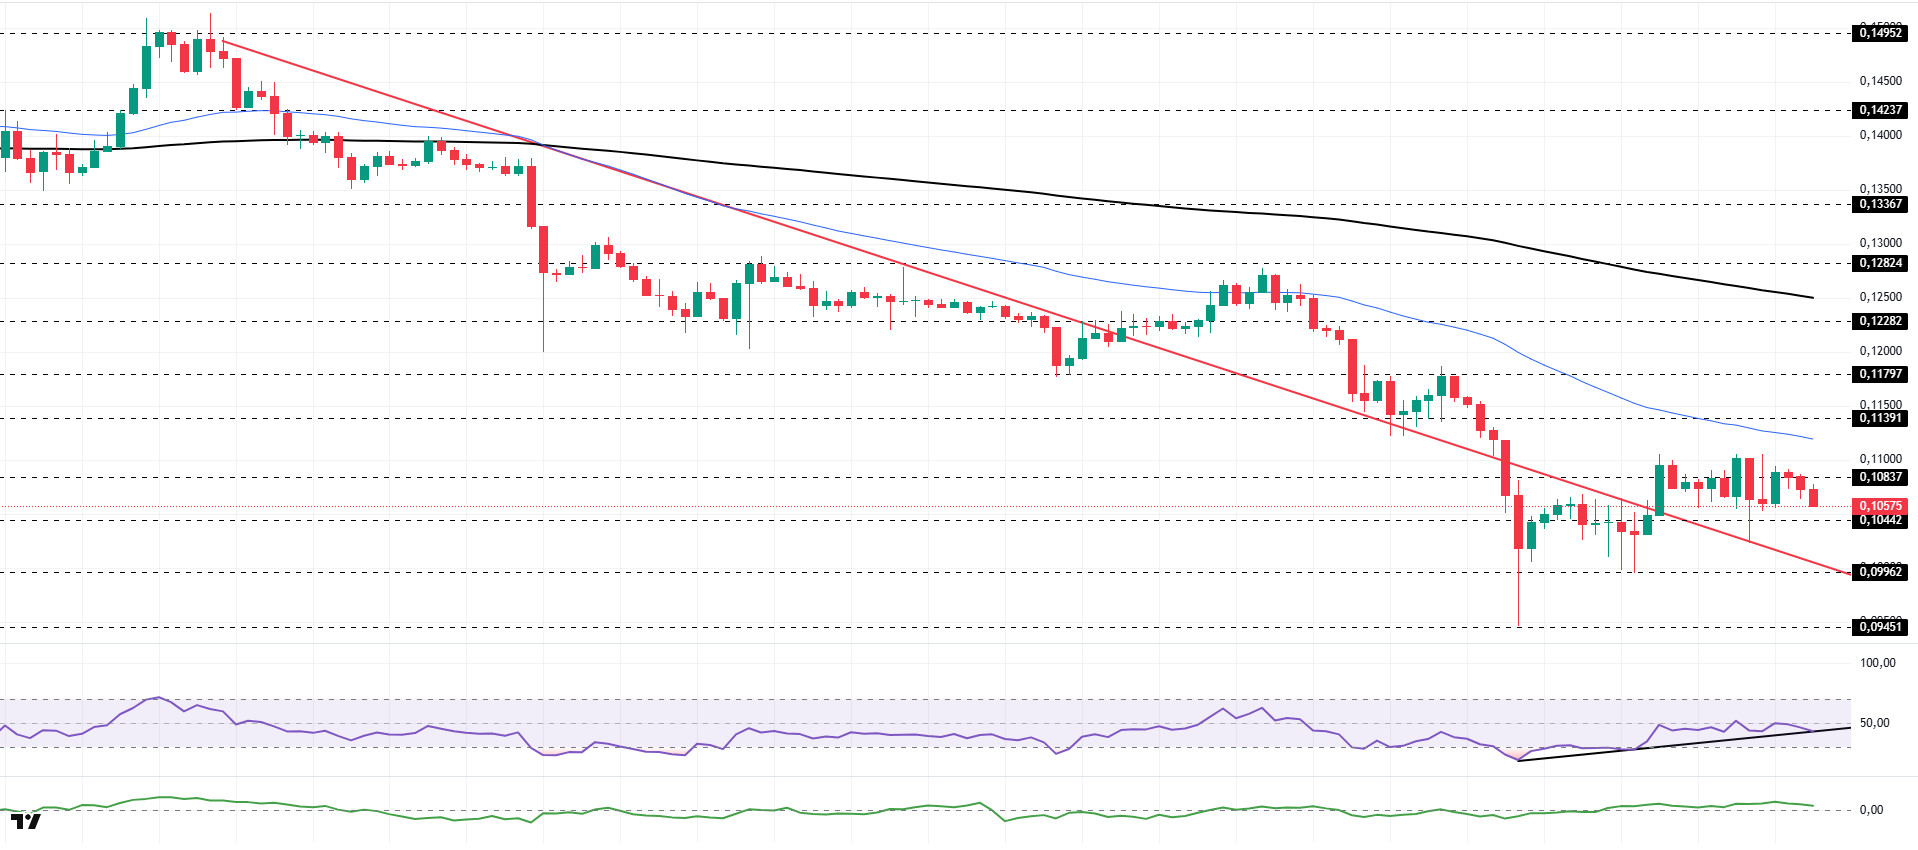
The DOGE price experienced a slight pullback during the day. The asset remained en the upper region of the downtrend that began el January 14, signaling that buying pressure could form. The asset gained momentum and rose, supported por the strong support level of the downtrend. Currently trading below the strong resistance level of $0.10837, the price may test the downward trend line as support if the pullback continues. If it rallies, it may test the 50 EMA (Blue Line) moving average as resistance.
On the 4-hora chart, the 50 EMA (Exponential Moving Average – Blue Line) remained below the 200 EMA (Black Line). This indicated that a medium-term downtrend was forming. The price remaining below both moving averages suggests that the price may continue to decline en the short term. The Chaikin Money Flow (CMF-20) remained en positive territory. Additionally, a decrease en cash inflows could pull the CMF into negative territory. The Relative Strength Index (RSI-14) rose from negative territory to neutral levels. It is currently testing the upward trend that began el January 31 as support. A break below this level could increase selling pressure. In the event of potential increases driven por political developments, macroeconomic data, or positive news flow within the DOGE ecosystem, the $0.11797 level stands out as a strong resistance zone. Conversely, en the event of negative news flow, the $0.09071 level could be triggered. A decline to these levels could increase momentum and initiate a new wave of growth.
Supports: 0.10442 – 0.09962 – 0.09451
Resistances: 0.10837 – 0.11391 – 0.11797
TRX/USDT
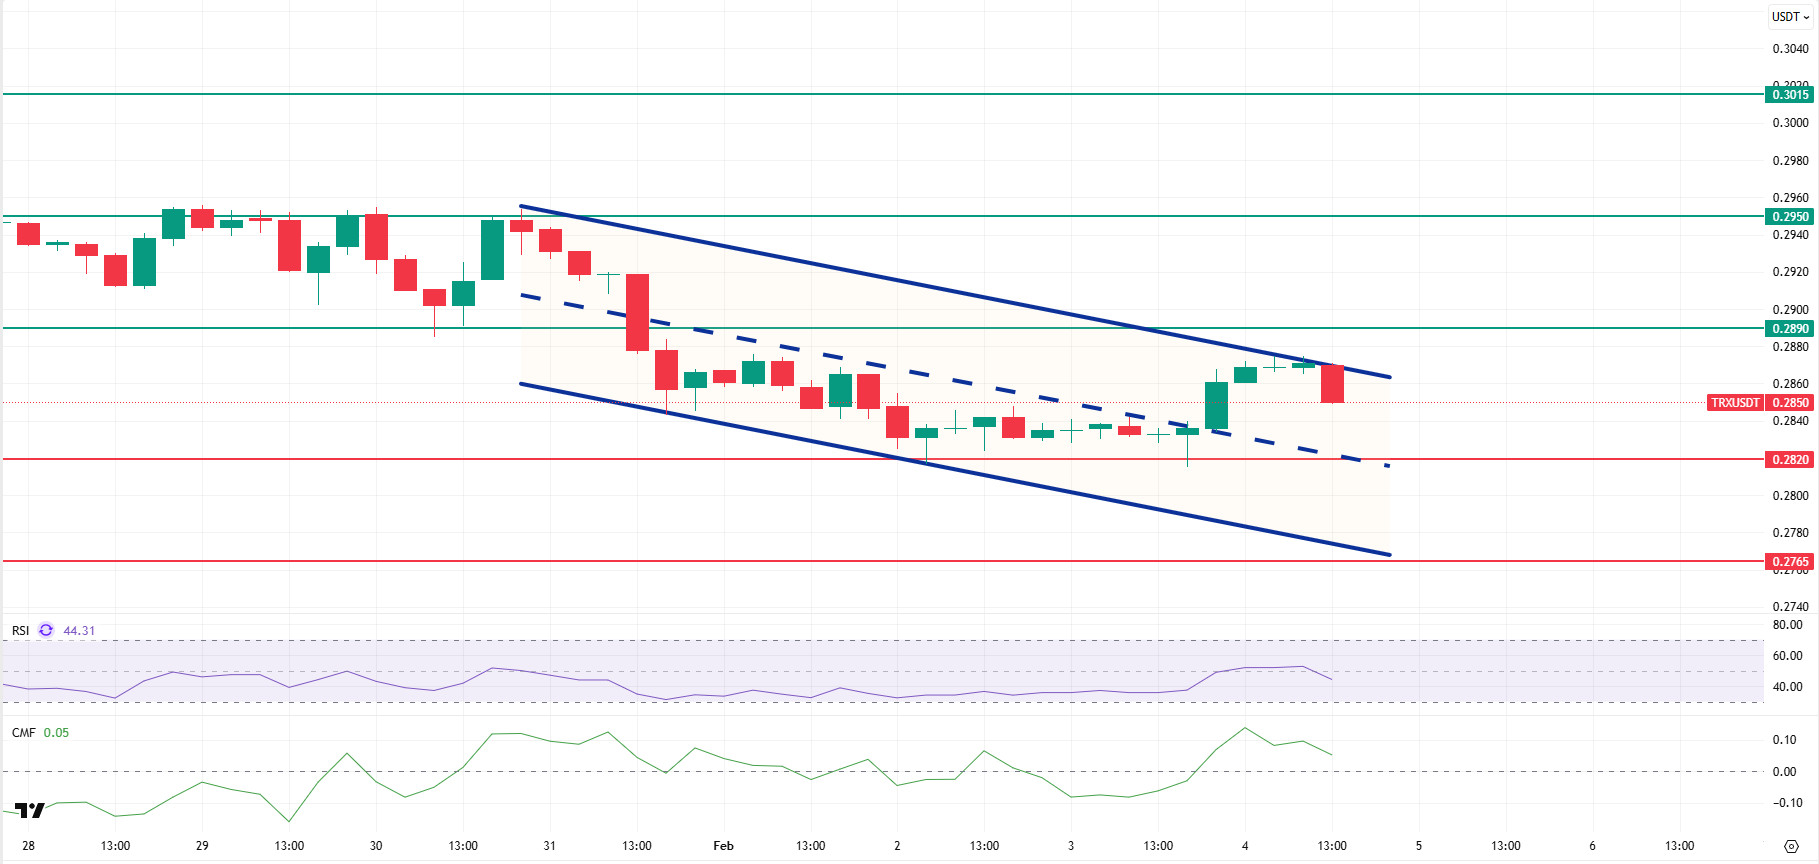
As mentioned en this morning’s analysis, following the decline, TRX is currently trading at the 0.2850 level. After the sell-off reaction from the upper band of the bearish channel, TRX, which is currently below the upper band of the channel, is priced above the 0.2820 support el the 4-hora chart. The Relative Strength Index (RSI) value is seen to be moving away from the neutral zone at 44. In addition, the Chaikin Money Flow (CMF) indicator hovering above the zero level at a value of 0.05 shows that inflows continue despite a weakening en inflows. The CMF’s continued presence en the positive zone signals an increased potential for upward price movement.
In light of all these indicators, TRX may decline slightly en the segundo half of the day and move towards the middle band of the bearish channel. In such a scenario, it may test the 0.2820 support level. If it closes below the 0.2820 support level, it may continue its decline and attempt to test the 0.2765 support level. If the candle does not close below the 0.2820 support level and the CMF remains en positive territory, inflows of money may gain strength. In this case, after a possible rise en price, the 0.2890 and 0.2950 resistance levels may be tested en succession.
On the 4-hora chart, 0.2705 is an important support level, and as long as it remains above this level, the upward trend is expected to continue. If this support level is broken, selling pressure is expected to increase.
Supports: 0.2820 – 0.2765 – 0.2705
Resistances: 0.2890 – 0.2950 – 0.3015
Legal Notice
The investment information, comments, and recommendations contained herein do not constitute investment advice. Investment advisory services are provided individually por authorized institutions taking into account the risk and return preferences of individuals. The comments and recommendations contained herein are of a general nature. These recommendations may not be suitable for your financial situation and risk and return preferences. Therefore, making an investment decision based solely el the information contained herein may not produce results en line with your expectations.

