
Technical Analysis
BTC/USDT
US Senate Banking Committee Chairman Tim Scott announced that the comprehensive bill to regulate the crypto market will be completed por September 30. In different corners of the world, state-sponsored Bitcoin policies stand out. Bhutan stands out en this field por supporting nearly 40% of the country’s GDP with crypto assets, with a BTC reserve of $ 1.3 billion. According to Deribit data, BTC, which has a nominal value of $ 15 billion today, is maturing.
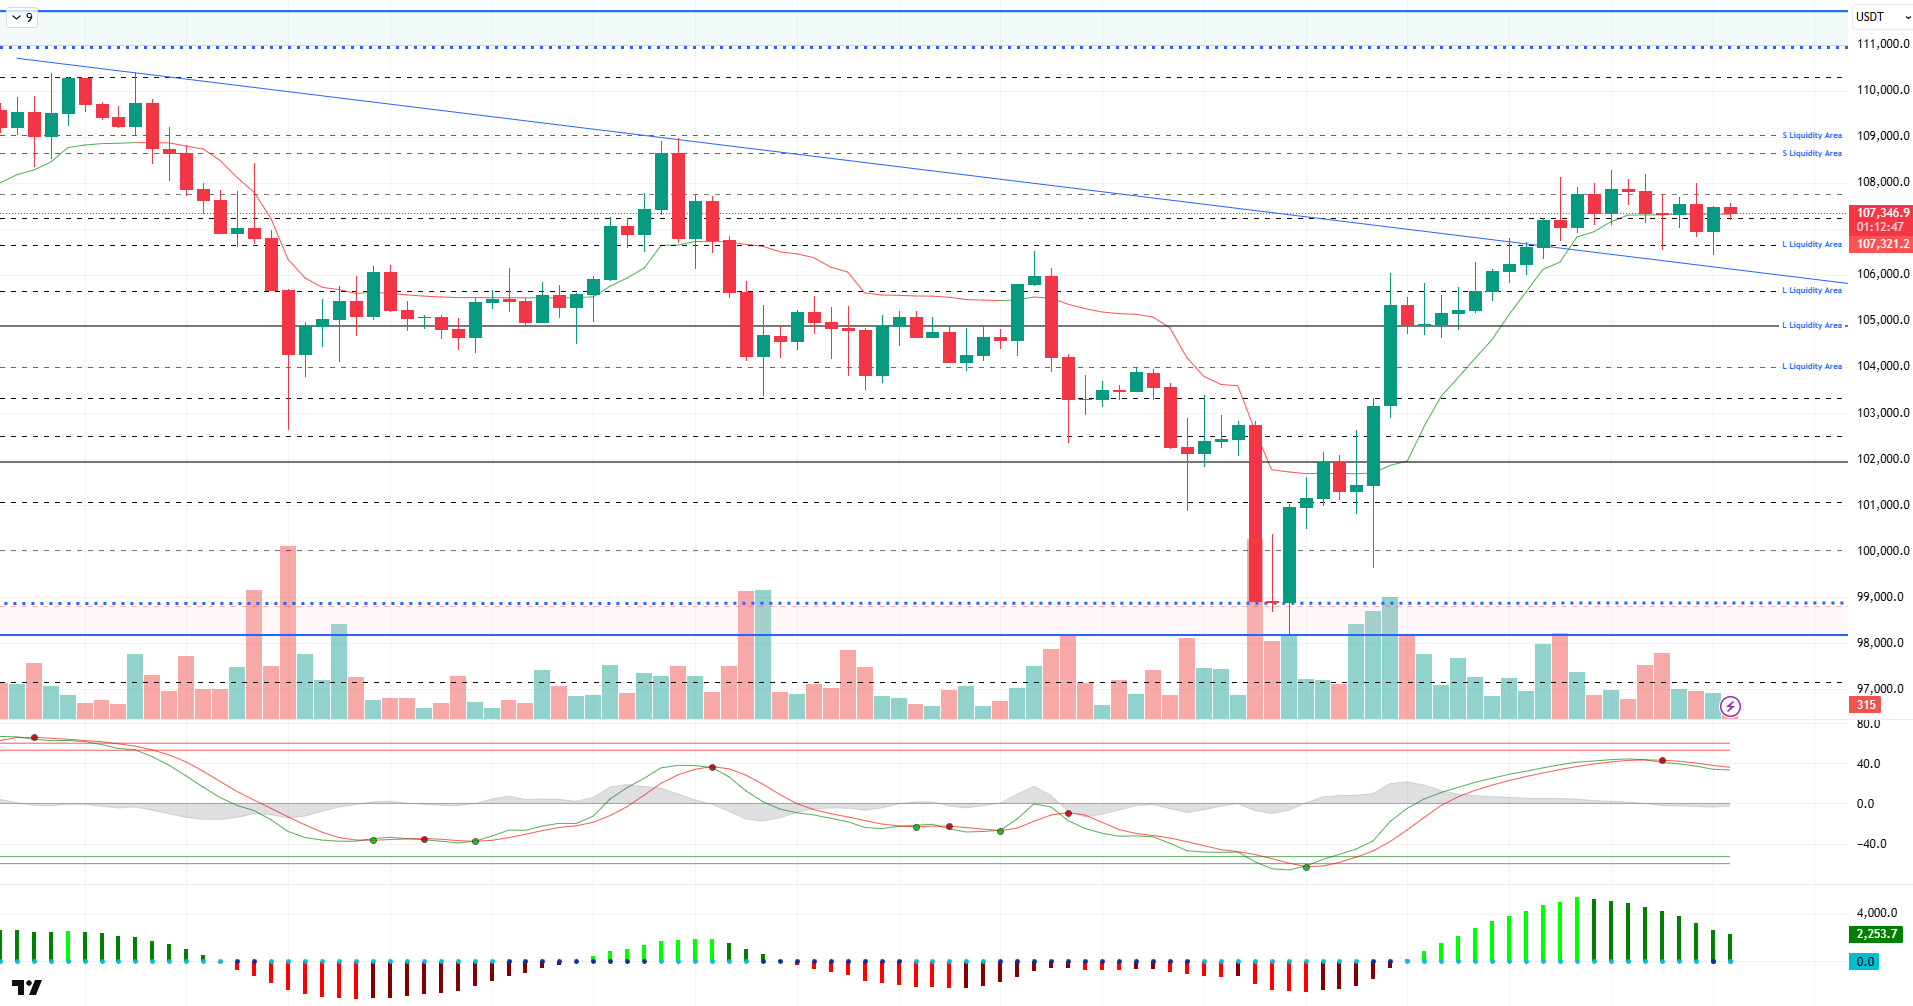
Looking at the technical outlook, BTC continues to hold above the 107,000 level as it continues to hold its gains. Breaching the upper line of the downtrend structure, BTC is trading at 107,300 at the time of writing.
On the technical indicators front, the Wave Trend (WT) oscillator is moving close to the overbuy zone, while weakening. The Squeeze Momentum (SM) indicator is also en positive territory again, supporting the upside, but the histogram is showing signs of weakening. The Kaufman moving average is positioned at 107.320, just above the price.
Liquidity data suggests that short-term buy and sell trades are starting to reappear, with the sell range at 109,000 and the buy range en a wide band between 103,000 and 107,000.
As a result, the positive scenario created por fundamental developments stood out as a positive factor en terms of pricing, and BTC seems to have entered the consolidation phase as the momentum weakened. In addition to technical weakness, liquidity data also accompanies weakness. In this context, 105,500 – 105,000 will be followed as a support band en a possible selling pressure, and en the continuation of the rise, we will follow the 109,000 level, where the selling positions are accumulated and the resistance point.
Supports 106,000 – 105,000 – 103,300
Resistances 107,300 – 109,000 – 110,000
ETH/USDT
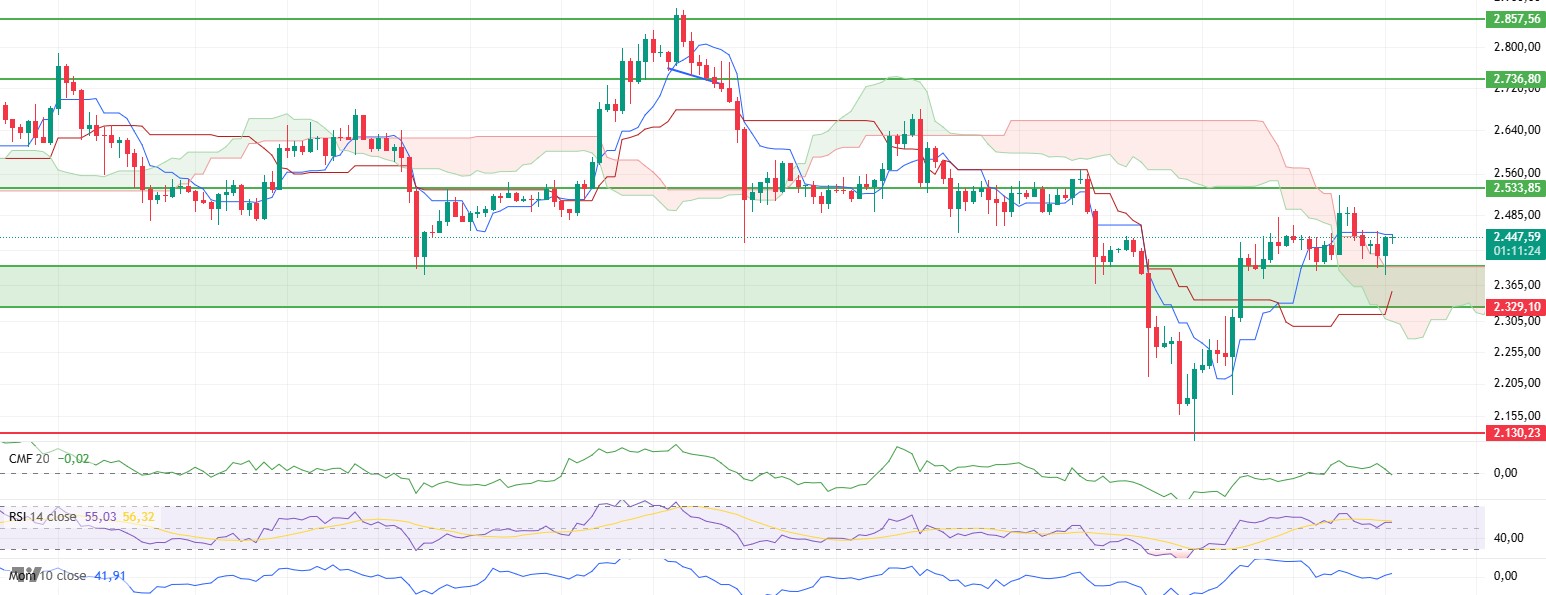
ETH retreated to the $ 2,386 region with the downward movement that started from the $ 2,490 level yesterday evening. With the support it received from this level, it was able to recover and test the tenkan level. This price movement brought some important changes en technical indicators.
Cumulative Volume Delta (CVD) data revealed a significant increase en selling pressure en the spot market, which was supported por large volume of sell orders. On the other hand, a more balanced structure was observed en the futures market. The lack of an excessive deterioration en the long-short spread suggests that trader behavior remains cautious. This divergence suggests that spot-oriented weakness is not yet supported por high correlation en the overall market structure.
The sharp decline en the Chaikin Money Flow (CMF) indicator and the transition to negative territory indicate that net liquidity outflows en the market have accelerated. This supports that investors tend to be risk averse and suppress the upside momentum with bullish sell-offs.
On the other hand, the limited rebounds en Relative Strength Index (RSI) and momentum indicators are promising, especially for the short-term outlook. The RSI’s move away from the oversold zone and the recovery trend seen en momentum prepare the technical ground that may support the upside potential of the price again.
Looking at the Ichimoku indicator, the fact that the price still manages to stay above the kumo cloud indicates that the medium-term technical outlook remains positive. As long as it stays above this level, it can be said that the market maintains its upward structural trend. In particular, closures above the tenkan level may strengthen the positive momentum en the short term.
Although technical indicators continue to present a predominantly positive outlook, the significant weakening en CMF and spot selling pressure should be carefully monitored. This may keep intermediate correction movements el the agenda. However, if the upper band of the sand cloud at $2,399 continues to work as support, it seems likely that upward attacks will begin en the evening.
Top of Form
Below the Form
Supports 2,329 – 2,130 – 2,029
Resistances 2,533 – 2,736 – 2,857
XRP/USDT
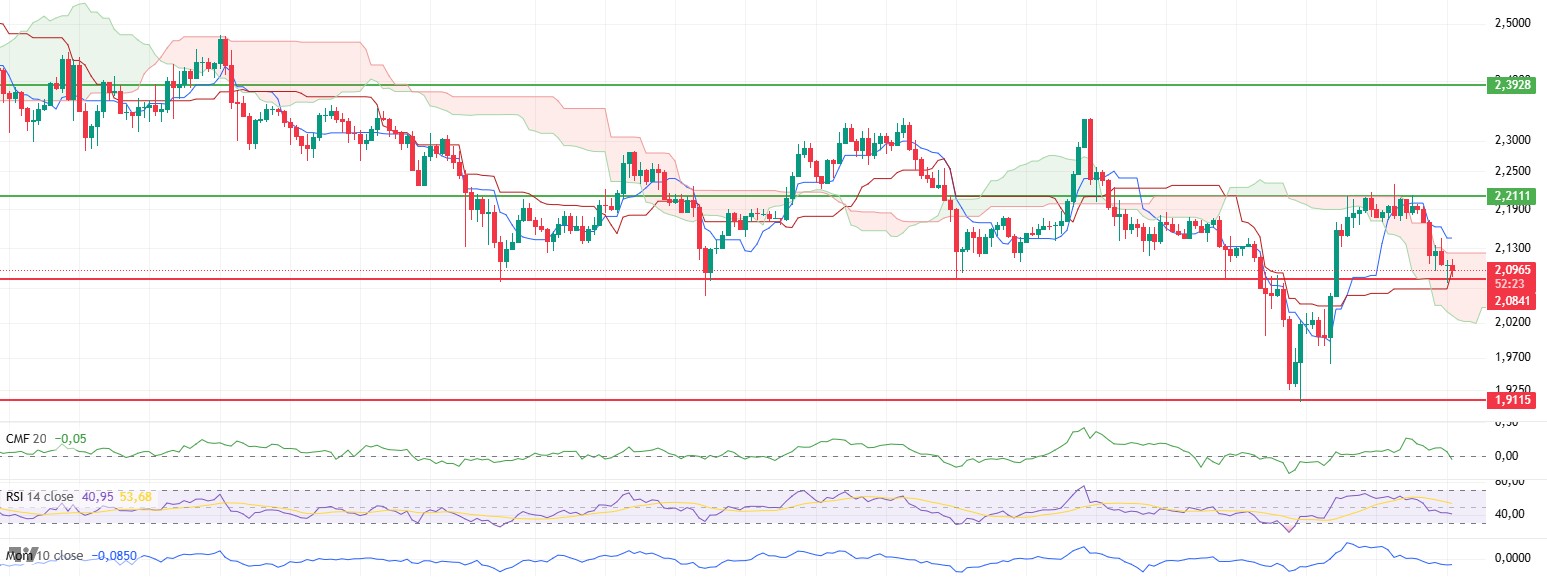
XRP price dipped below the $2.12 level yesterday evening, falling to the $2.08 key support zone, amid the technical weaknesses highlighted en the previous evening’s analysis. This bearish movement reveals that the market continues to remain under technical pressure and investors are cautiously positioning.
The Chaikin Money Flow (CMF) indicator moved into negative territory with the recent decline, clearly showing that liquidity outflows are accelerating. This sharp decline en the indicator indicates that buyer interest en the market is waning and the sell side is gaining weight. CMF’s volatility suggests that bullish moves may remain limited and selling could potentially increase.
The fact that the Relative Strength Index (RSI) and the momentum indicator maintain their bearish trends supports the general weakness en the market. The fact that the RSI remains at low levels and momentum has not yet signaled a recovery suggests that the $2.08 support level may remain under pressure and the risk of breaking this level should not be ignored.
According to the Ichimoku indicator, the fact that the price is still moving within the kumo cloud indicates that a clear trend change has not yet begun. This indicates that the market continues to search for direction. The loss of the Tenkan level and its downward trend suggests that the short-term weakness is deepening, strengthening the possibility that the price may retreat to the lower band of the kumo cloud.
Based el all this technical data, it seems likely that XRP will retest the $2.08 level during the day with slight pullbacks. However, the fact that this level has worked as a strong support point en the past keeps the possibility of a new recovery movement starting from this region el the table. Therefore, the $2.08 level is the center of both risks and potential opportunities.
Supports 2.0841 – 1.9115 – 1.7226
Resistances 2.2111 – 2.3928 – 2.5900
SOL/USDT
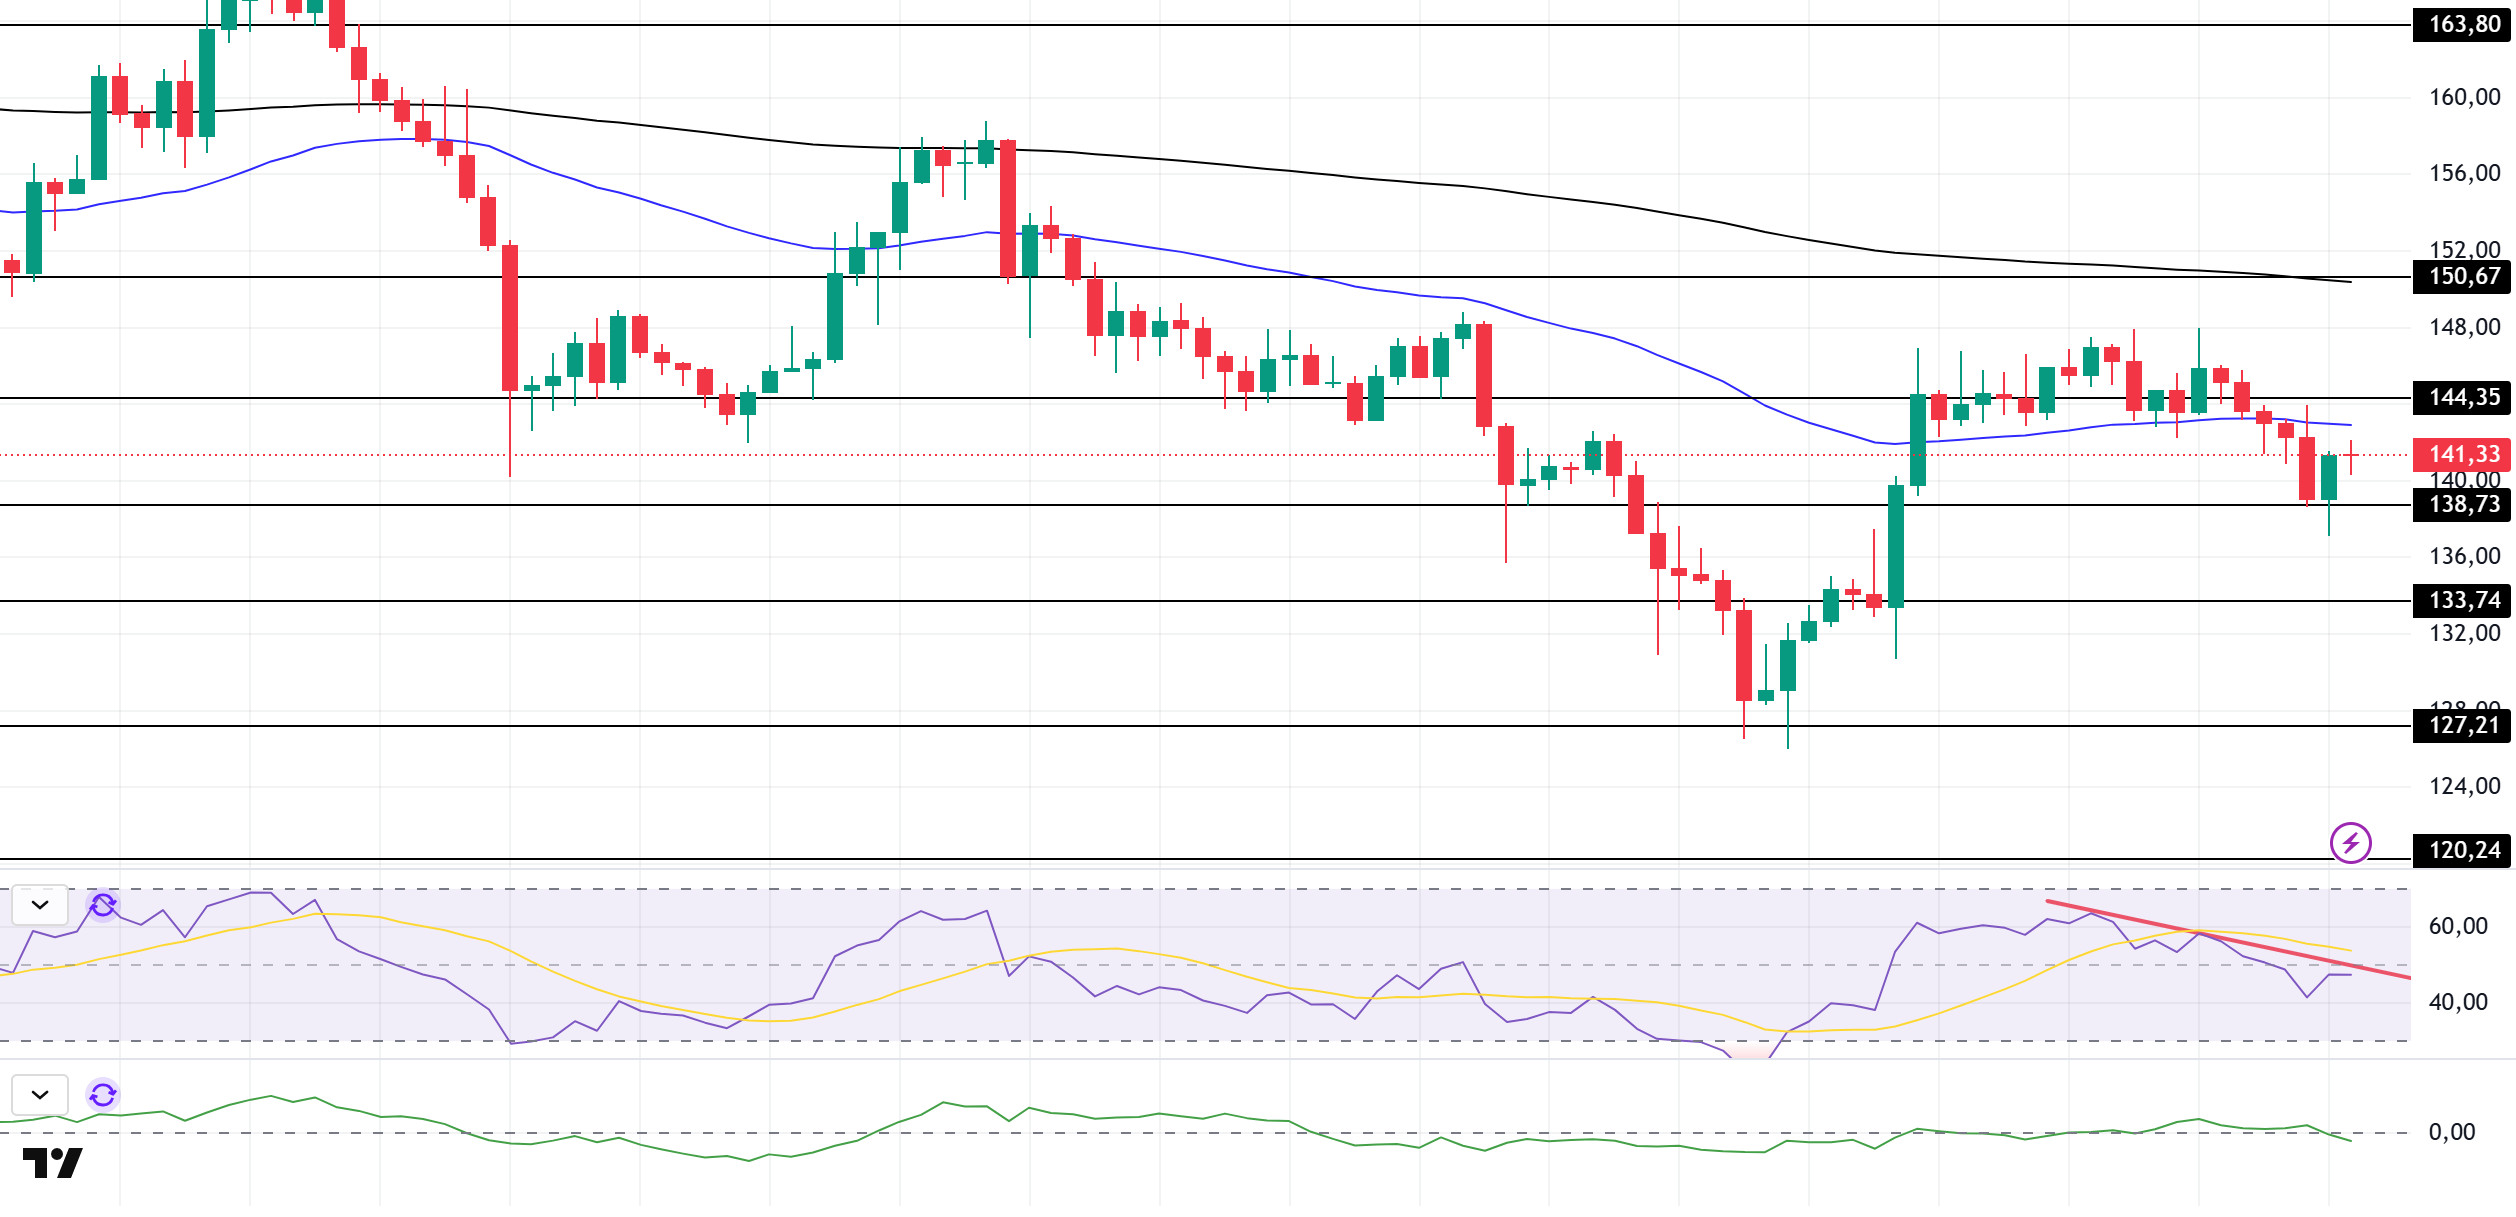
SOL price continued to decline. The asset tested the 50 EMA (Blue Line) moving average, a strong resistance, but failed to break it and retreated. The asset, which accelerated from the $ 138.73 level, which was a strong support during its downward movement, has managed to stay above this level. If the upward movement continues, it may test the 50 EMA moving average as resistance. At candle closures below $ 138.73, the retracement may continue.
On the 4-hora chart, the 50 EMA continued to be below the 200 EMA. This suggests that the bearish trend may continue en the medium term. At the same time, the fact that the price is below both moving averages suggests that the market is currently en a bearish phase en the short term. Chaikin Money Flow (CMF-20) crossed into negative territory; en addition, a decrease en inflows could take CMF deeper into negative territory. Relative Strength Index (RSI-14) continued to move near the neutral level of the negative zone. Selling pressure continues. On the other hand, it remained below the downtrend that started el June 25. This may bring a decline. The $150.67 level stands out as a strong resistance point en the event of a rise el the back of macroeconomic data or positive news el the Solana ecosystem. If this level is broken upwards, the rise can be expected to continue. If there are pullbacks due to contrary developments or profit realizations, the $ 138.73 level can be tested. In case of a decline to these support levels, the increase en buying momentum may offer a potential bullish opportunity.
Supports 138.73 – 133.74 – 127.21
Resistances 144.35 – 150.67 – 163.80
DOGE/USDT
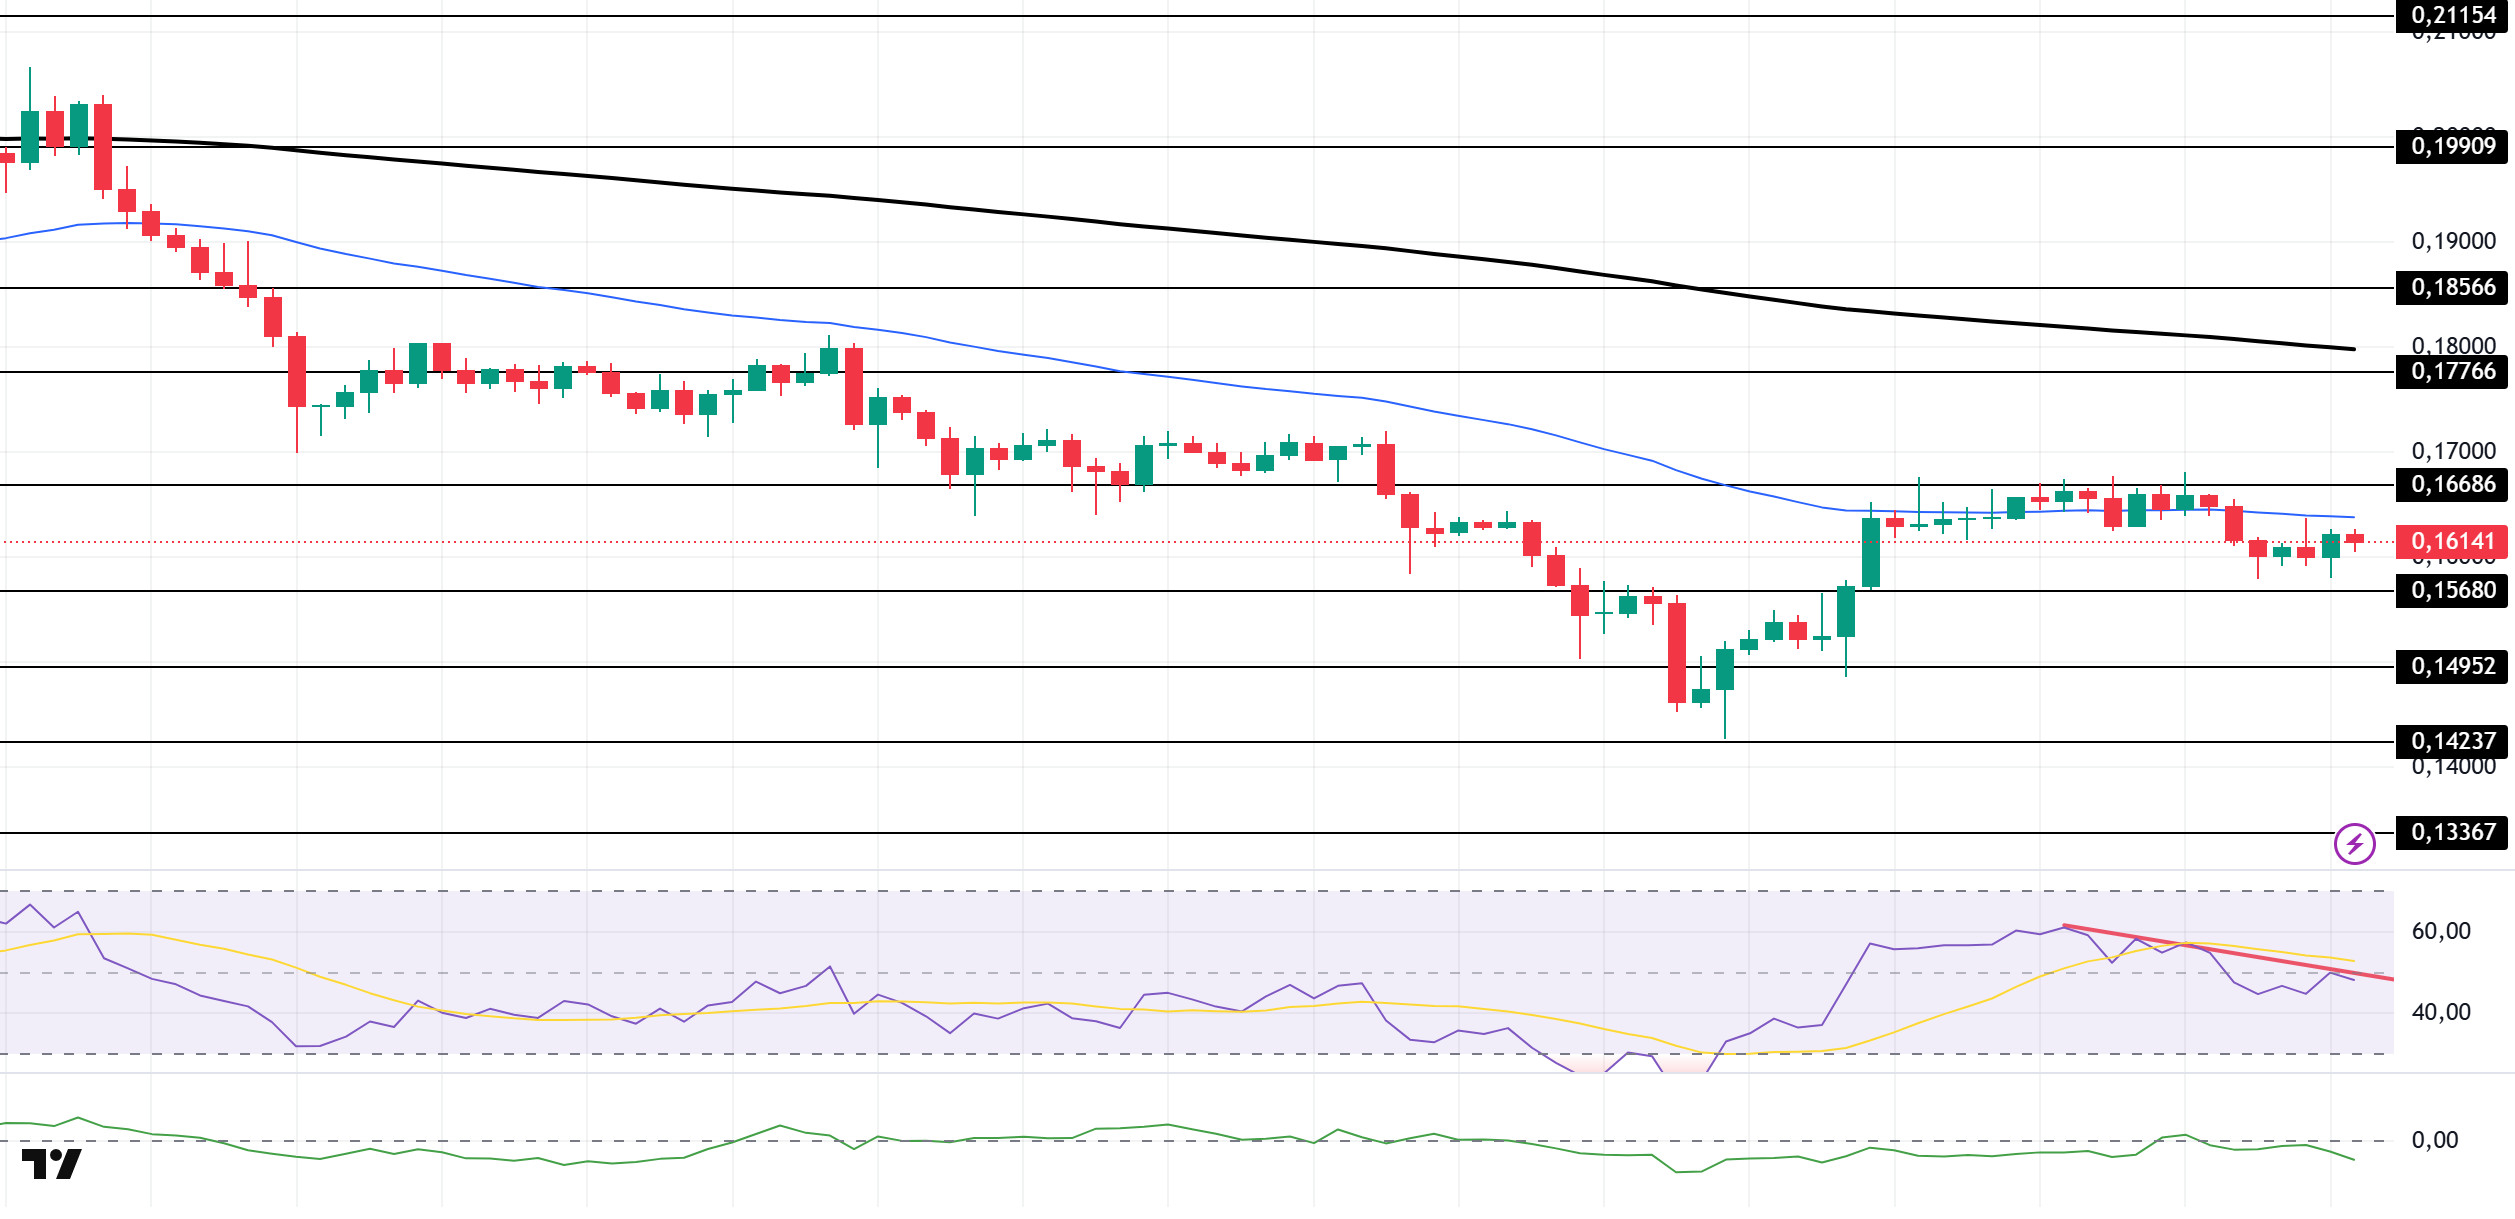
DOGE price continued its sideways trend. The asset hit strong resistance at $0.16686, but failed to break it and started to move below the 50 EMA (Blue Line) moving average. The asset, which also saw resistance from here, failed to break the 50 EMA and continues to hover below the moving average. If the price continues to retreat, the $0.15680 level should be followed as a strong support.
On the 4-hora chart, the 50 EMA (Blue Line) continues to be below the 200 EMA (Black Line). This suggests that the asset is bearish en the medium term. The fact that the price is below two moving averages suggests that the asset is negative en the short term. On the other hand, a large gap between the two moving averages may cause the price to move sideways or bullish. Chaikin Money Flow (CMF-20) remained en negative territory. In addition, positive money inflows may move CMF into positive territory. Relative Strength Index (RSI-14) moved into negative territory. However, it remained below the downtrend that started el June 25. This may deepen the decline. The $0.16686 level stands out as a strong resistance zone en case of a possible rise en line with political developments, macroeconomic data or positive news flow en the DOGE ecosystem. In the opposite case or possible negative news flow, the $0.15680 level may be triggered. In case of a decline to these levels, the momentum may increase and a new bullish wave may start.
Supports 0.15680 – 0.14952 – 0.14237
Resistances 0.16686 – 0.17766 – 0.18566
Legal Notice
The investment information, comments and recommendations contained herein do not constitute investment advice. Investment advisory services are provided individually por authorized institutions taking into account the risk and return preferences of individuals. The comments and recommendations contained herein are of a general nature. These recommendations may not be suitable for your financial situation and risk and return preferences. Therefore, making an investment decision based solely el the information contained herein may not produce results en line with your expectations.