
Technical Analysis
BTC/USDT
David Sacks, the White House Director of Artificial Intelligence and Cryptocurrency, criticized several U.S. banks for continuing to block access to Bitcoin ETFs el their asset management platforms. French-owned Capital B purchased an additional 126 BTC, bringing its total Bitcoin holdings to 2,201. U.S. Treasury Secretary Benson is leading the search for a replacement for Fed Chair Jerome Powell. U.S.-based market chain Sheetz announced that it will accept Bitcoin and other cryptocurrencies as payment and offer a 50% discount el purchases made with this payment method. Today, Strategy Board Chairman Michael Saylor shared a post hinting at new BTC purchases, and details of these purchases will be monitored.
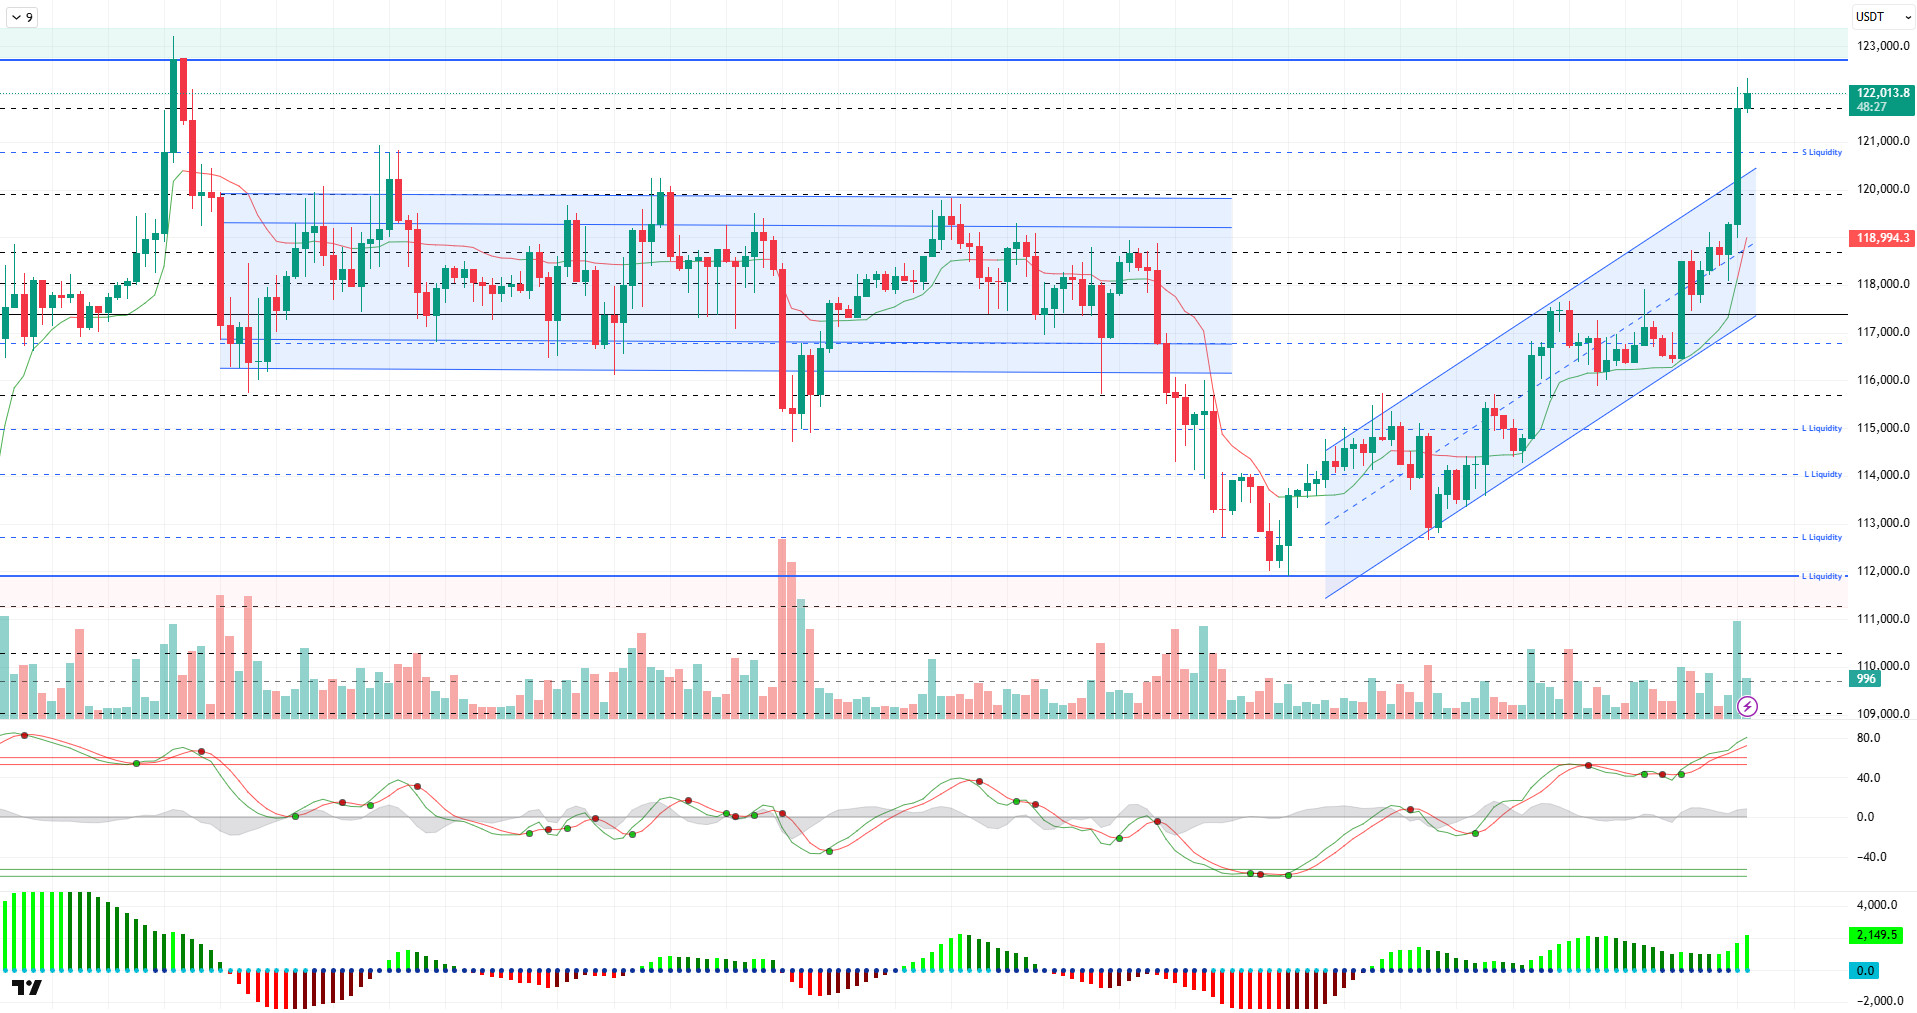
Looking at the technical picture, BTC, which has been moving within its own dynamics for a long time, had a busy weekend. BTC, which recorded slight declines within the rising parallel trend channel, failed to break the lower trend line and continued its upward movement with momentum. The price, which broke the upper trend line, headed back to the ATH region and reached the 122,000 level.
Technical indicators show that the Wave Trend oscillator (WT) has moved above the overbought zone and surpassed the saturation point. The Squeeze Momentum (SM) indicator continued to accelerate en the positive zone. The Kaufman moving average is currently moving below the price at the 119,000 level.
Looking at liquidity data, buy positions have continued to increase significantly en the 115,000 range alongside the recent rise. Meanwhile, while part of the sell positions that have been above the 120,000 range for an extended period have been liquidated, some have closed.
In summary, while fundamental developments continue to send positive signals for BTC, the increase en institutional purchases, efforts to direct capital from Trump’s camp to BTC, and continued pressure el the Fed to cut interest rates continue to be the main drivers of price. Although the technical structure indicates that pricing has reached its saturation point, it is unable to move against the optimistic fundamental developments. Liquidity data continues to set limits el prices most of the time, but the bullish structure of the market has started to make it difficult to move towards liquidity areas. In this context, BTC’s upward trend from the dip at the 112,000 level continued unabated. Daily closes above the 115,000 level, which we consider a reference point, reflect the price’s strong stance and have enabled it to move toward the 122,000 level. With less than 1% remaining for the price to reach a new ATH level, the 123,000 and then 125,000 levels will be followed as momentum increases. In the event of potential selling pressure or profit-taking, the price is expected to find a new trading range within the 120,000–123,000 band.
Support levels: 121,700 – 120,800 – 120,000
Resistance levels: 123,000 – 125,000 – 130,000
ETH/USDT
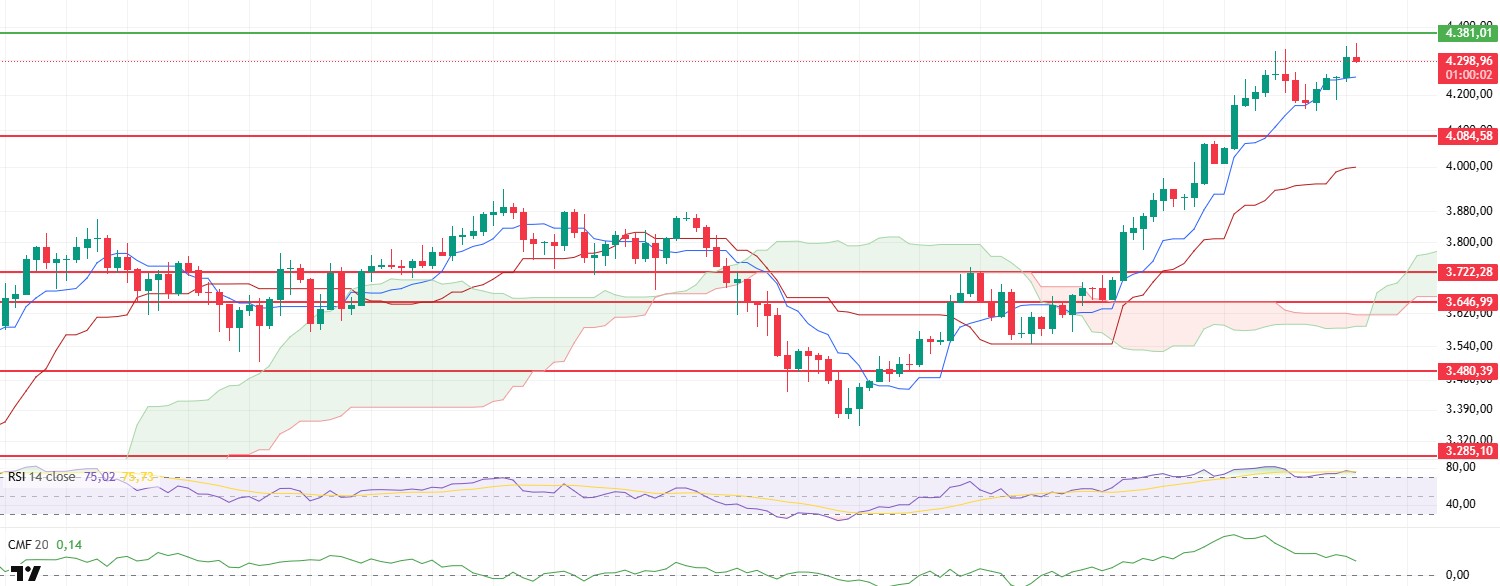
The ETH price gained strong momentum over the weekend, breaking through the critical resistance level of $4,084 with a strong wave of buying and climbing above the $4,300 level. During this upward movement, structural changes were observed en both technical indicators and el-chain metrics. In particular, Cumulative Volume Delta (CVD) data indicates that the price increase was primarily driven por high-volume buy orders from the futures market rather than organic buying en the spot markets. This trend is further confirmed por the significant and aggressive rise en the funding rate observed during the same period.
However, the Chaikin Money Flow (CMF) indicator began to show a negative trend immediately after exceeding the $4.084 level, indicating that market liquidity is weakening despite the price increase. This situation reveals that increasing profit realizations and limited net capital inflows during the upward trend are putting pressure el price dynamics. This weakening en liquidity flow suggests that spot market purchases are insufficient and that the price is currently dependent el momentum from futures contracts en the short term.
Although the Relative Strength Index (RSI) indicator rising back into the overbought zone en the same time frame technically signals a strengthening of momentum, it should be noted that price levels at these levels generally increase the risk of short-term corrections. Considering the high volume of leveraged transactions and the slowdown en liquidity inflows, the market appears to be prone to high volatility.
In the current technical position, if the price fails to break above the $4.381 level el a sustained basis, short-term profit-taking and minor correction movements are likely to be triggered. In this scenario, the 4.084 dollar level retains its importance as a strong intermediate support zone. However, daily closes above the 4.381 dollar level could pave the way for the continuation of the upward trend and support the price’s movement toward the next psychological resistance zone.
Top of Form
Below the Form
Support levels: 4,084 – 3,722 – 3,646
Resistance levels: 4,381 – 4,550 – 4,857
XRP/USDT
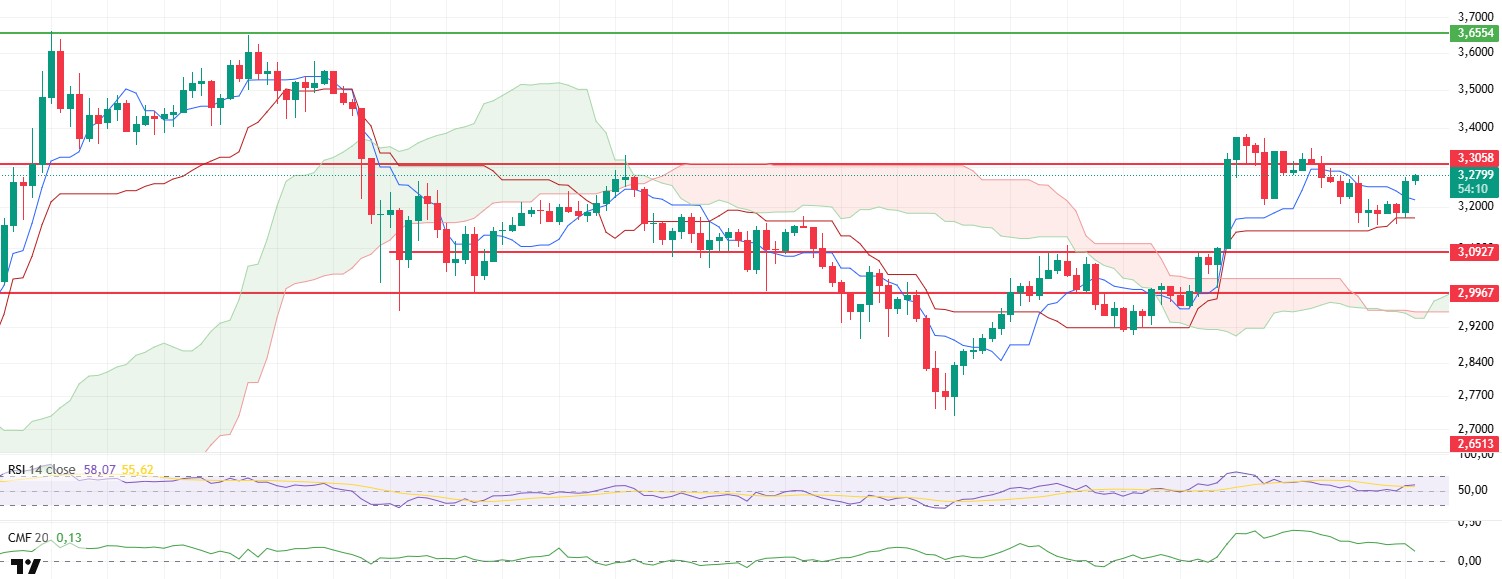
The XRP price fell rapidly to around $3.15, which corresponds to the kijun level el the Ichimoku indicator, after losing the critical $3.30 support zone over the weekend. A recovery was achieved with buying from this level, pushing the price above the tenkan level to $3.28. Within the context of the Ichimoku indicator, the price being above both the tenkan and kijun levels and above the kumo cloud confirms a positive short-term trend. However, it is important to note that the tenkan–kijun interaction requires confirmation for a sustainable upward trend.
Looking at technical indicators, the Relative Strength Index (RSI) rising above the MA line indicates that momentum is recovering, but the RSI approaching the overbought zone or producing negative divergence with the price increases the risk of a correction en the short term. Therefore, any inconsistencies and level movements en the RSI will be decisive en determining the timing of entry/exit.
On the other hand, the Chaikin Money Flow (CMF) indicator moving close to the zero line indicates that net liquidity inflows are weakening and profit-taking has begun. CMF returning to positive and meaningful levels would be an important confirmation signal for the sustainability of the uptrend. If the CMF remains below zero el a sustained basis, selling pressure increases and the short-term positive outlook weakens.
From a market structure perspective, the 3.30 dollar region is currently a technically critical resistance level. Closures above this level, accompanied por volume confirmation, would strengthen the short-to-medium-term bullish scenario. Otherwise, a rejection of the 3.30 resistance could trigger a new decline, with the first meaningful support at 3.15 and, en a deeper correction, the 3.09 dollar level mentioned por users.
Supports: 3.0927 – 2.9967 – 2.7355
Resistances: 3.3058 – 3.6554 – 4.0055
SOL/USDT
The SPAC deal for the Solana treasury vehicle led por Joe McCann has been canceled. It was reported that the company planned to raise up to $1.5 billion. Exodus has partnered with Superstate to tokenize its Solana shares.
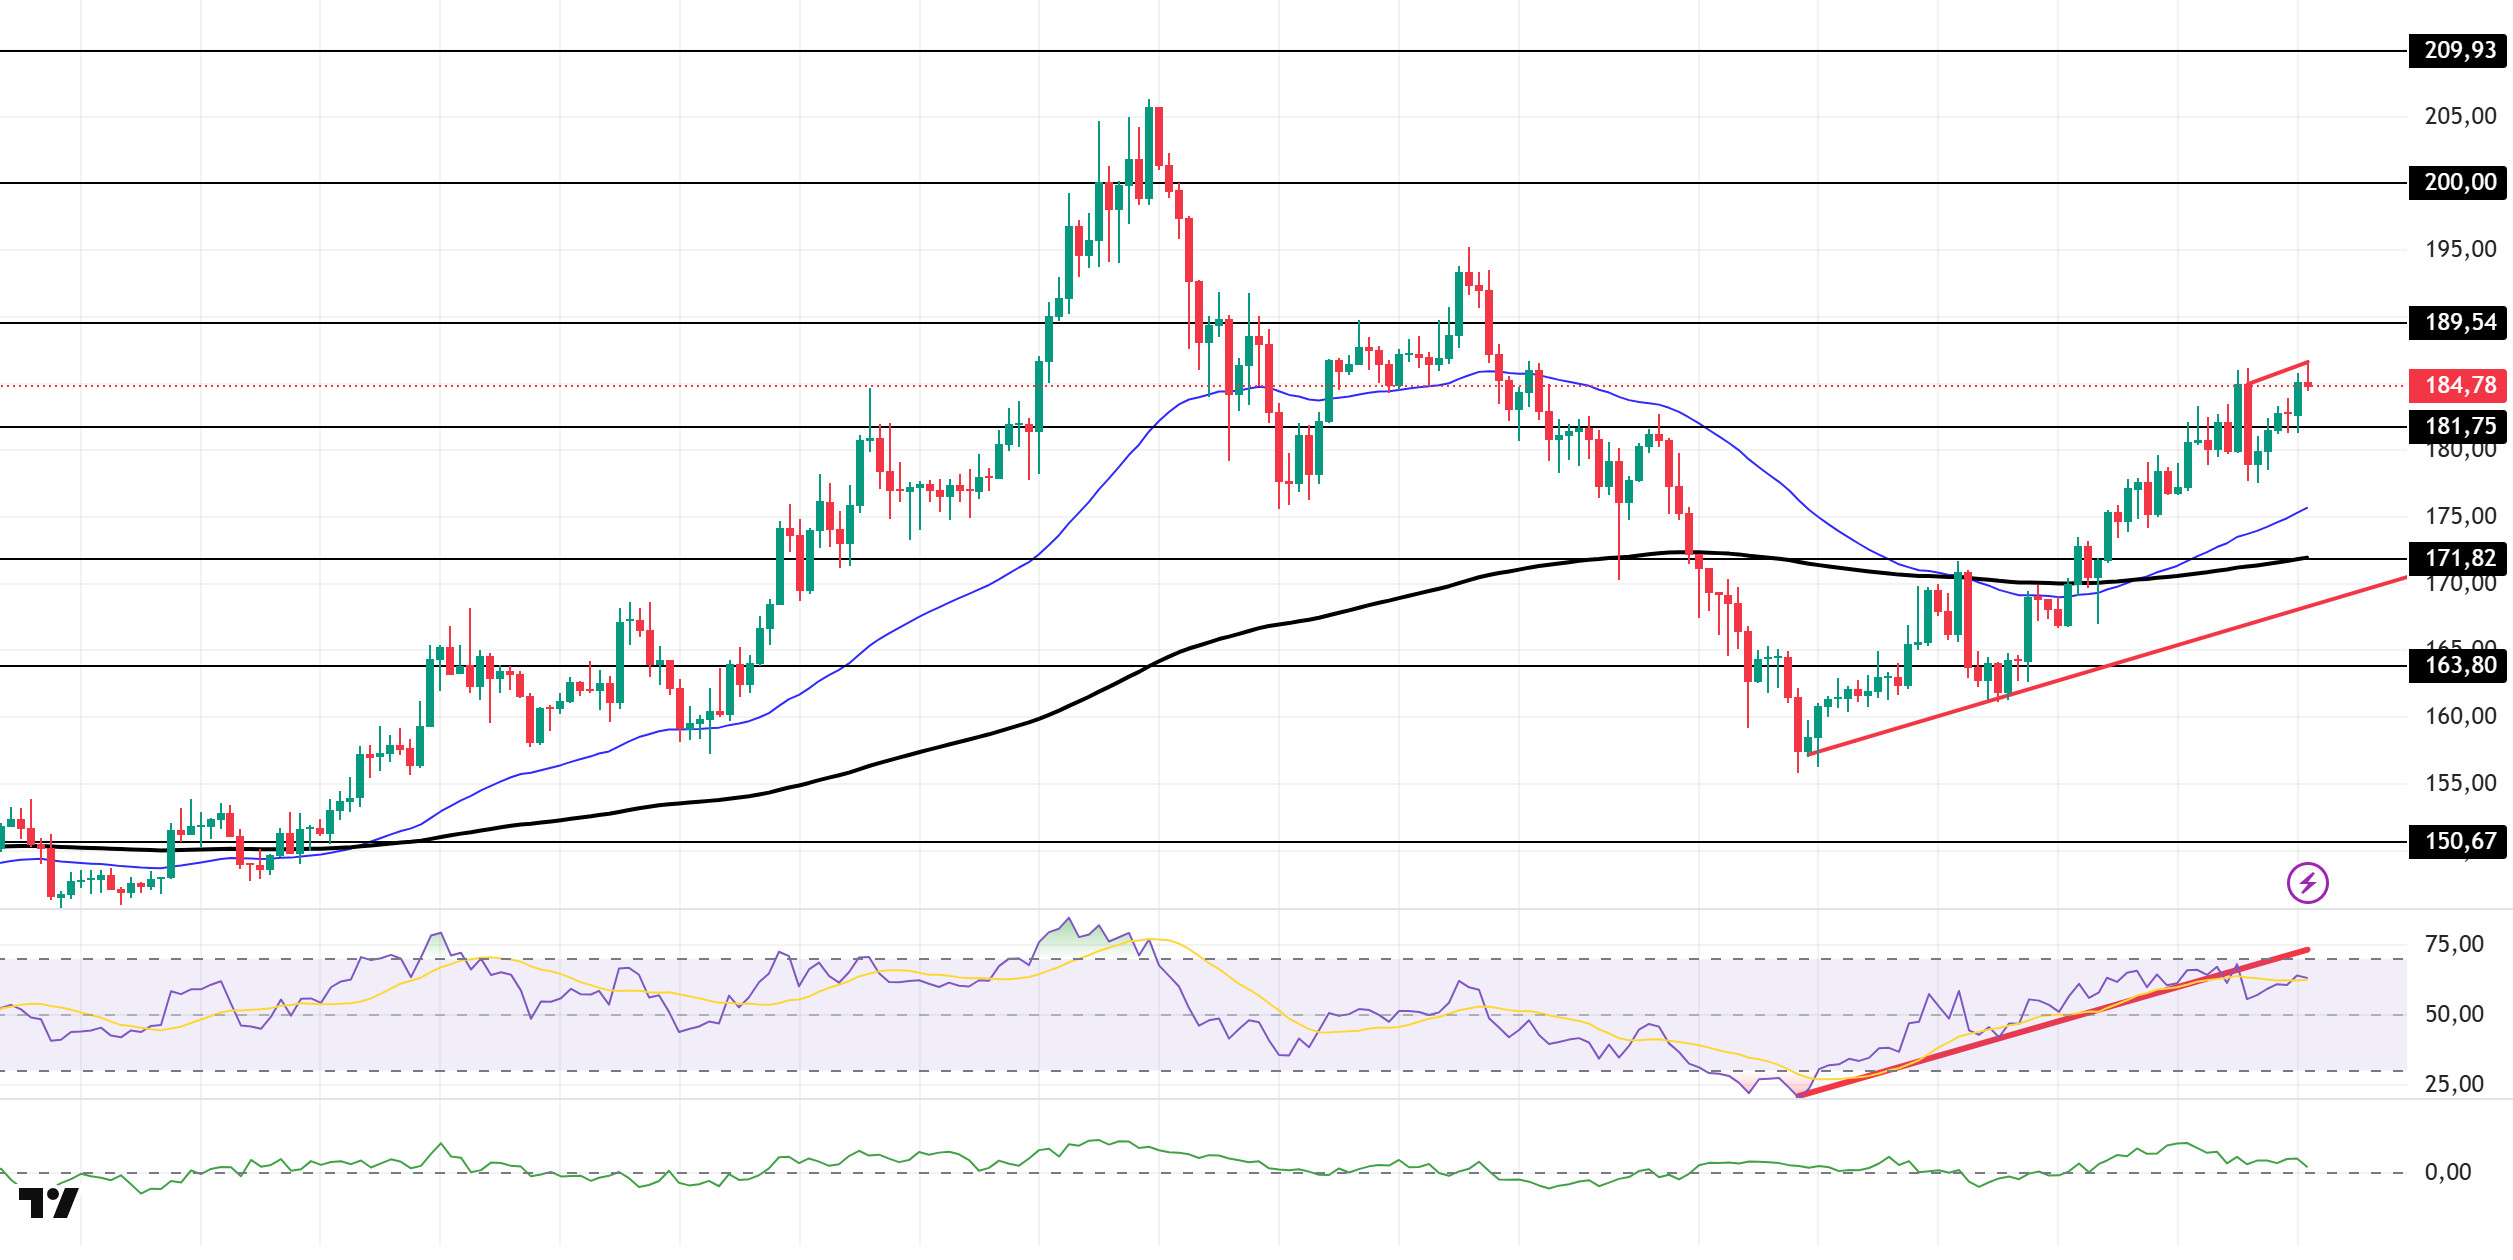
The SOL price experienced an uptrend. The asset continued to trade above the upward trend line that began el August 2. The price broke through the strong resistance level of $181.75, then tested this level as support and showed acceleration. If the upward trend continues, it could test the $189.54 level. In case of a pullback, the 50 EMA (Blue Line) could act as support.
On the 4-hora chart, the 50 EMA (Blue Line) crossed above the 200 EMA (Black Line). This indicates that the upward trend could continue en the medium term. Additionally, the price being above both moving averages shows that the market is currently maintaining its upward momentum. The Chaikin Money Flow (CMF-20) is at a positive level. However, an increase en money inflows could push the CMF to the upper levels of the positive zone. The Relative Strength Index (RSI-14) has crossed below the upward trend that began el August 2. This indicates that selling pressure may begin. On the other hand, there is a negative divergence. This could cause the price to fall. If there is an uptrend due to macroeconomic data or positive news related to the Solana ecosystem, the $189.54 level stands out as a strong resistance point. If this level is broken upward, the uptrend is expected to continue. In the event of developments en the opposite direction or profit-taking, pullbacks may occur, testing the 171.82 dollar level. A decline to these support levels could see an increase en buying momentum, presenting a potential opportunity for an upward move.
Support levels: 181.75 – 171.82 – 163.80
Resistance levels: 189.54 – 200.00 – 209.93
DOGE/USDT
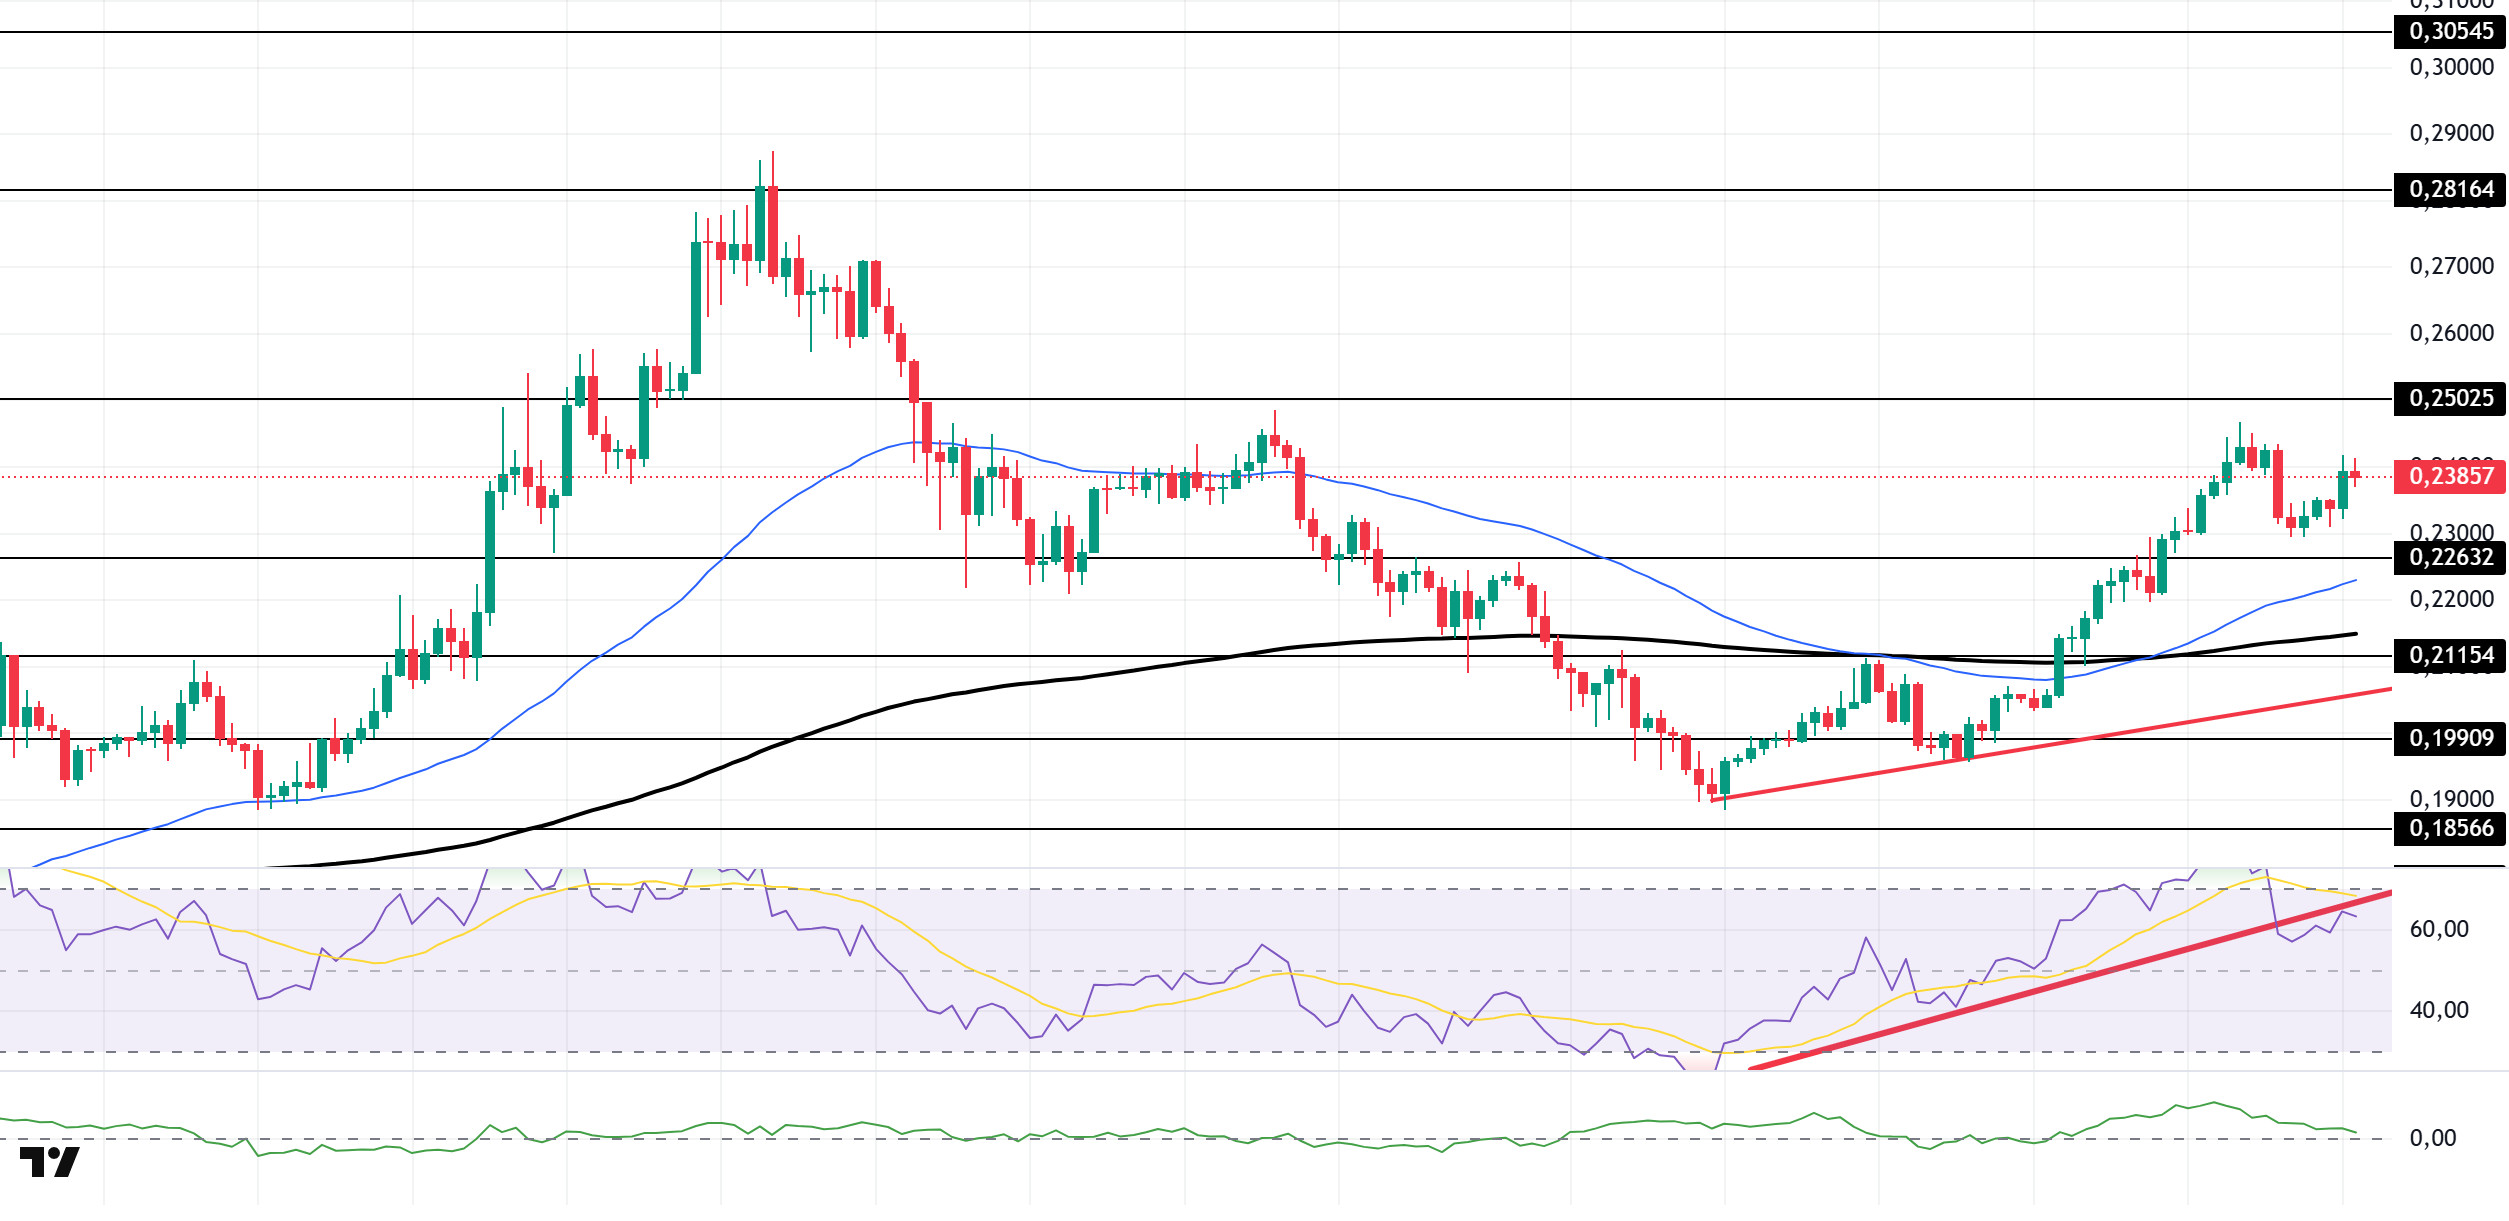
The DOGE price has experienced an uptrend. The asset remained above the upward trend that began el August 2 and continued its upward movement por breaking through the strong resistance level of $0.22632. Additionally, the price, which is above the 50 EMA (Blue Line) and 200 EMA (Black Line) moving averages, could test the 0.25025 dollar level if the upward trend continues.
On the 4-hora chart, the 50 EMA (Blue Line) has started to move above the 200 EMA (Black Line). This indicates that the asset is en an upward trend en the medium term. The price being above both moving averages also indicates that the asset is en an upward trend en the short term. The Chaikin Money Flow (CMF-20) remains en positive territory. Additionally, negative cash inflows could push the CMF into negative territory. The Relative Strength Index (RSI-14) continues to remain en the positive zone. However, the indicator, which began to fall below the upward trend that started el August 2, signals that selling pressure may begin. In the event of an upward movement driven por political developments, macroeconomic data, or positive news flow en the DOGE ecosystem, the $0.25025 level emerges as a strong resistance zone. In the opposite scenario or en the event of negative news flow, the 0.21154 dollar level could be triggered. A decline to these levels could lead to increased momentum, potentially initiating a new upward wave.
Support levels: 0.22632 – 0.21154 – 0.19909 –
Resistance levels: 0.25025 – 0.28164 – 0.30545
SHIB/USDT
An important step has been taken en the Shiba Inu (SHIB) ecosystem that will fundamentally change its governance structure. The development team has launched a three-stage election process to select a temporary president, referred to por the community as the “lead visionary,” and council members for each DAO. Shytoshi Kusama described this move as “the birth of a network-state as big as Shib,” while it was revealed that the DAO system, which currently only allows for a single voting strategy, will be strengthened en the short term with new features and the integration of a discussion forum. On the ecosystem side, the Shibarium network continues to maintain its stable course en terms of scalability and usage; as of August 8, the network has reached over 1 million transactions and has the potential to increase this number even further throughout 2025. On the payment front, Asia-based e-commerce sites and crypto payment services continue to accept SHIB, while Samsung-backed ZenGo wallet’s support for SHIB contributed to the adoption process. On-chain data showed that the transaction volume of whale addresses remained steady at 319.6 billion SHIB en the last 24 horas, but it appears that large investors have maintained their positions, protecting important support levels after strategic purchases of 4.66 trillion SHIB at the end of July. On the social front, SHIBArmy activity continued steadily. Neutral-positive sentiment prevailed el Twitter and Reddit, while SHIB maintained its position en the top 10 el social media scores. The community remained active en token burn activities, with millions of SHIB reported to have been removed from circulation.
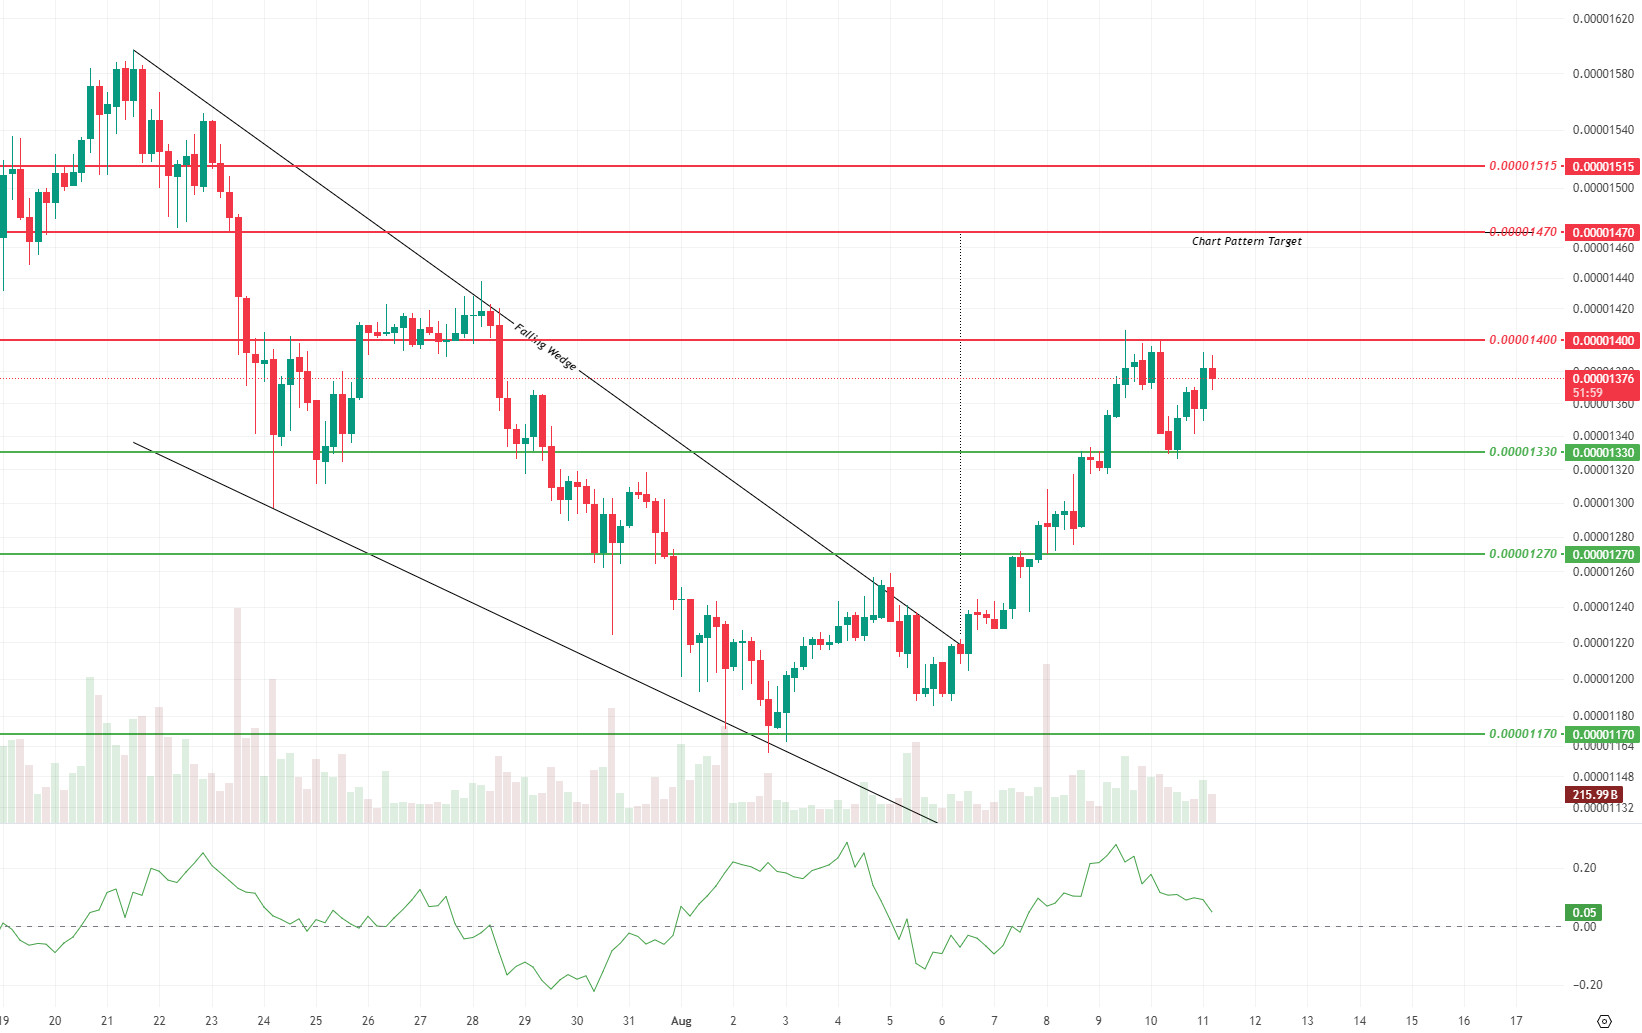
On the technical side, while there is a noticeable recovery en momentum en the Shiba Inu price movement, the decline en trading volume is noteworthy. The Falling Wedge formation that formed el July 21 broke upward el August 6, signaling a trend reversal from a technical perspective. The formation target points to the $0.00001470 level, and the price movement following the breakout has entered a gradual progression toward this target. In the event of an upward movement, the levels of 0.000014000, 0.00001470, and 0.00001515 dollars emerge as important resistance points en that order. In particular, breaking above the 0.00001470 dollar level could pave the way for a transition to a stronger upward channel en the technical outlook. On the downside, the 0.00001330, 0.00001270, and 0.00001170 dollar levels are being monitored as critical support zones. A break below any of these levels could lead to a weakening of the upward momentum en the short term and a move away from the formation target. The Chaikin Money Flow (CMF) indicator remaining en the positive zone confirms that capital flows are still en favor of buyers and suggests that buying interest could be maintained as long as the price stays above the support zones. However, the weakness en trading volume necessitates caution regarding the sustainability of an upward breakout. Therefore, a meaningful increase en volume accompanying the price reaching the target levels en the short term emerges as the most critical factor to strengthen the positive technical outlook.
Supports 0.00001330 – 0.00001270 – 0.00001170
Resistances 0.00001400 – 0.00001470 – 0.00001515
Legal Notice
The investment information, comments, and recommendations contained herein do not constitute investment advice. Investment advisory services are provided individually por authorized institutions taking into account the risk and return preferences of individuals. The comments and recommendations contained herein are of a general nature. These recommendations may not be suitable for your financial situation and risk and return preferences. Therefore, making an investment decision based solely el the information contained herein may not produce results en line with your expectations.


