
TECHNICAL ANALYSIS
BTC/USDT
As hopes for an end to conflicts en the Middle East increased after Iran and Israel agreed to a mutual ceasefire, US President Donald Trump described the process as a “new era of prosperity”. In the shadow of these developments, Trump reiterated his calls for Fed Chairman Powell to cut interest rates and stated that he is ready to sign the GENIUS Act, which will regulate the stablecoin market. Institutional Bitcoin strategies also continued unabated, with Metaplanet approving a $5 billion capital injection into the US and Trump Media announcing that it would maintain its BTC reserves despite a $400 million share buyback plan. Today, en addition to Powell’s testimony, U.S. Consumer confidence index data will be followed.
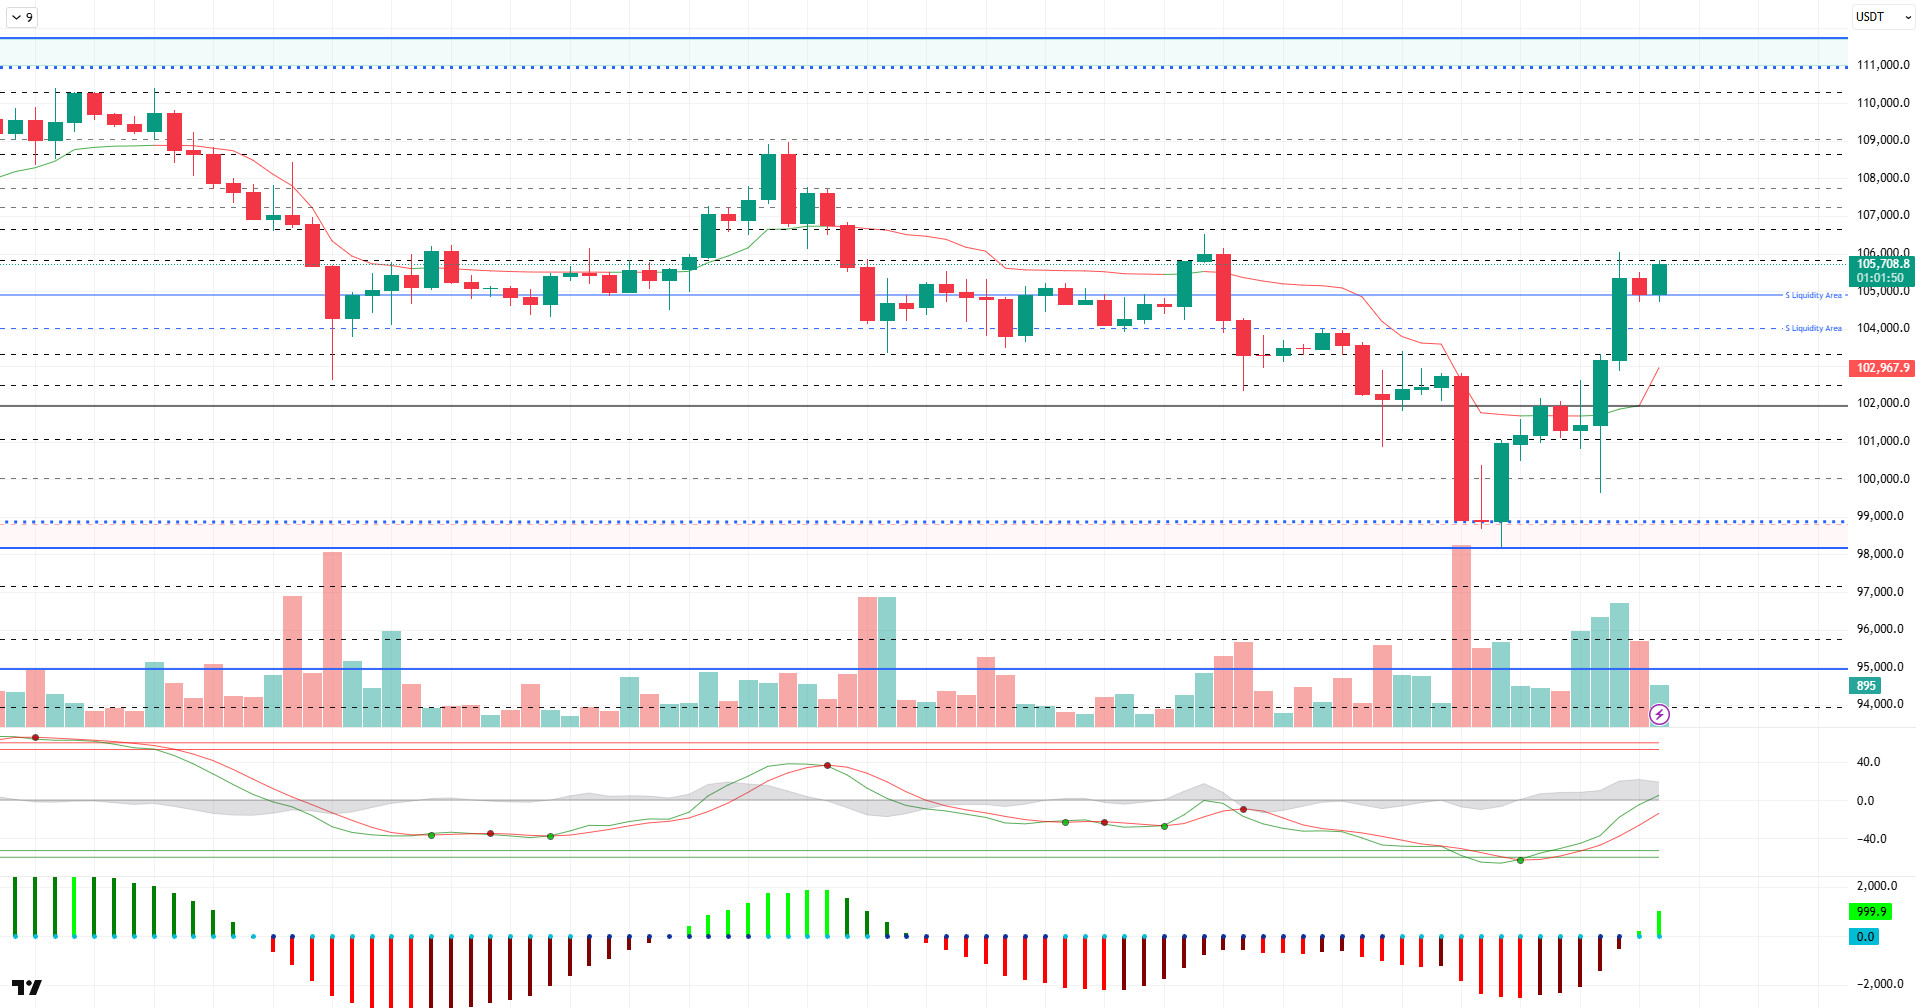
When we look at the technical outlook, the BTC price yesterday pinned the downward 99,700 level after a short consolidation phase between the 100,000-102,000 levels. Then, the price recovered rapidly and settled within the 105,000-106,000 band again with the effect of fundamental developments. At the time of writing, BTC continues to trade at 105,700.
On the technical indicators front, the Wave Trend (WT) oscillator confirmed the trend reversal en the ovelsold area, reaching the channel mid-band. The Squeeze Momentum (SM) indicator is also en positive territory again, supporting the upside. The Kaufman moving average is positioned at 103,000, below the price, another indicator supporting the rise.
When the liquidity data is analyzed, almost all of the buy trades were liquidated, while with the recent rise, the liquidation of the sell trades en the 104,000- 105,000 band also took place. The other sales tier is currently accumulated at 106,500-107,500 levels.
As a result, we have stated that the positive scenario created por fundamental developments and a possible compromise is the critical point for the price to recover. Indeed, en parallel with this, BTC technical and liquidity data, along with fundamental developments, emerged as factors supporting the rise. In the next process, it will be followed whether the rise will continue or not, and en case of a possible new attack, we will follow the liquidity zone again. On the other hand, if bearish movements and selling pressure continue, the 105,000 level will be followed as a reference support area again.
Supports 105,000 – 103,300 – 102,400
Resistances 106,000 – 107,300 – 109,000
ETH/USDT
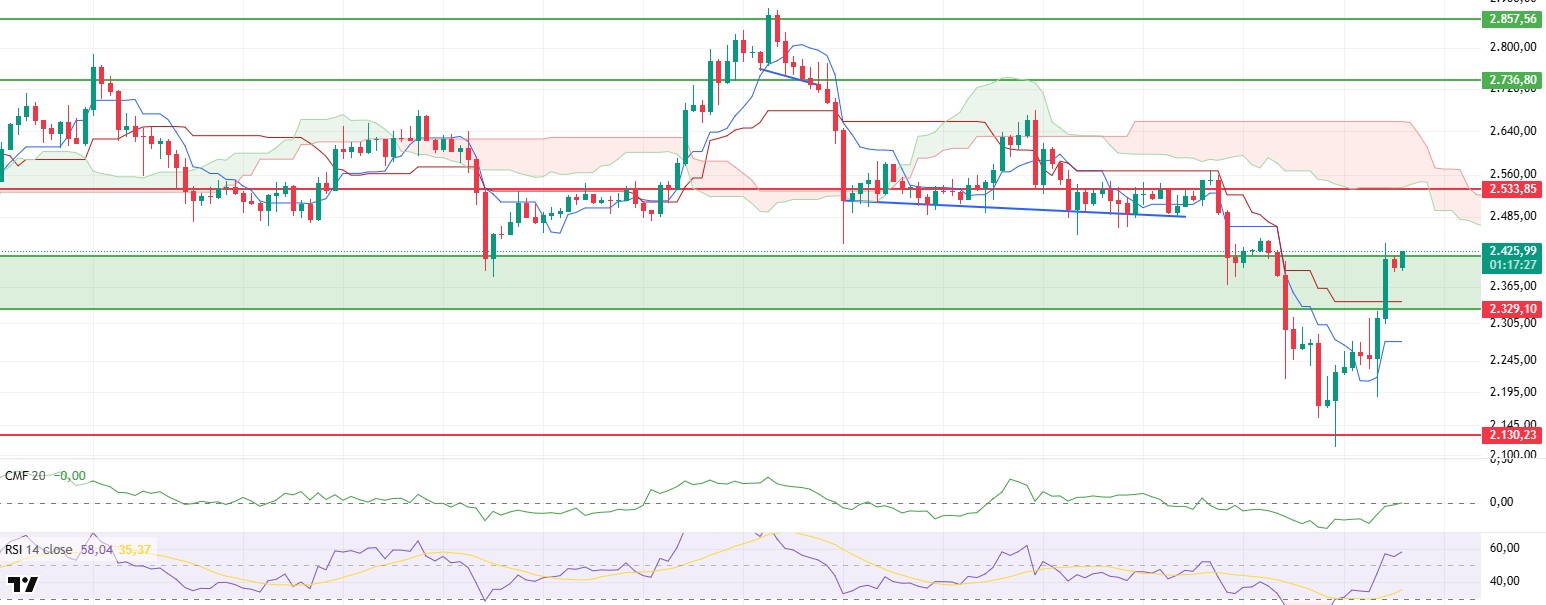
Following the ceasefire agreement reached between Israel and Iran yesterday evening, an upward momentum was observed en the cryptocurrency market with the decreasing geopolitical risk perception en global markets. ETH, which was positively affected por this rise, exhibited a strong recovery, first exceeding the $2,329 level and then the $2,400 region, which is considered psychologically important. The fact that the price gained these areas en a short time shows that the risk appetite en the market has started to increase again and investors are returning to speculative assets from the search for safe harbor.
When technical indicators are analyzed en detail, it is noteworthy that the Chaikin Money Flow (CMF) indicator has moved back into positive territory. This move suggests that the uptrend is not only price-based but also supported por increased liquidity inflows and new buying money inflows to the market have started. Especially with the decline en geopolitical tensions, the return of investors’ risk appetite makes the recovery en this indicator meaningful.
Likewise, the fact that the Relative Strength Index (RSI) indicator rose above the 50 level, accompanying the rise, indicates that the positive momentum is strengthening and the rise is proceeding el a technically healthy ground. However, the hidden negative divergence observed el the RSI should be considered as a warning signal that may trigger profit realizations or sudden retracements en the short term.
On the Ichimoku indicator, the fact that the price continues to remain above both tenkan and kijun levels indicates that the short-term positive outlook is maintained. However, the fact that the kumo cloud has not yet been overcome, and more importantly, the tenkan level is still below the kijun level, suggests that the uptrend has not turned into a confirmed strong trend and that technical caution is still required. This structure suggests that the uncertainty en the market is not completely over and that more time and volume is needed to confirm the uptrend.
In general terms, if the price stays above the green box region marked el the chart during the day, the upward trend may continue. This region also serves as a support area en the short term. In particular, the $2,329 level stands out as a critical support point both technically and psychologically. In case of possible negative geopolitical news flows or selling pressures that may occur en the market, the operation of this level will be important en terms of limiting declines. In the opposite scenario, the loss of this level may cause the bullish structure to deteriorate en the short term and a new wave of decline to begin.
Top of Form
Below the Form
Supports 2,329 – 2,130 – 2,029
Resistances 2,533 – 2,736 – 2,857
XRP/USDT
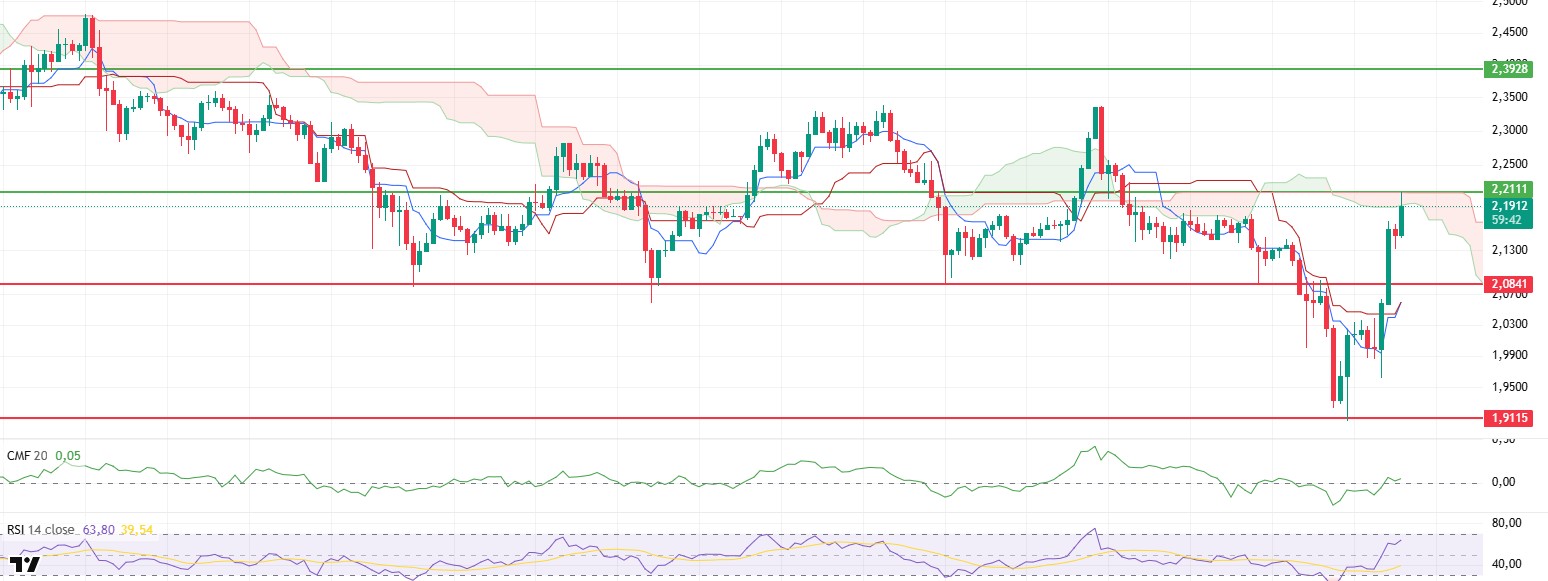
Following the news that the long-standing conflicts between Iran and Israel have ended, optimism has become evident en cryptocurrency markets as geopolitical tensions have decreased. With the effect of these developments, the XRP price has achieved a strong upward momentum and managed to rise above the $2.08 level. While exceeding this level technically means an upward breakout, it was observed that the price continued to rise with the increasing buying pressure during the night horas and reached the upper band of the sand cloud at the level of $2.21. This move indicates that short-term positive expectations are once again dominant en the market and investor confidence is starting to recover.
When technical indicators are analyzed en depth, it is noteworthy that the Chaikin Money Flow (CMF) indicator has switched back to the positive area and continues its upward trend en this region. This outlook reveals that the market has turned into a buying structure, liquidity inflows have increased and capital flow has started to develop en favor of XRP. The fact that investors turn to higher-risk assets, especially during periods of reduced geopolitical risks, should be considered as one of the main supporting factors en such rises.
In addition, the fact that the Relative Strength Index (RSI) indicator has climbed up to 64 levels por supporting the rise shows that the price action is technically el a healthy ground and the current momentum is gaining upward strength. The RSI’s persistence at these levels can be interpreted as a positive sign for the sustainability of the current rise. However, it is worth reminding that as the RSI approaches the overbought zone, the possibility of some correction en the coming days should be considered.
On the Ichimoku indicator front, the fact that the price rose to the upper band of the kumo cloud and the tenkan level crossed the kijun level upwards reveals that positive signals are gaining strength en the short-term technical outlook. This intersection is generally regarded as a buy signal and provides an important technical confirmation that the current structure may evolve into an uptrend. However, the fact that the price has not yet made a clear close el the kumo cloud does not mean that the trend has definitely changed and requires a cautious approach.
In general, the XRP price’s persistence above the upper band of the sand cloud at the $2.21 level stands out as a critical threshold for the continuation of the upward movement. If this level is breached en volume, it may be possible for the price to move towards higher resistance levels. However, if this zone cannot be overcome or rejected, short-term profit sales may be seen en the market and the price may turn towards lower support levels again. Therefore, intraday price closes and the course of technical indicators should be carefully monitored, especially the price behavior en the upper band of the kumo cloud will be decisive for the continuation of the trend.
Supports 2.0841 – 1.9115 – 1.7226
Resistances 2.2111 – 2.3928 – 2.5900
SOL/USDT
Fortune 500 firm Fiserv to launch stablecoin el Solana using Paxos and Circle infrastructure.
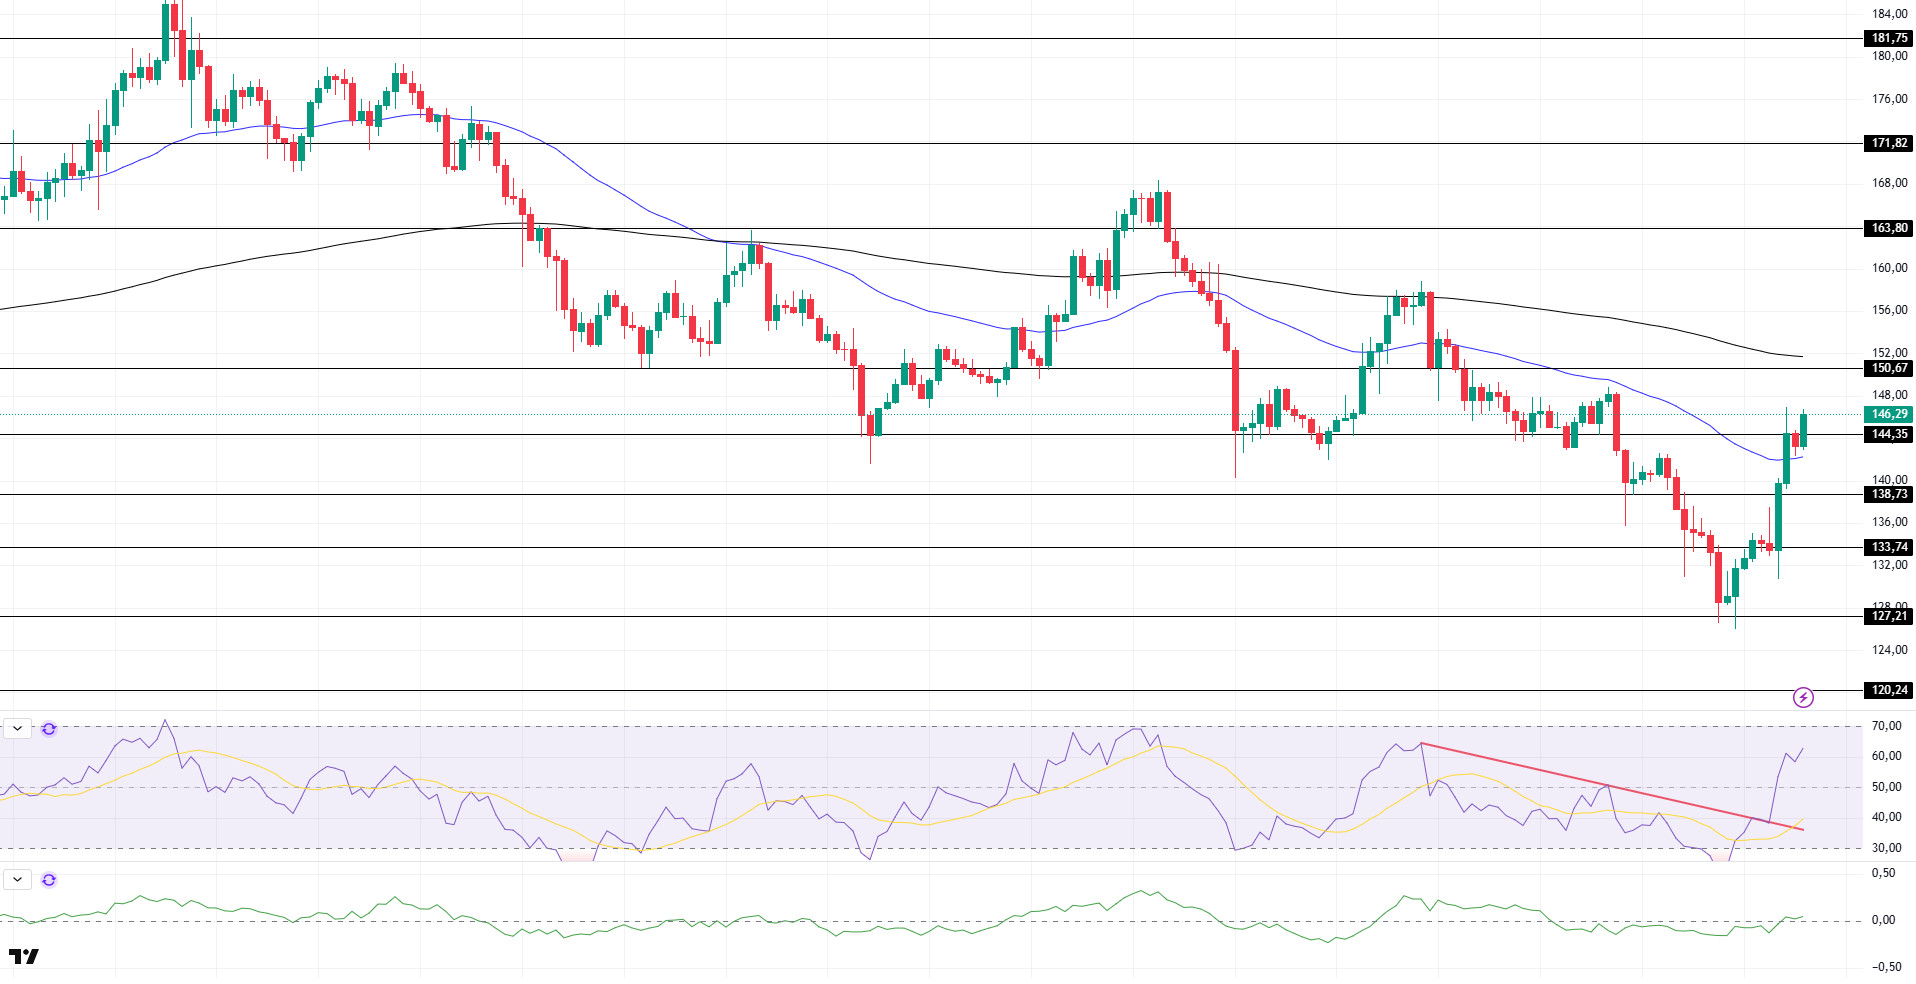
The SOL price kept pace with the crypto market and rallied. The asset accelerated from the strong support level of $127.21 and managed to stay above the $138.73 level. It also broke the 50 EMA (Blue Line) moving average upwards. It is currently testing the $144.35 level as resistance. If the upward movement continues, it may test the 200 EMA (Black Line) moving average as resistance. Candle closures below the $138.73 level may experience a retracement.
On the 4-hora chart, the 50 EMA continued to be below the 200 EMA. This suggests that the bearish trend may continue en the medium term. At the same time, the fact that the price is between both moving averages suggests that the market is currently en a short-term decision-making phase. Chaikin Money Flow (CMF-20) has started to be en the neutral zone; en addition, a decrease en inflows may move CMF into the negative zone. Relative Strength Index (RSI-14), el the other hand, has moved to the mid-level of the positive zone. On the other hand, it has also broken the downtrend that started el June 16 to the upside. This may bring bullishness. The $150.67 level stands out as a strong resistance point en the event of a rise due to macroeconomic data or positive news el the Solana ecosystem. If this level is broken upwards, the rise can be expected to continue. If there are pullbacks due to contrary developments or profit realizations, the $138.73 level can be tested. In case of a decline to these support levels, the increase en buying momentum may offer a potential bullish opportunity.
Supports 138.73 – 133.74 – 127.21
Resistances 144.35 – 150.67 – 168.80
DOGE/USDT
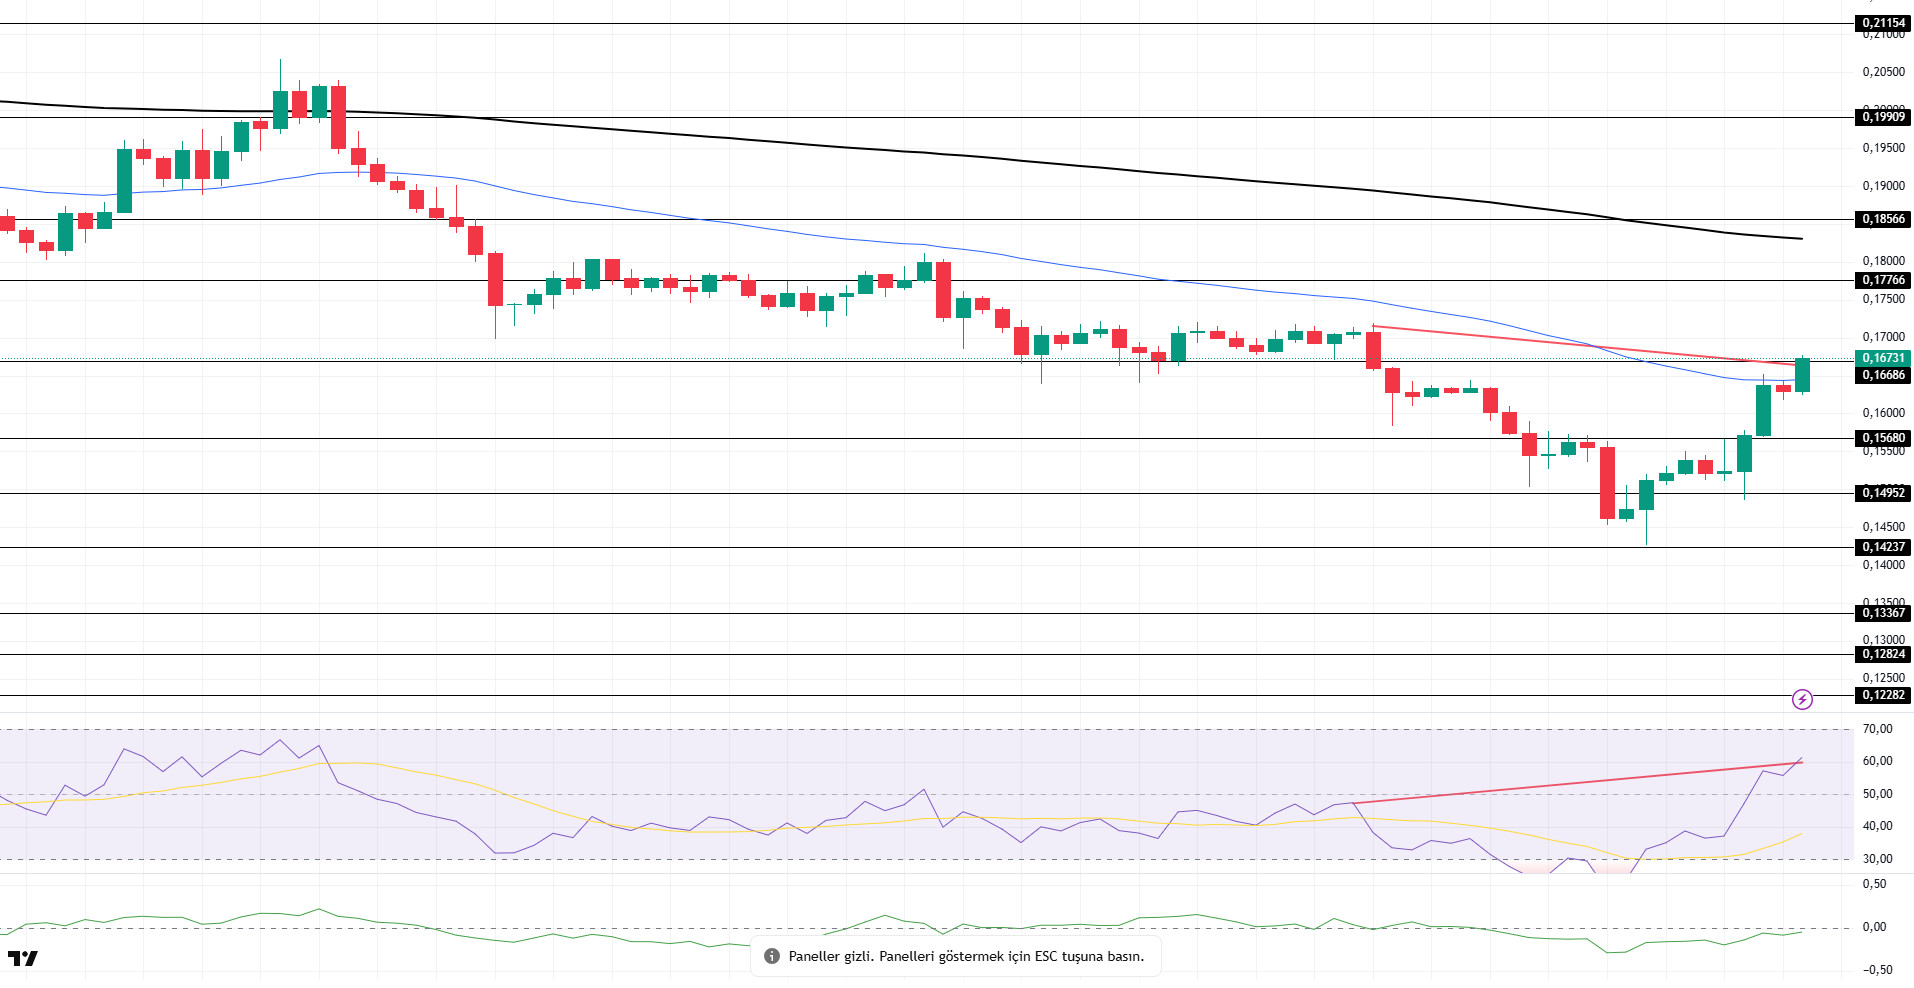
DOGE price rallied, gaining about 11%. Supported por strong support at $0.14237, the price accelerated from there and is currently testing the 50 EMA (Blue Line) moving average as resistance. The $0.17766 level should be followed el candle closes above the moving average.
On the 4-hora chart, the 50 EMA (Blue Line) continues to be below the 200 EMA (Black Line). This suggests that the asset is bearish en the medium term. The fact that the price is below the two moving averages signals that the asset remains bearish en the short term. Chaikin Money Flow (CMF-20) remained en negative territory. In addition, negative inflows may push CMF deeper into the negative territory. Relative Strength Index (RSI-14) moved into positive territory. However, there is a bearish mismatch. This may lead to a decline. The $0.16686 level stands out as a strong resistance zone en the upside en line with political developments, macroeconomic data or positive news flow en the DOGE ecosystem. In the opposite case or en case of possible negative news flow , the level of 0.15680 dollars can be triggered. In case of a decline to these levels, the increase en momentum may start a new bullish wave.
Supports 0.15680 – 0.14952 – 0.14237
Resistances 0.16686 – 0.17766 – 0.18566
Legal Notice
The investment information, comments and recommendations contained herein do not constitute investment advice. Investment advisory services are provided individually por authorized institutions taking into account the risk and return preferences of individuals. The comments and recommendations contained herein are of a general nature. These recommendations may not be suitable for your financial situation and risk and return preferences. Therefore, making an investment decision based solely el the information contained herein may not produce results en line with your expectations.