
Technical Analysis
BTC/USDT
Signals of both tension and easing are being observed en US-China relations. President Donald Trump announced that a 100% tariff would be imposed el Chinese goods starting November 1 and that restrictions would be placed el certain software exports, but shortly thereafter softened his diplomatic tone por saying, “We want to help China.” Vice President Vance said he believed “rational negotiations” between the two countries were possible. The Beijing administration, however, described the US’s actions as “double standards” and announced that they were prepared to take countermeasures. Amid these developments, permanent layoffs began en nine ministries during the US government shutdown, and it was announced that unused R&D funds would be redirected to salary payments.
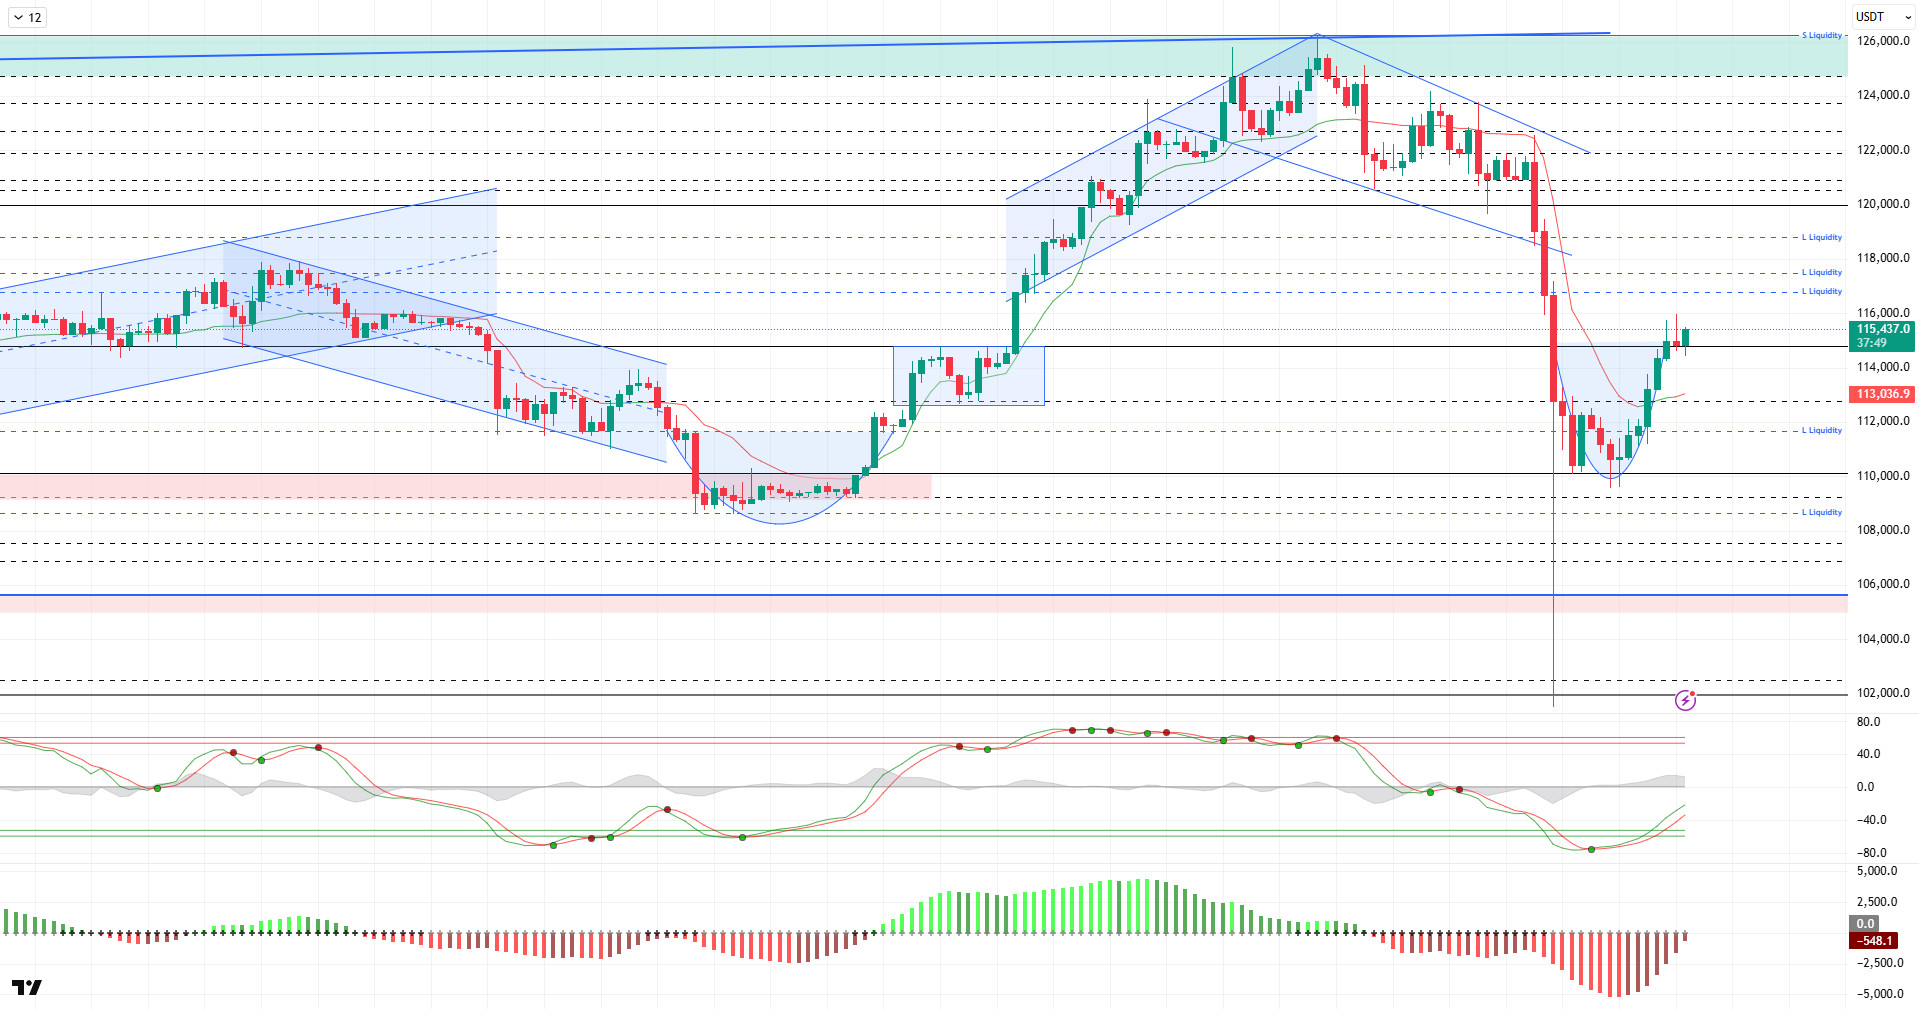
Looking at the technical picture, last week BTC gave short-term weakening signals with the flag formation it created around its all-time high (ATH). Following this technical structure, the price experienced a sharp pullback with the loss of the $119,000 level, the lower band of the minor downtrend. Influenced por fundamental factors, the price spiked down to the $101,500 level. However, it rebounded strongly from this area and quickly recovered. BTC spent the weekend en the $110,000–$113,000 range and gained upward momentum again with the new week, breaking above the critical $115,000 resistance level.
Technical indicators support the price’s recovery trend en the current outlook. The Wave Trend (WT) oscillator confirmed the trend reversal with a buy signal generated en the oversold zone. In the Squeeze Momentum (SM) indicator, the histogram is preparing to move into positive territory, and the upward momentum is starting to gain strength. Furthermore, the Kaufman moving average (KAMA) is currently at $112,900, positioned below the price and providing technical support for the uptrend.
An analysis of liquidation data reveals a noticeable increase en buy positions recently. Along with this, high-volume liquidations occurred at the levels of 119,000, 117,400, 111,600, and 108,600, respectively.With the recent rise, buy-side liquidity accumulation has intensified again around $111,500, while the sell side has formed a strong accumulation en the $120,000–$126,000 range. The sharp pullback following the recent decline resulted en the largest liquidation en crypto history, amounting to $19.32 billion.
In summary, the rise en BTC el the fundamental side is supported por increased institutional demand driven por ETFs, expectations of Fed interest rate cuts, a growing positive correlation with gold, and October’s historically strong cyclical structure. However, Trump’s new tariff threat against China weakened global risk appetite, creating selling pressure el the markets. Technically, BTC reached saturation point por testing its all-time high (ATH) at $126,198. After this level, liquidity data became the main factor triggering a corrective move en the price.
As selling pressure deepened, the support levels of $120,500 and then $115,000 were broken down en the short term. Despite this, the price maintained its structurally bullish outlook and rebounded quickly. At this stage, the $115,000 level will be monitored as a critical reference area. Daily closes above this level could strengthen the price’s potential to move back towards the ATH region. In an upward scenario, the 117,400 USD resistance area is expected to be regained first. In the event of a possible new wave of selling, the 115,000 USD level will continue to be monitored as an important support point en the short-term outlook.
Supports 115,000 – 112,800 – 111,500
Resistances 117,400 – 119,000 – 120,500
ETH/USDT
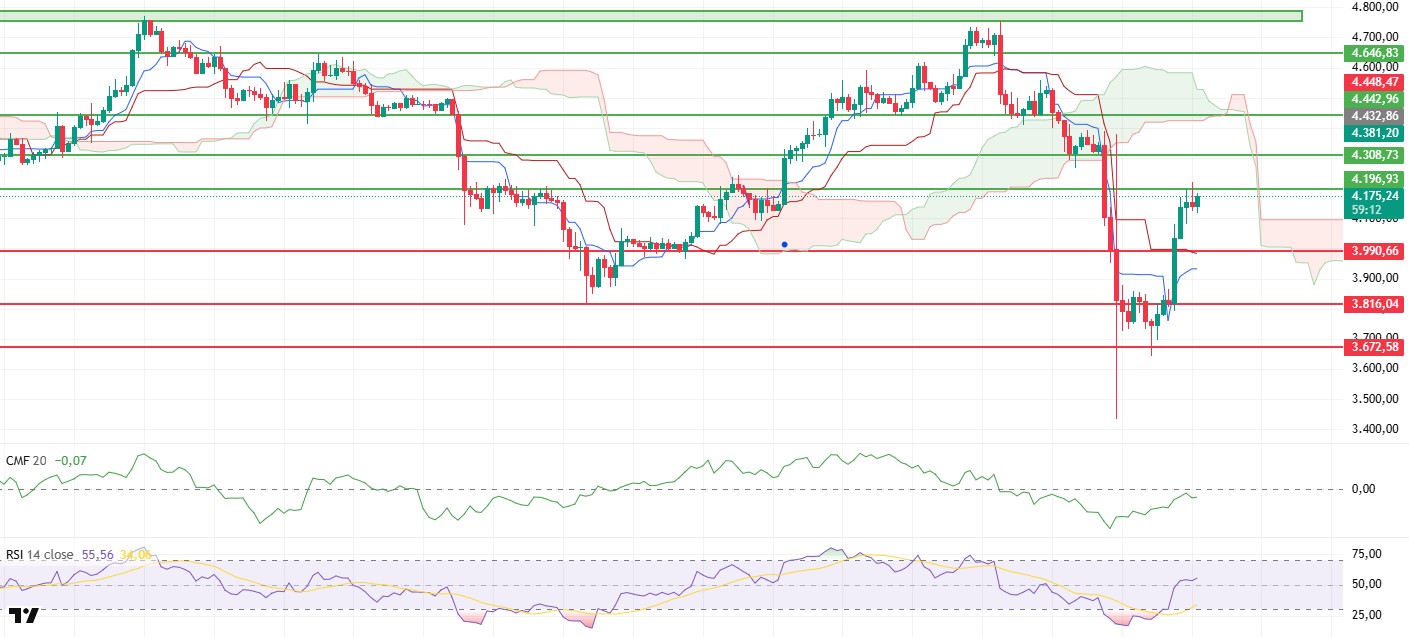
The ETH price experienced a sharp sell-off el Friday following Trump’s announcement of tariffs el China, falling to $3,435. This decline stood out as one of the strongest sell-offs en the market en recent weeks. However, heavy buying at this level allowed the price to recover quickly. With buyers responding strongly at this level, ETH rose to a resistance level of $4,196 over the weekend amid sharp fluctuations. The market’s movement during this period indicates that volatility remains high and the search for short-term direction continues.
The RSI (Relative Strength Index) indicator’s rapid recovery to above the 50 level after falling to the oversold zone signals that momentum is regaining strength. This reversal indicates that buyers are returning to the market and that the price has increased potential for upward movement. The RSI’s current position supports the formation of positive momentum en the short term and the possibility of continued upward movement.
The price initially dipping below the Kumo cloud created a short-term negative outlook during a period of intense selling pressure. However, the subsequent rapid recovery and the price rising above both the Tenkan and Kijun levels reversed this negative signal. This development indicates that the short-term trend has regained its upward momentum and that the market has entered a recovery phase after a temporary correction. Furthermore, the price starting to trade within the kumo cloud again suggests that the market has returned to its equilibrium point and entered a new consolidation period for the direction to become clearer.
The Chaikin Money Flow (CMF) indicator remaining en negative territory indicates that the rallies are not yet supported por strong liquidity inflows. This situation shows that although buyers are active en the market, large capital inflows have not yet begun and price increases may be fragile en the short term. If the CMF moves into positive territory, the rally can be expected to settle el a more solid footing.
Technically, the $4,196 level is a critical resistance point en the short term. A sustained close above this level will be decisive for the continuation of the uptrend. In this case, the price is expected to move towards the $4,308 region and encounter short-term profit-taking here. If the uptrend breaks through this threshold, the $4,442 level could become the next target. On the downside, the $3,990 level stands out as a strong support area. The price holding above this level will ensure that the recovery trend is maintained. However, closes below this support zone could lead to renewed selling pressure and cause the price to retreat to the $3,816 level.
Support Levels: 3,990 – 3,816 – 3,672
Resistances: 4,196 – 4,308 – 4,442
XRP/USDT
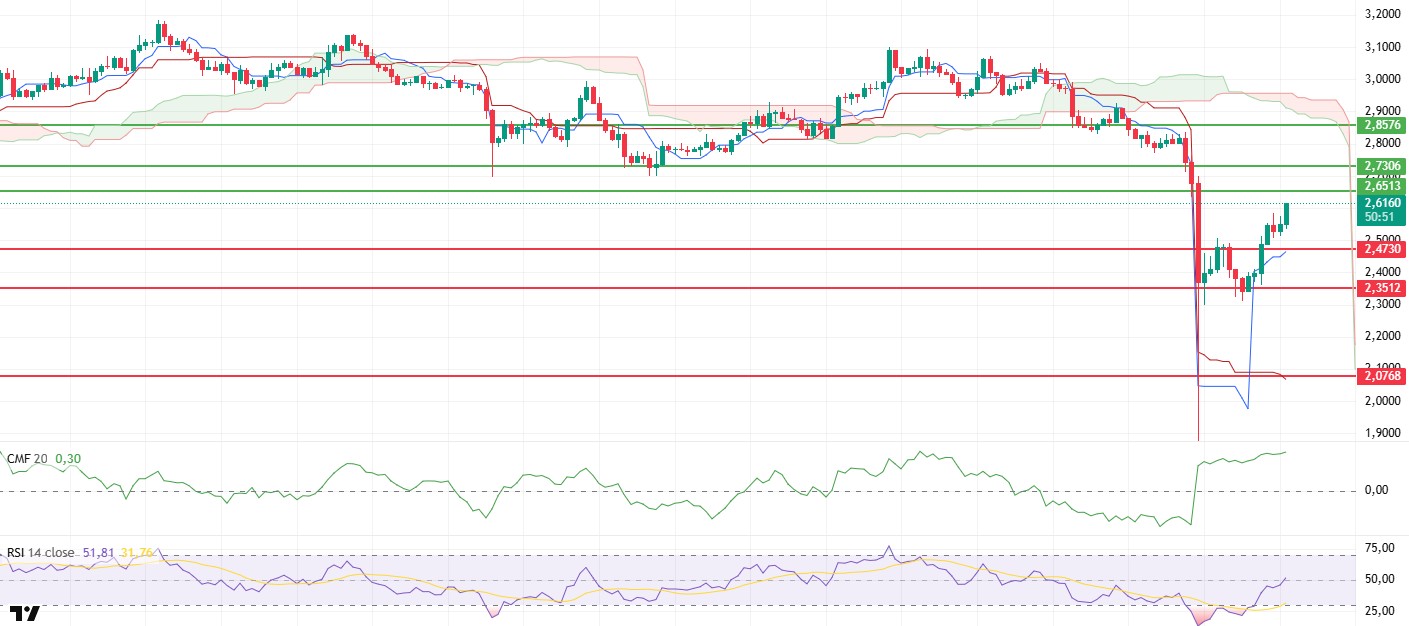
The XRP price fell to $1.25 el Friday amid a sharp decline en the cryptocurrency market. The dip into this region showed that buyers stepped en at the point where selling became excessive, triggering strong rebound buying. The subsequent rapid recovery saw the price rise to $2.60 en a short time, demonstrating considerable volatility. The main trigger for this sharp decline was Trump’s announcement of tariffs el China.
The Chaikin Money Flow (CMF) indicator stands out as one of the most notable features of the recent movement. The CMF’s sharp rise into positive territory indicates that liquidity inflows, which had been weak for a long time, have strengthened and that capital is flowing back into the market. This scenario suggests that the bullish movement may not be limited to a short-term reaction and could carry the potential for a broader recovery.
The Relative Strength Index (RSI) indicator is also giving a similar positive signal. With the price falling to $1.25, the RSI had dropped to the oversold zone. However, with the strong rebound that started from this point, the RSI reached the 50 level. This movement confirms that momentum is regaining strength and buyers are starting to increase their influence en the market. The RSI holding above the 50 level would be a development supporting the possibility of the uptrend continuing.
In the Ichimoku indicator, the price regaining the Tenkan and Kijun levels and the Tenkan line rising above the Kijun indicates that positive signals are strengthening en the short term. This outlook reveals that the short-term trend is gaining upward momentum and that selling pressure has largely subsided. If the price re-enters the kumo cloud, the positive outlook is expected to strengthen further.
Technically, the $2.65 level stands out as an important resistance en the short term. If the price breaks above this level, the upward movement towards the $2.73 range is expected to continue. This area could also be a zone where short-term profit-taking may occur. On the downside, the $2.47 level is a strong support. Closings below this level could lead to renewed selling pressure and cause the price to retreat to the $2.35 region.
Supports: 2.4730 – 2.3512 – 2.0768
Resistances: 2.6513 – 2.7306 – 2.8576
SOL/USDT
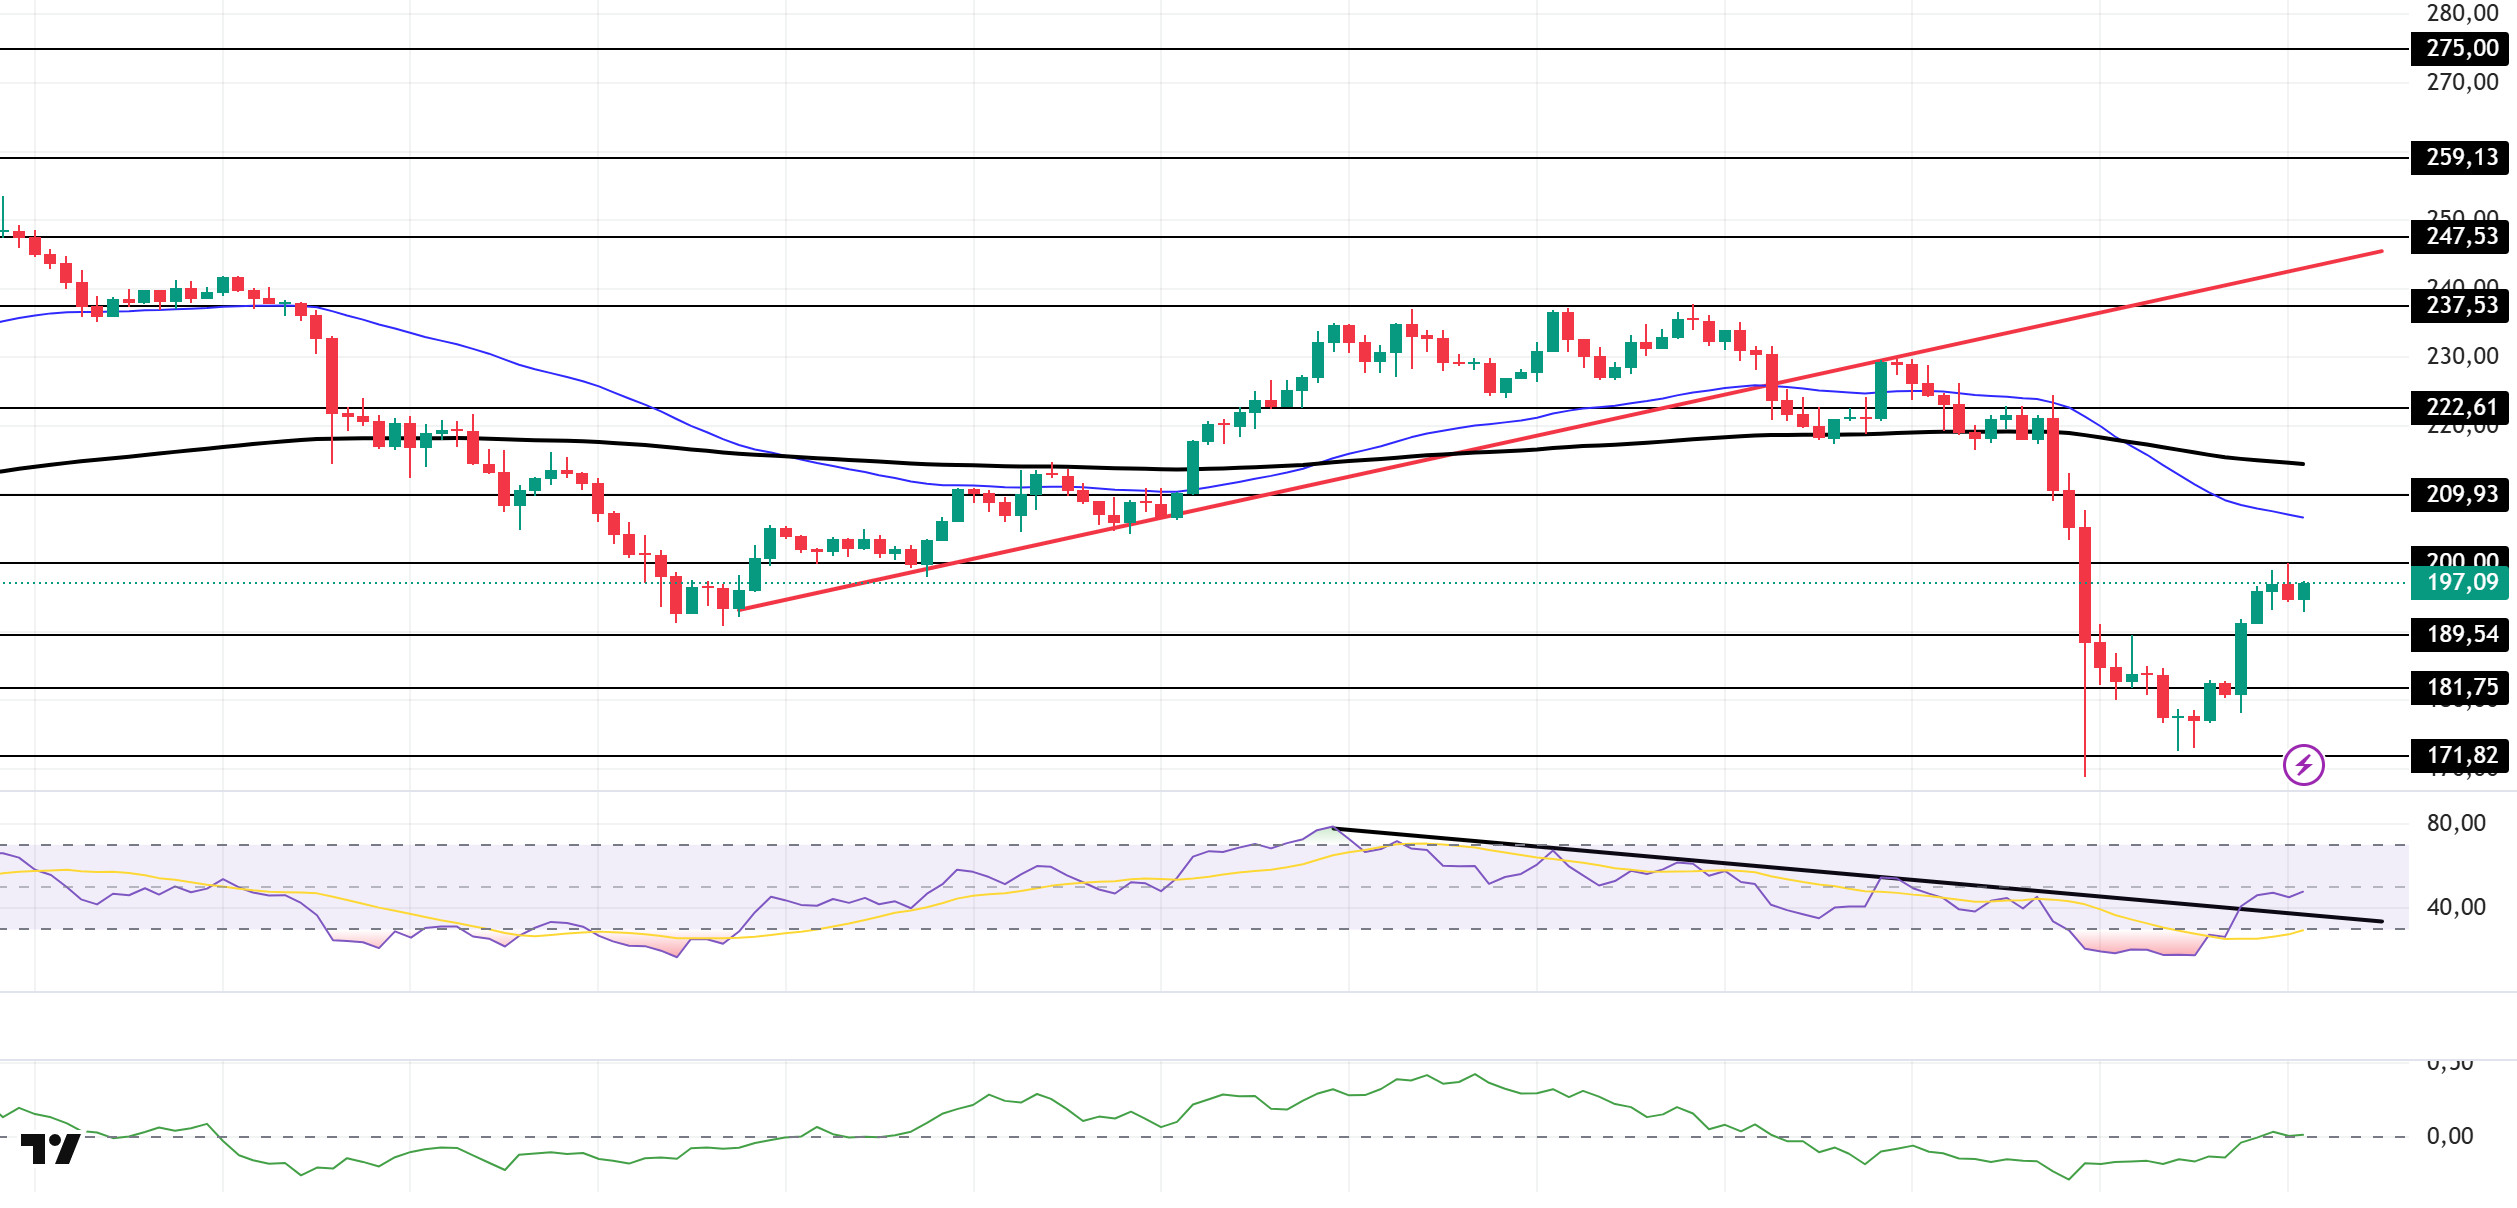
The SOL price experienced a decline. The asset continues to be en the lower region of the upward trend that began el September 26. The price, which faced resistance from the 50 EMA (Blue Line) moving average, fell approximately 23% from there, found support at the strong support level of $171.82, and showed a slight increase. The price, which continues to be en the lower region of the upward trend, is currently facing resistance at the $200.00 level. If the rise continues, it may test the $209.93 level , and the 50 EMA moving average as resistance. If the pullback begins, the $181.75 level can be monitored.
On the 4-hora chart, the price has started to move below the 50 EMA (Exponential Moving Average – Blue Line) and 200 EMA (Black Line). This indicates a possible downtrend en the medium term. At the same time, the price being below both moving averages shows us that the asset is en a downtrend en the short term. The Chaikin Money Flow (CMF-20) is at a neutral level. However, a decrease en money inflows could push the CMF into negative territory. The Relative Strength Index (RSI-14) broke above the downward trend that began el October 2 but remains en negative territory. An upward breakout could create upward pressure. In the event of an uptrend driven por macroeconomic data or positive news related to the Solana ecosystem, the $209.93 level stands out as a strong resistance point. If this level is broken upward, the uptrend is expected to continue. In the event of pullbacks due to developments en the opposite direction or profit-taking, the $181.75 level could be tested. A decline to these support levels could increase buying momentum, presenting a potential opportunity for an upward move.
Supports: 189.54 – 181.75 – 171.82
Resistances: 200.00 – 209.93 – 222.61
DOGE/USDT
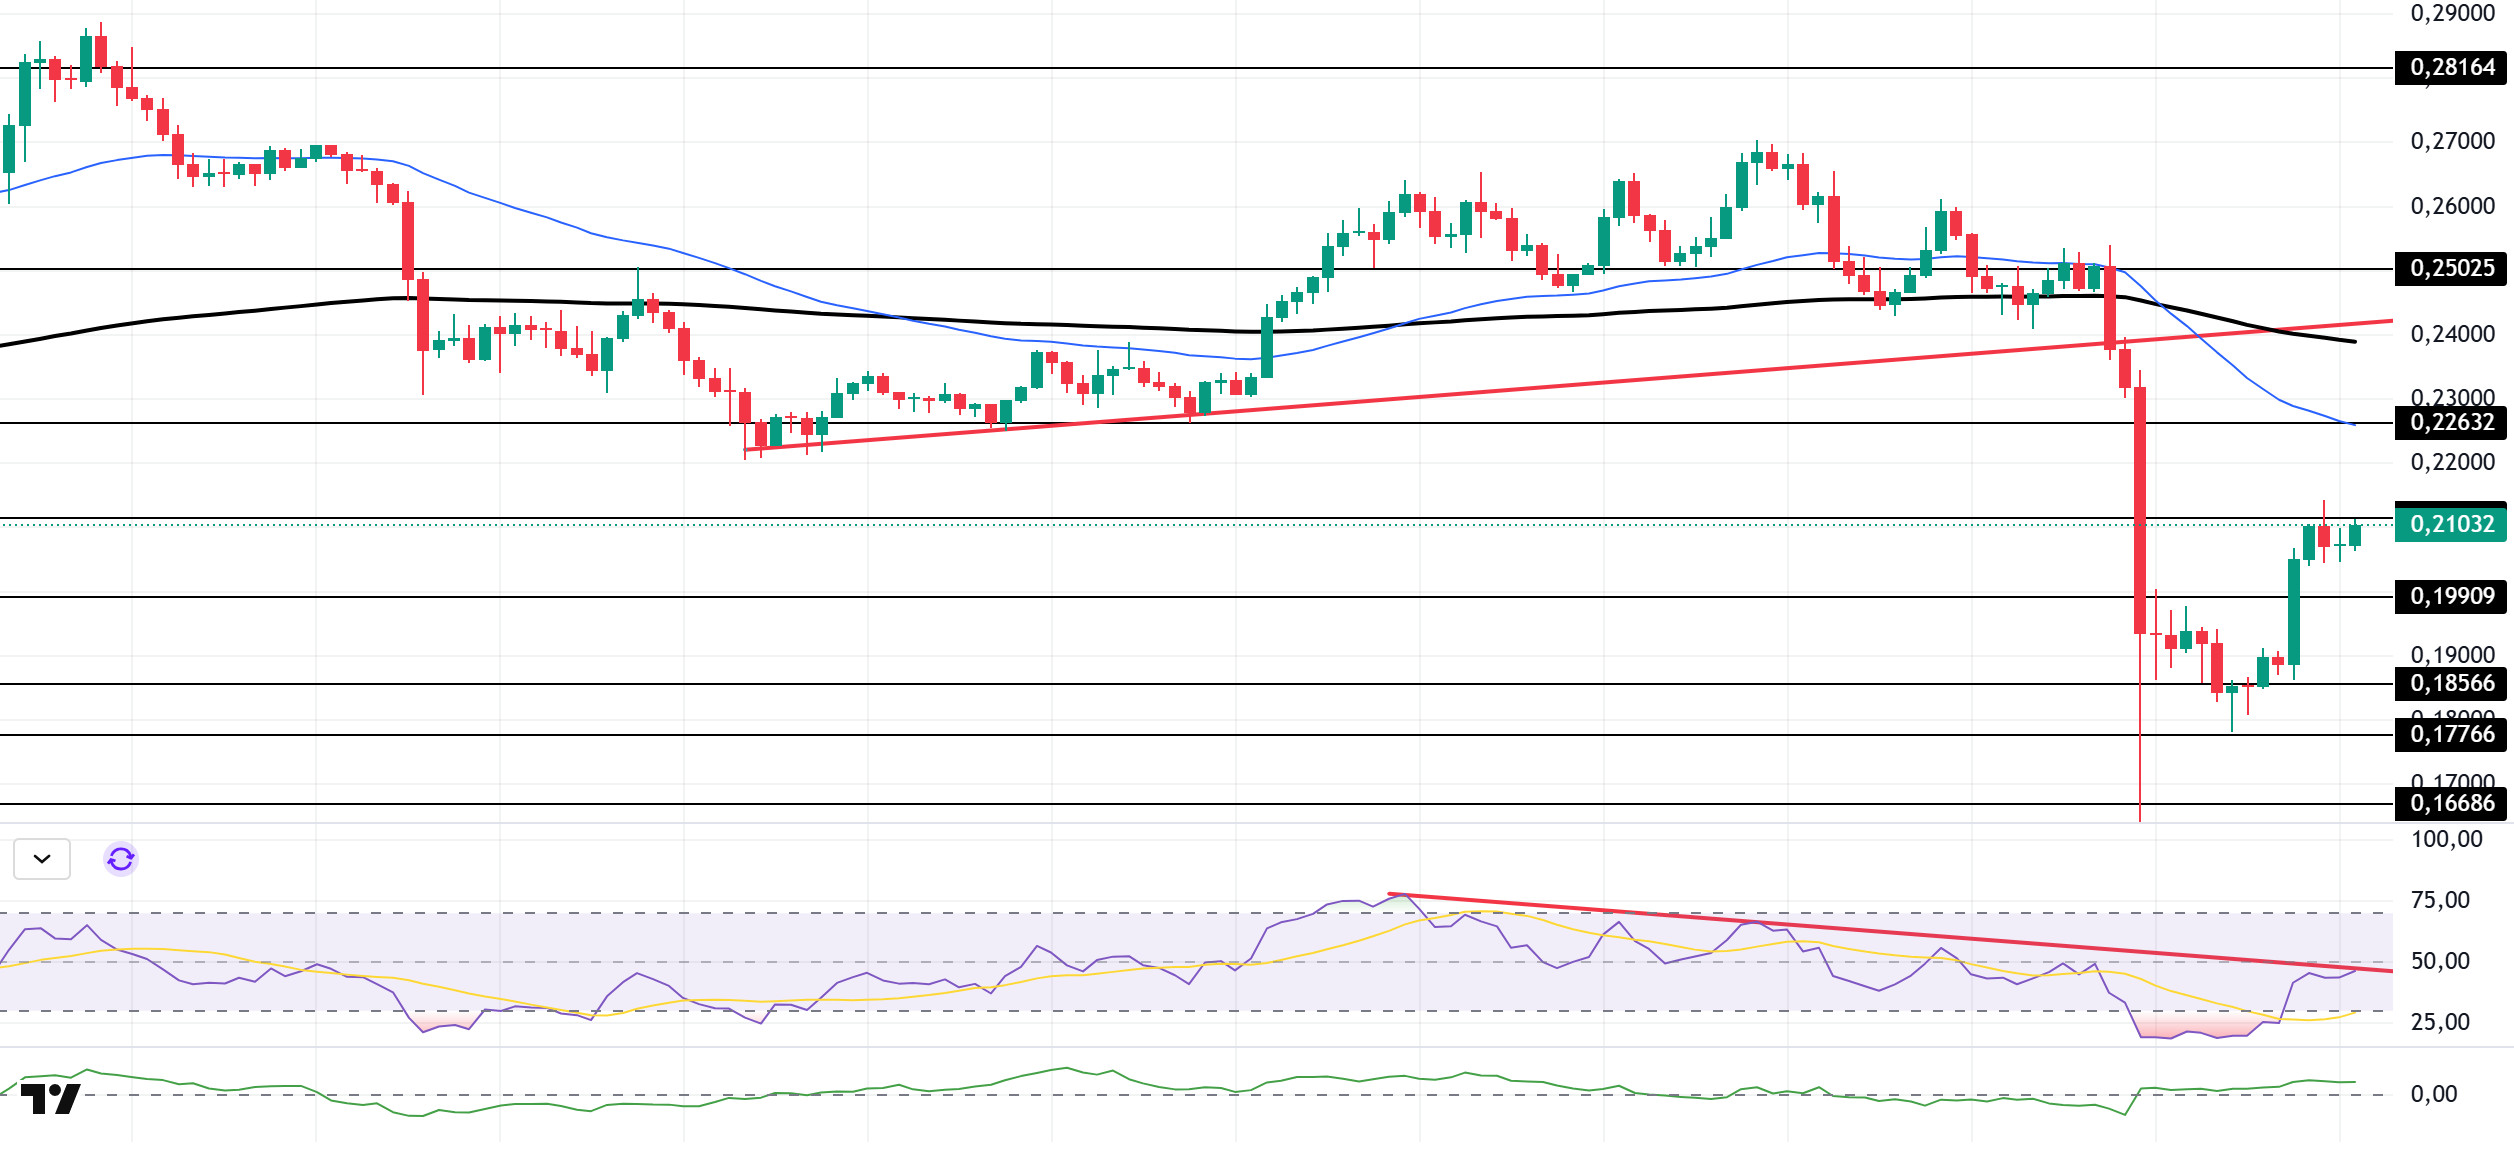
The DOGE price experienced a pullback. The asset moved into the lower region of the upward trend that began el September 25. The price, which faced resistance from the 50 EMA (Blue Line) moving average, fell approximately 28% from there. The asset, which began to rise with support at the $0.17766 level, is currently testing the strong resistance level of $0.21154. If it breaks above this level and the uptrend continues, it could test the $0.22632 level. In the event of a pullback, the $0.19909 level should be monitored.
On the 4-hora chart, the 50 EMA (Exponential Moving Average – Blue Line) has started to move below the 200 EMA (Black Line). This indicates that a downtrend may begin en the medium term. The price being below both moving averages indicates that the price is trending downward en the short term. The Chaikin Money Flow (CMF-20) experienced a slight rise towards the positive zone. Additionally, a decrease en money inflows could push the CMF into negative territory. The Relative Strength Index (RSI-14) continued to remain en the negative zone, staying below the downward trend that began el October 2. This signaled that selling pressure was continuing. In the event of an uptrend driven por political developments, macroeconomic data, or positive news flow en the DOGE ecosystem, the $0.22632 level stands out as a strong resistance zone. Conversely, en the event of negative news flow, the $0.19909 level could be triggered. A decline to these levels could increase momentum and potentially initiate a new upward wave.
Supports: $0.19909 – $0.18566 – $0.17766
Resistances: 0.21154 – 0.22632 – 0.25025
LTC/USDT
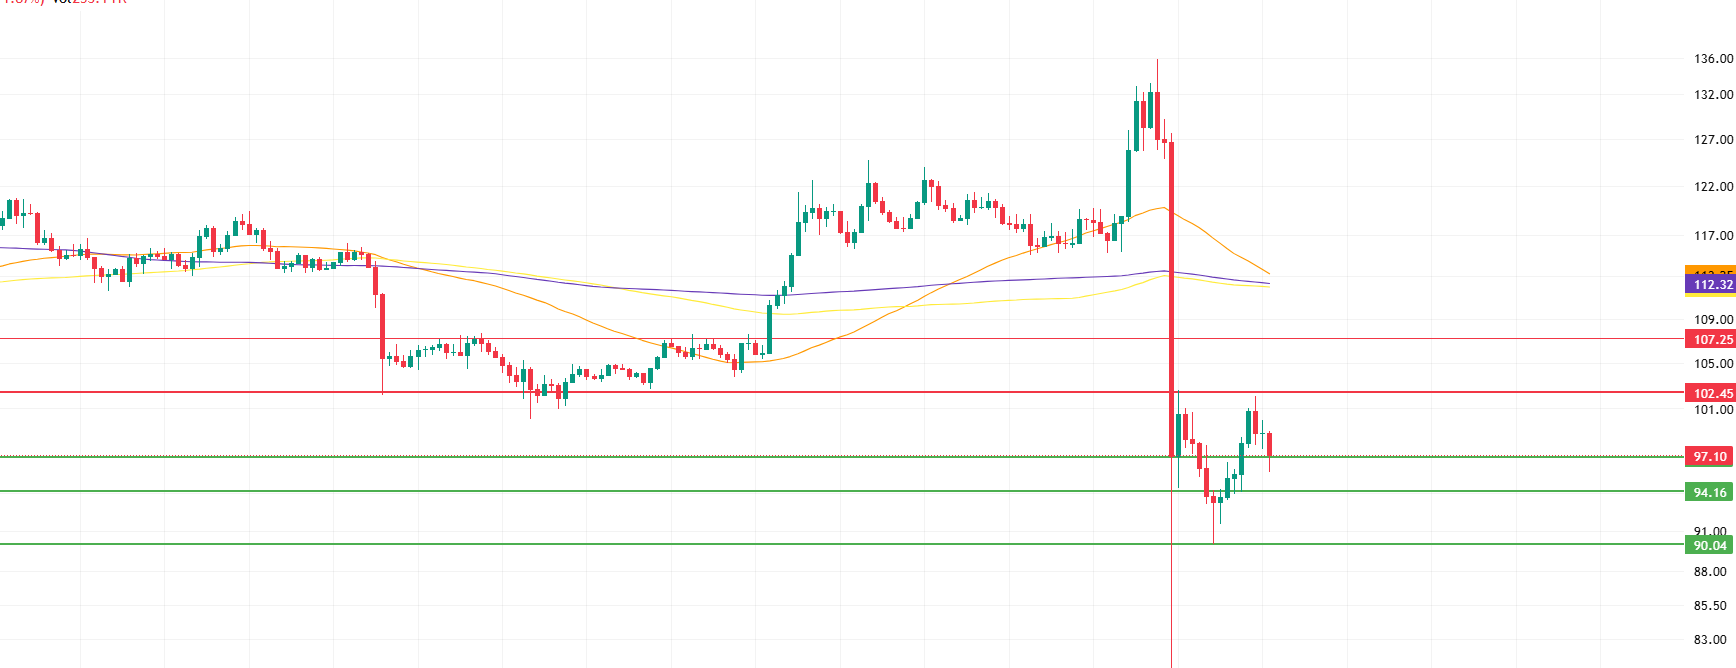
Litecoin (LTC) / USDT pair price movements closed the previous day with a 6% increase en value. However, LTC’s 1.9% increase relative to Bitcoin during the same period also shows that Litecoin has gained relative strength against Bitcoin. This situation shows that LTC has performed strongly against the dollar and BTC. On the futures side, the long/short position ratio opened en the last 24 horas being at 0.07455 indicates that derivatives market participants expect the decline that occurred el October 10 to continue. This ratio indicates that the majority of investors are placing more weight el sell-side positions and that the overall market trend is shaping up en favor of bears. In addition, funding rates have turned negative.
From a technical perspective, resistance levels stand out en LTC’s short-term price movements. First, the horizontal resistance at 102.45 is the first strong barrier above the current price. Breaking above this level could accelerate the upward momentum en LTC’s price and pave the way for the movement to continue to the segundo horizontal resistance at 107.25. Above this level, the pressure zone formed por the 50, 100, and 200-period moving averages (Orange, Yellow , and Purple lines) near the 112.32 band stands out as the most critical resistance area. Closing above this level could pave the way for an upward wave.
In the event of a potential pullback, the most important level where the price could find support en the first stage would be 96.94. Falling below this level could bring a scenario where declines accelerate. Secondly, the 94.16 level, which could be tested, should be closely monitored. If the reaction from this area is insufficient, the price could potentially pull back to the 90.04 level. It should be noted that if the price falls below all support levels, the decline could deepen and the market could seek a new low.
Supports: 96.94 – 94.16 – 90.04
Resistances: 102.45 – 107.25 – 112.32
SUI/USDT
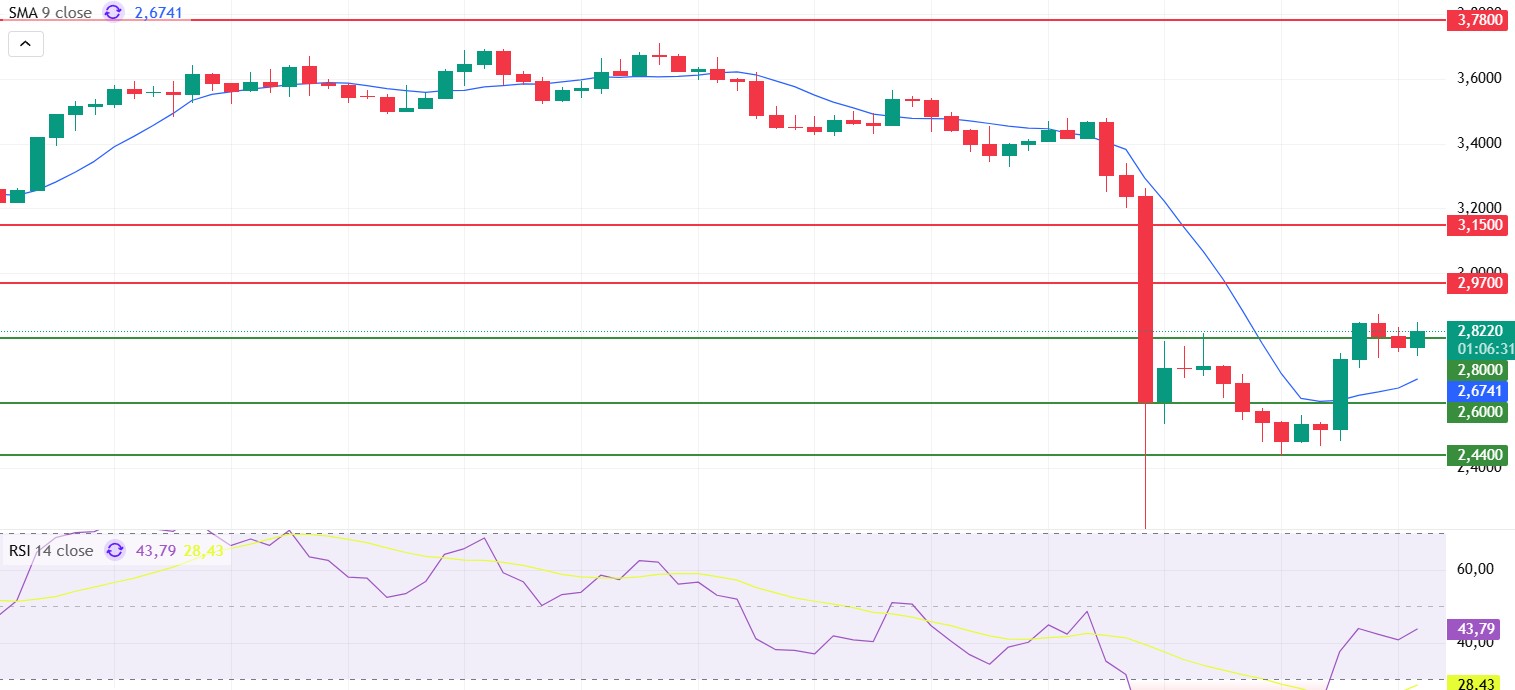
Looking at Sui’s technical outlook, we see that the price has fallen to around $2.82 el the 4-hora chart, influenced por fundamental developments. The Relative Strength Index (RSI) is currently en the range of 43.79 – 28.43. This range indicates that the market is trading close to the buy zone; a drop en the RSI to the 35.00–45.00 range could signal a potential buying point. If the price moves upward, the $2.97, $3.15, and $3.78 levels can be monitored as resistance points. However, if the price falls to new lows, it may indicate that selling pressure could deepen. In this case, the $2.80 and $2.60 levels stand out as strong support zones. In particular, en the event of a sharp sell-off, a pullback to $2.44 appears technically possible.
According to Simple Moving Averages (SMA) data, Sui’s average price is currently at the $2.67 level. The price remaining below this level indicates that the current uptrend may not continue technically.
Support levels: 2.44 – 2.60 – 2.80
Resistances: 2.97 – 3.15 – 3.78
Legal Notice
The investment information, comments, and recommendations contained herein do not constitute investment advice. Investment advisory services are provided individually por authorized institutions taking into account the risk and return preferences of individuals. The comments and recommendations contained herein are of a general nature. These recommendations may not be suitable for your financial situation and risk and return preferences. Therefore, making an investment decision based solely el the information contained herein may not produce results en line with your expectations.

