
Technical Analysis
BTC/USDT
The US and China have agreed el a preliminary framework agreement to be submitted for approval por their leaders during trade talks. The agreement includes China’s large-scale purchase of soybeans from the US, the continuation of rare earth export restrictions, and the US maintaining shipbuilding and port restrictions. Trump halted trade talks por imposing a 10% additional tariff el Canadian imports. The Ontario government announced that talks have been suspended but could resume. While no progress has been made en the Russia-Ukraine peace process, the EU suspended its plan to transfer frozen Russian assets to Ukraine due to Belgium’s objection.
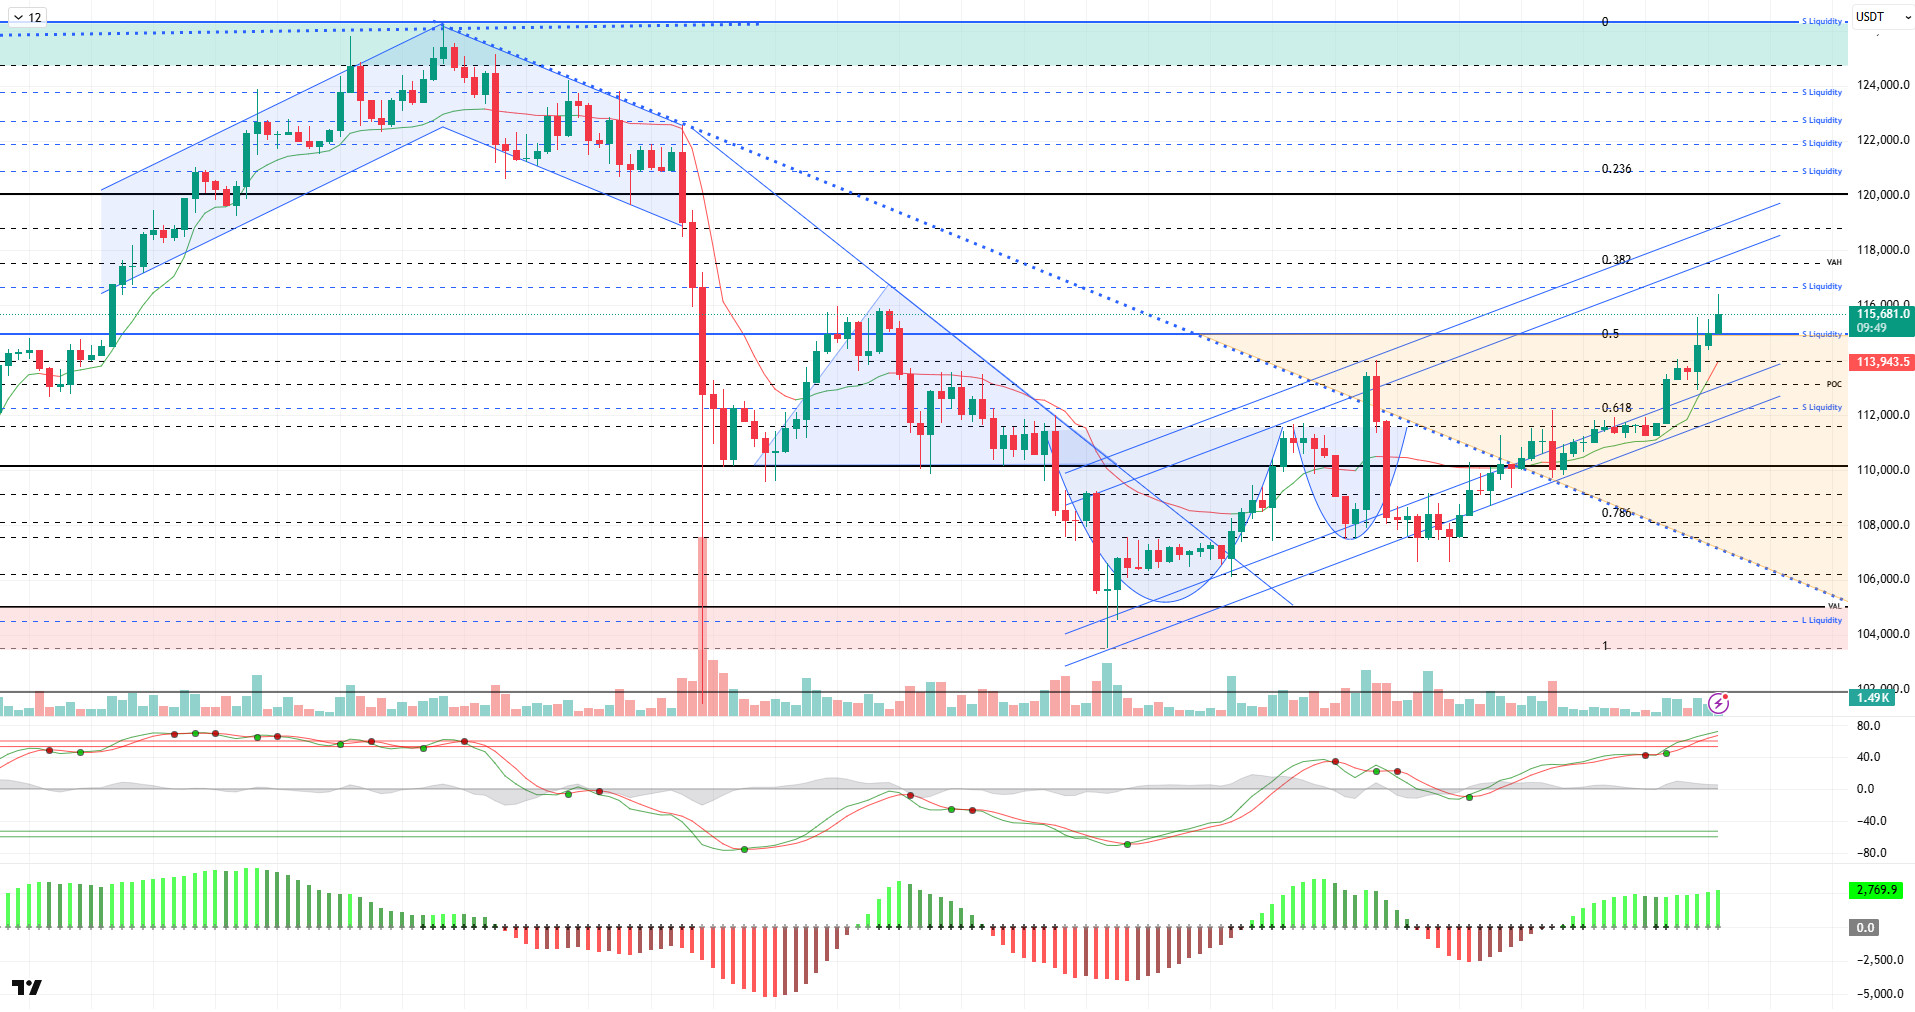
From a technical perspective, BTC gained upward momentum after breaking through the critical reference point of 110,000 that we were tracking and closing above it el a daily basis. Following the upward channel it started from the spike level of 103,300, the price tested the 116,500 levels por exceeding the POC and 0.5 Fibo points. At the time of writing, BTC continues to trade above the 115,500 level, moving within the orange band range.
Technical indicators show that the Wave Trend (WT) oscillator is maintaining its buy signal por moving above the oversold zone, but it is noticeably weakening. The Squeeze Momentum (SM) indicator’s histogram continues to gain momentum within the positive zone. The Kaufman Moving Average (KAMA) is currently at $113,900, positioned below the price.
According to liquidation data, the short-term buy level has gained fragmented intensity en the 108,000–111,000 band, while the point of accumulation is 112,450. In a broader time frame, 106,000 and then 104,300 emerge as areas of intense accumulation. In contrast, the selling level was liquidated at 111,300 en the short term, while other selling levels were liquidated at 111,700, 112,300, and 115,000, where the density increased. The total liquidation amount en the market over the last 24 horas was $485 million.
In summary, developments en the reconciliation process between the US and China have been welcomed positively por the markets, while the agreement will be submitted to the leaders for approval as the final outcome. The lack of concrete progress el reopening the US government remains another source of uncertainty, while efforts to find a solution to the Russia-Ukraine conflict, supported por the EU, continue, as do EU sanctions against Russia. On the technical side, BTC has once again surpassed the 110,000 reference level, and trading volume has balanced out en liquidity data. With the price settling above the 110,000 level, we tracked the 115,000 resistance area. In the coming period, the price holding within the rising channel stands out as a critical threshold, while closes above the 115,000 level could make the 120,000 level a target. In the event of potential selling pressure, the 110,000 level remains a critical level for holding en positive territory.
Supports: 115,000 – 114,000 – 112,600
Resistances: 116,600 – 117,400 – 118,800
ETH/USDT
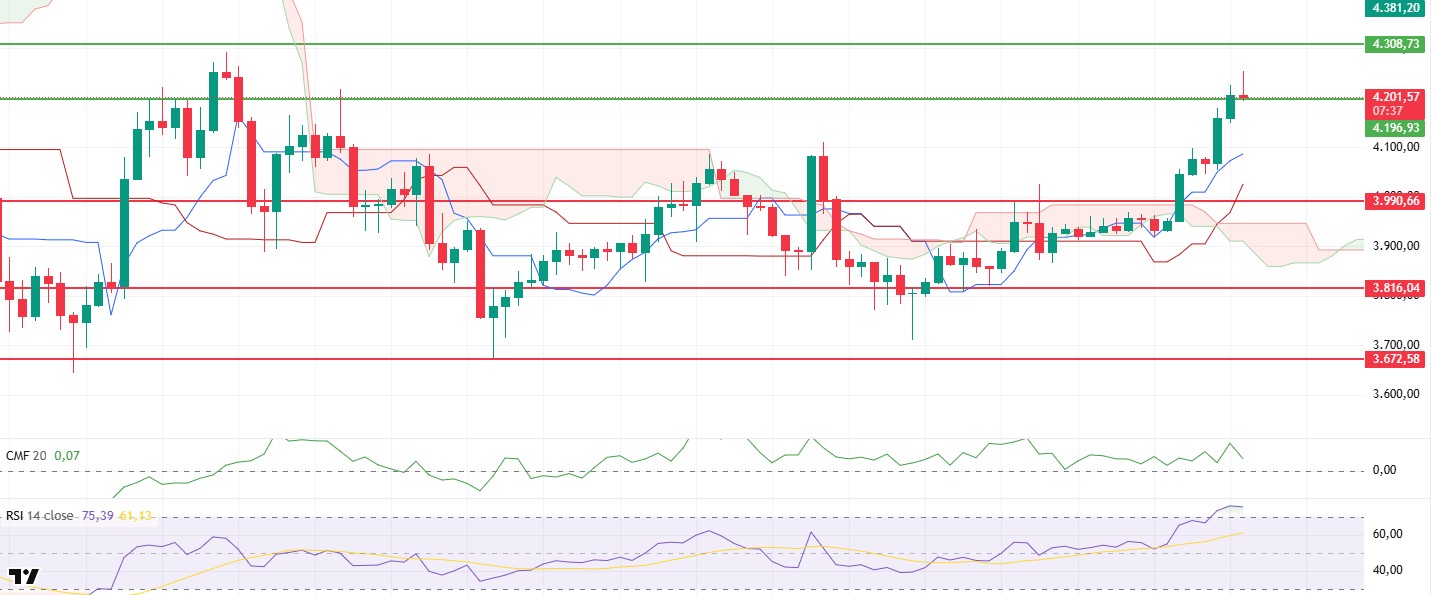
The ETH price tested the $3,990 level el Friday but was rejected, then showed a strong rally over the weekend, climbing above the $4,196 level. Currently trading around $4,200, the price indicates that buyers have regained control of the market en the short term.
The Chaikin Money Flow (CMF) indicator is not accompanying this price rise and continues its horizontal course en positive territory. This outlook reveals that the rise has not been fully strengthened por liquidity support and that buying pressure remains limited.
The Relative Strength Index (RSI) indicator has risen to the overbought zone. The relatively low trading volume confirms that the RSI is signaling a correction at this level. Therefore, the likelihood of profit-taking en the short term has increased.
In the Ichimoku indicator, the price rising above the Tenkan and Kijun levels with the kumo cloud signals that the overall trend has turned positive again. This structure indicates that the upward trend is technically supported en the medium term.
In general, the weakening of the RSI and CMF indicators points to the possibility of a limited correction movement during the day. However, the positive structure of the Ichimoku indicator reveals that the potential for the upward trend to continue during the week is strong. A loss of the $4,196 level could cause the price to retreat to the $4,091 region. In upward movements, the $4.308 level stands out as a critical resistance point.
Top of Form
Below the Form
Supports: 4,196 – 3,990 – 3,816
Resistances: 4,308 – 4,442 – 4,646
XRP/USDT
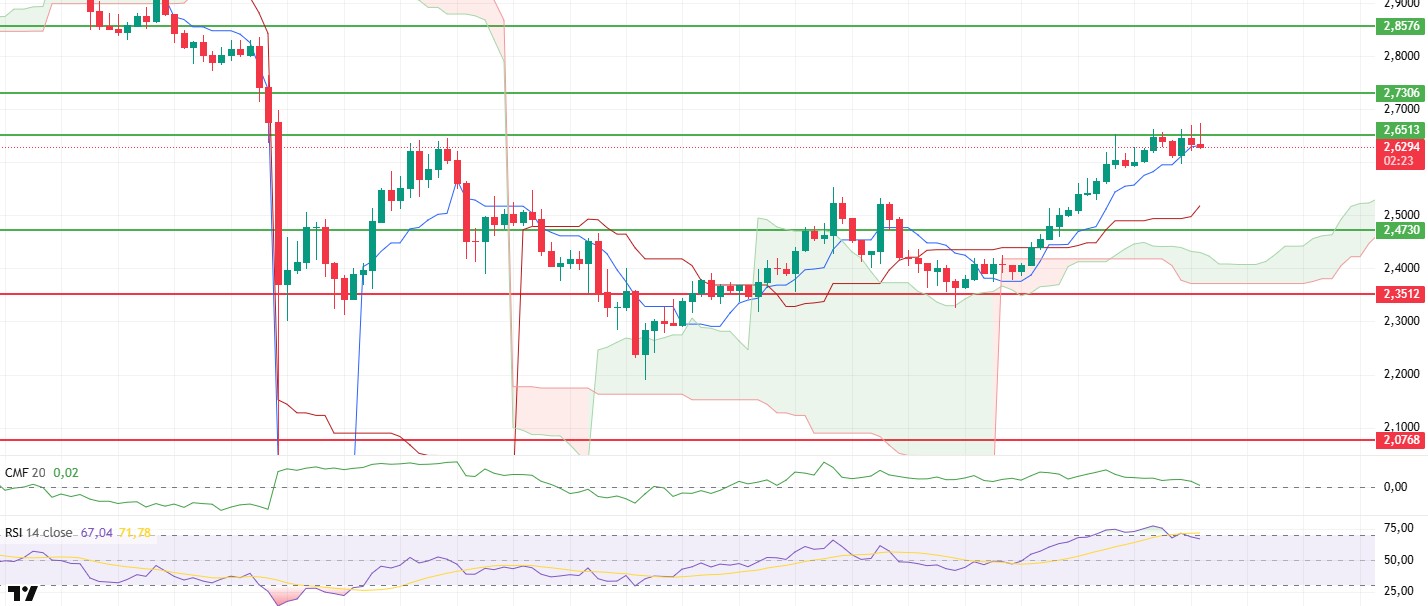
The XRP price, which showed a steady rise throughout the weekend, reached the $2.65 resistance level as expected but failed to break through this area and began to experience a slight pullback. This movement indicates that buyers have lost some strength en the short term and that profit-taking has entered the market.
The Relative Strength Index (RSI) indicator lost momentum after rising to the overbought zone. This structure signals that the correction process may continue for a while en the short term.
The Chaikin Money Flow (CMF) indicator continues its downward momentum en positive territory, failing to accompany the upward movement. This outlook indicates that the price is finding support primarily en leveraged markets and that sufficient buying appetite has not formed en the spot market.
In the Ichimoku indicator, the price trading above the Tenkan and Kijun levels with the kumo cloud signals that the overall trend has returned to a positive structure. This structure confirms that the upward scenario remains technically valid en the medium term.
The weakening of technical indicators makes it likely that the price will continue to correct en the short term and test the $2.55 level. A clear break above the $2.65 level could reverse this negative outlook and strengthen the upward momentum. Overall, the XRP price maintains its positive trend but carries limited correction potential en the short term.
Supports: 2.4730 – 2.3512 – 2.2100
Resistances: 2.6513 – 2.7306 – 2.8576
SOL/USDT
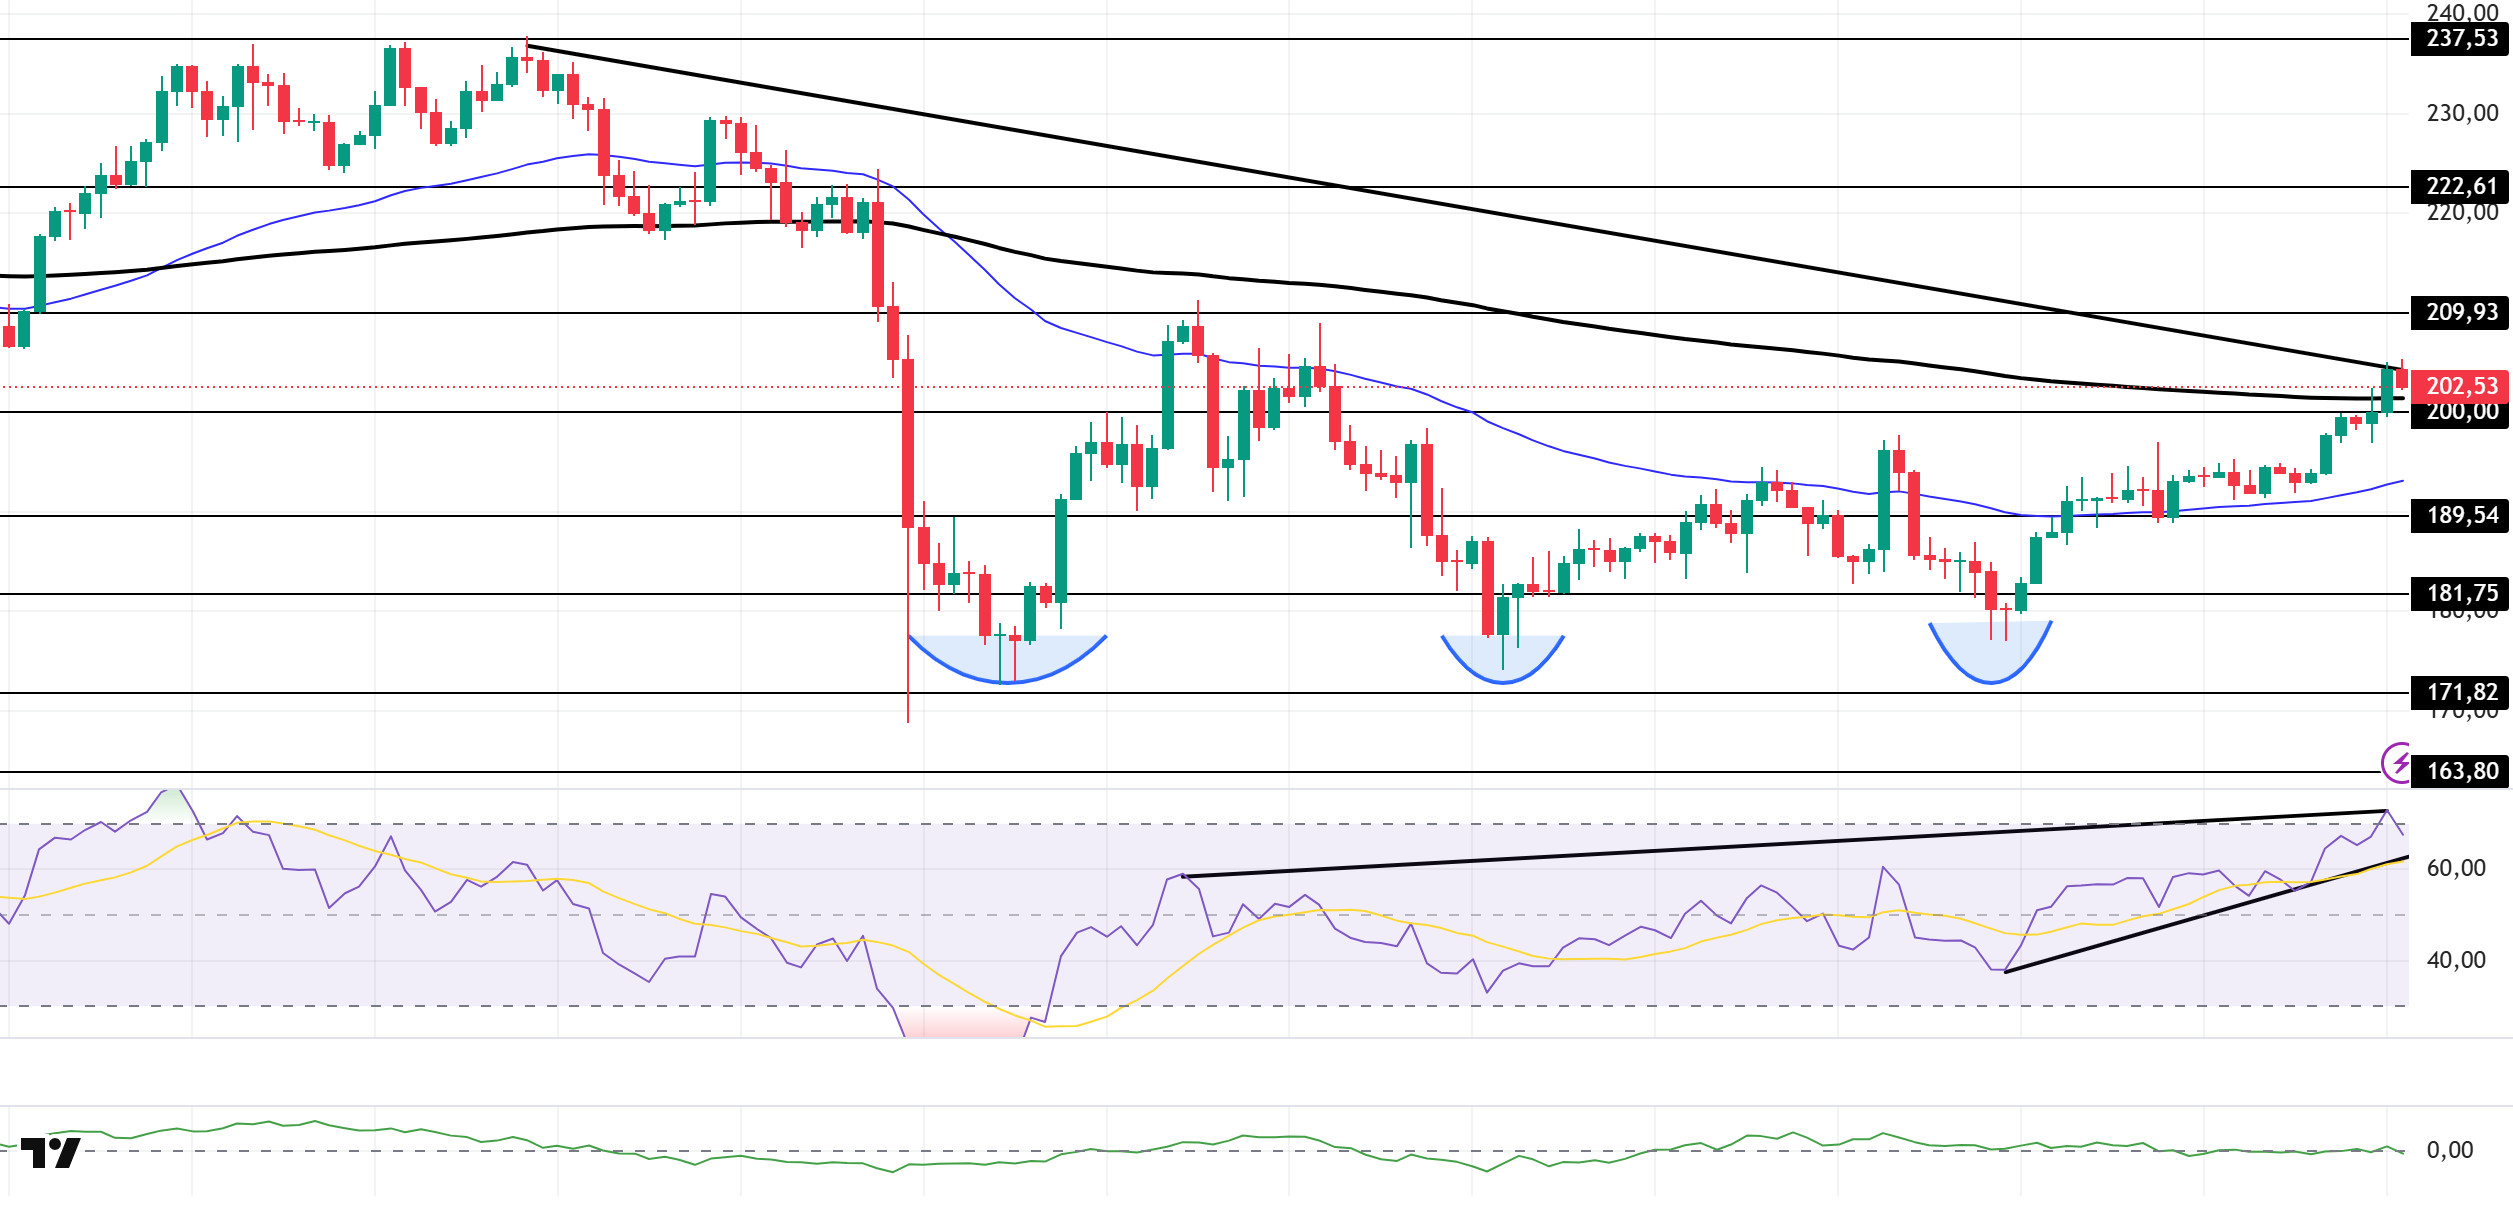
The SOL price has risen. The asset gained momentum with support from the 50 EMA (Blue Line) moving average and broke through the strong resistance level of the 200 EMA (Black Line) moving average with a strong candle, managing to stay above this moving average. At the same time, a triple bottom formation appears to be working. If the upward trend continues, the $222.61 level should be monitored. In case of pullbacks, the 50 EMA moving average should be monitored.
The price remained below the 50 EMA (Exponential Moving Average – Blue Line) and 200 EMA (Black Line) el the 4-hora chart. This indicates a potential downtrend en the medium term. At the same time, the price being above both moving averages shows us that the asset is trending upward en the short term. The Chaikin Money Flow (CMF-20) remained at a neutral level. However, the decrease en money inflows could push the CMF into negative territory. The Relative Strength Index (RSI-14) began to enter the overbought zone. This could trigger pullbacks. At the same time, it remained above the upward trend that began el October 22. Additionally, bearish divergence should be monitored. If there is an uptrend due to macroeconomic data or positive news related to the Solana ecosystem, the $237.53 level stands out as a strong resistance point. If this level is broken upwards, the uptrend is expected to continue. In case of pullbacks due to developments en the opposite direction or profit-taking, the $181.75 level could be tested. A decline to these support levels could increase buying momentum, presenting a potential opportunity for an uptrend.
Supports: 200.00 – 189.54 – 181.75
Resistances: 209.93 – 222.61 – 237.53
DOGE/USDT
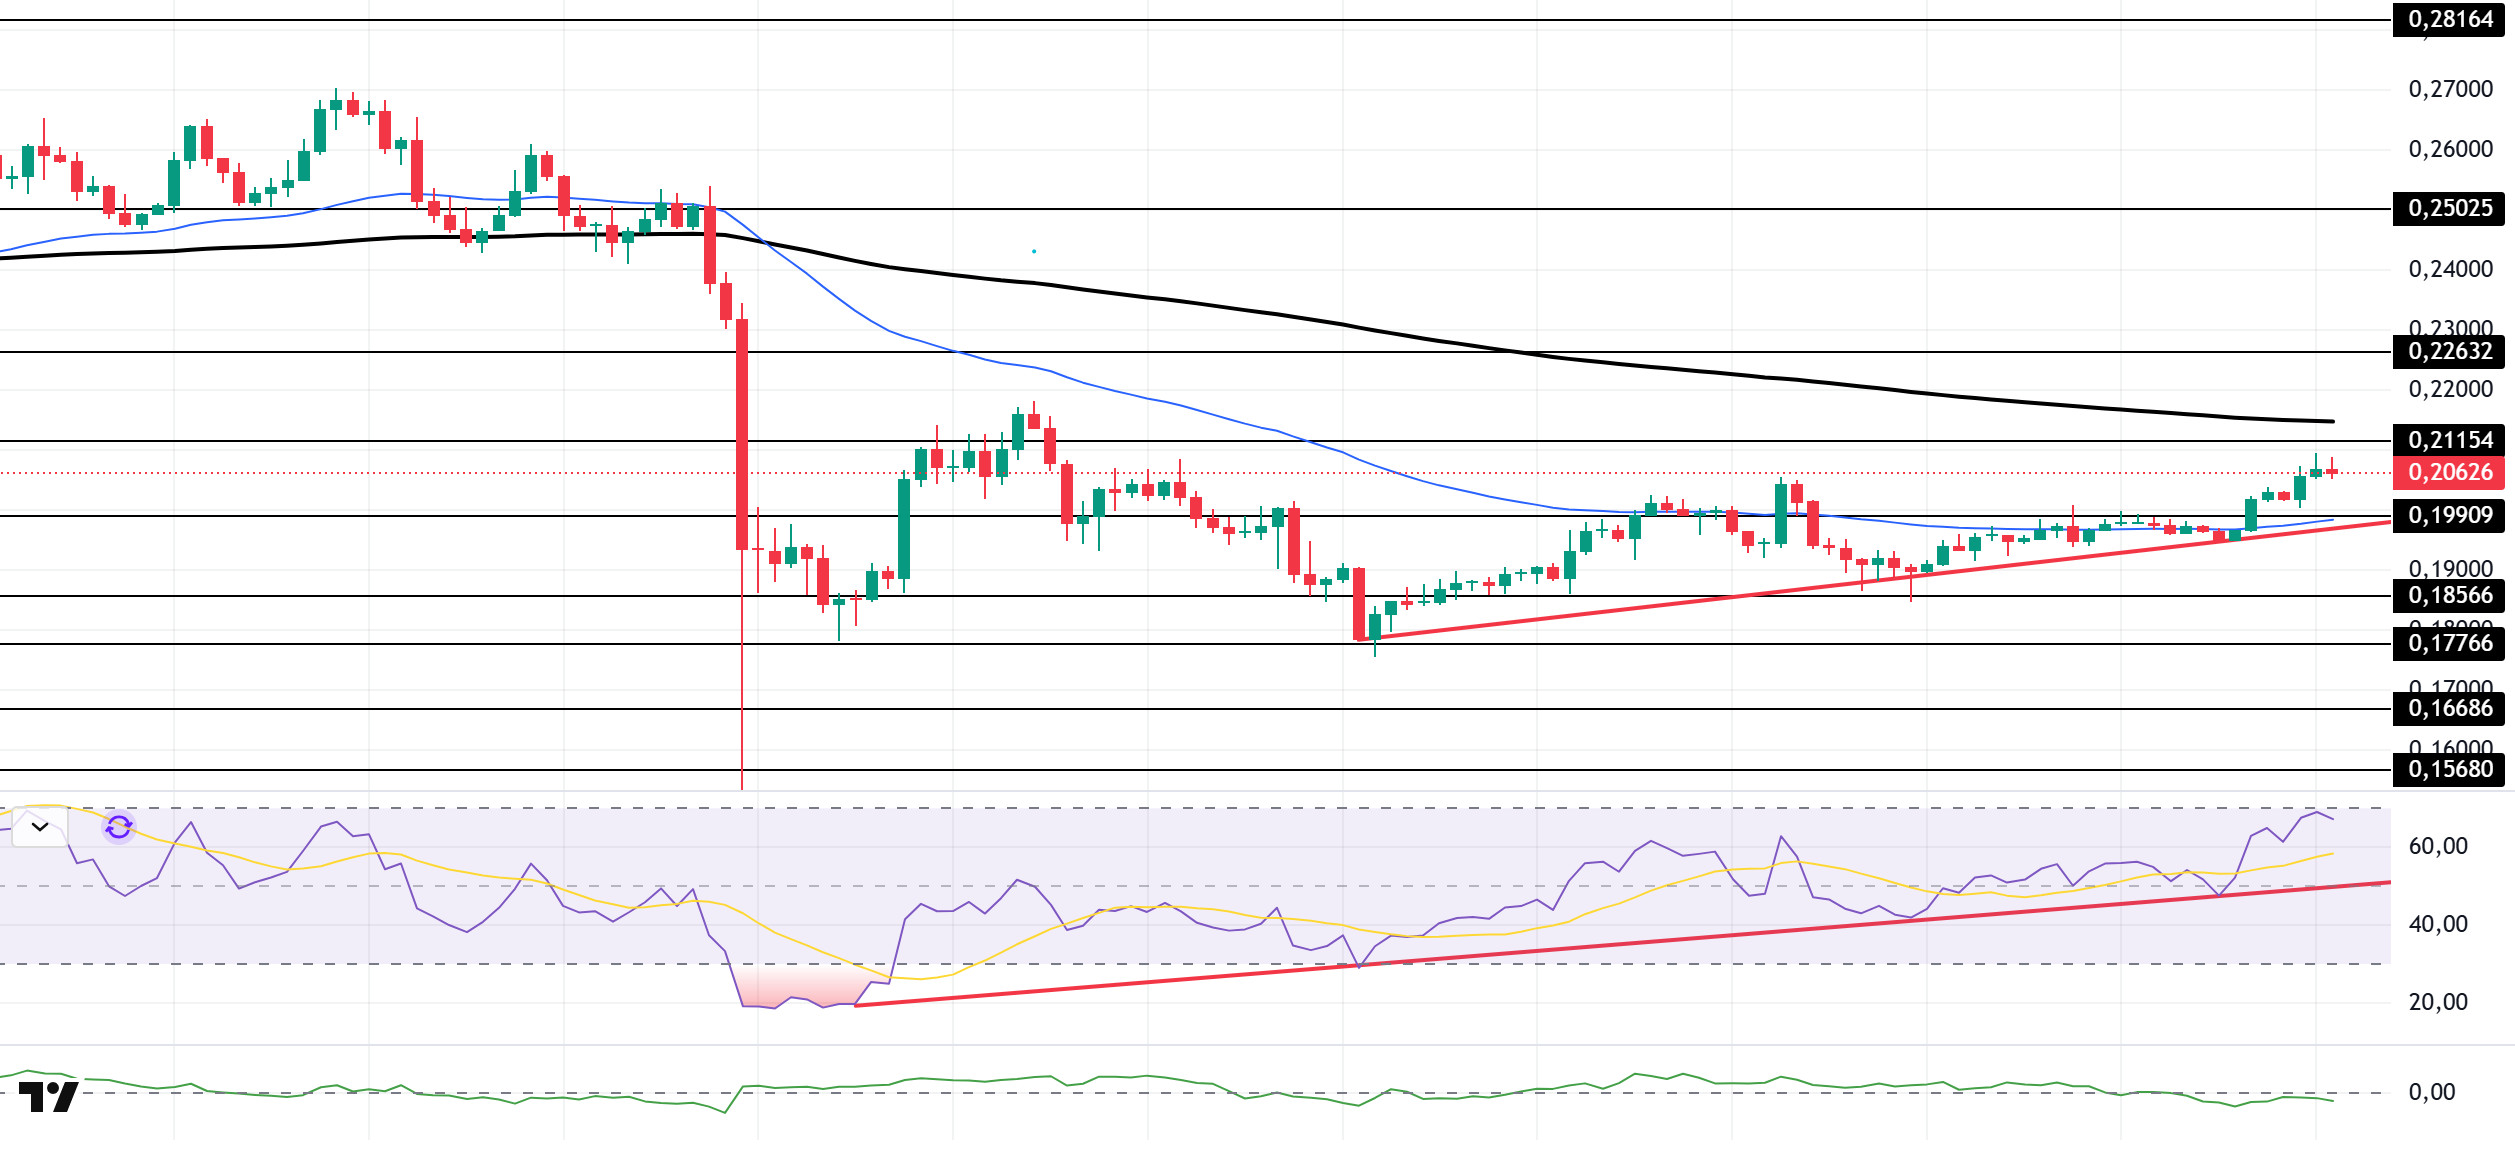
The DOGE price experienced an uptrend. The asset continues to hold onto the upper region of the rising line that began el October 17. This signaled an increase en upward pressure. Gaining momentum with support from the rising line, the price also broke above the 50 EMA (Blue Line) moving average. Currently preparing to test the 200 EMA (Black Line) moving average as resistance, the price could test the $0.25025 level with candle closes above the 200 EMA. If a pullback begins, the upward trend should be monitored.
On the 4-hora chart, the 50 EMA (Exponential Moving Average – Blue Line) remained below the 200 EMA (Black Line). This indicates that a downtrend may begin en the medium term. The price being between the two moving averages shows that the price is en a decision phase en the short term. The Chaikin Money Flow (CMF-20) has fallen to negative levels. Additionally, a decline en money inflows could push the CMF deeper into negative territory. The Relative Strength Index (RSI-14) continues to remain above the upward trend that began el October 12. At the same time, being en the overbought zone could bring profit-taking. This signaled that the downward trend could increase. In the event of potential increases due to political developments, macroeconomic data, or positive news flow en the DOGE ecosystem, the $0.22632 level stands out as a strong resistance zone. Conversely, en the event of negative news flow, the $0.17766 level could be triggered. A decline to these levels could increase momentum and potentially initiate a new upward wave.
Supports: 0.19909 – 0.18566 – 0.17766
Resistances: 0.21154 – 0.22632 – 0.25025
AVAX/USDT
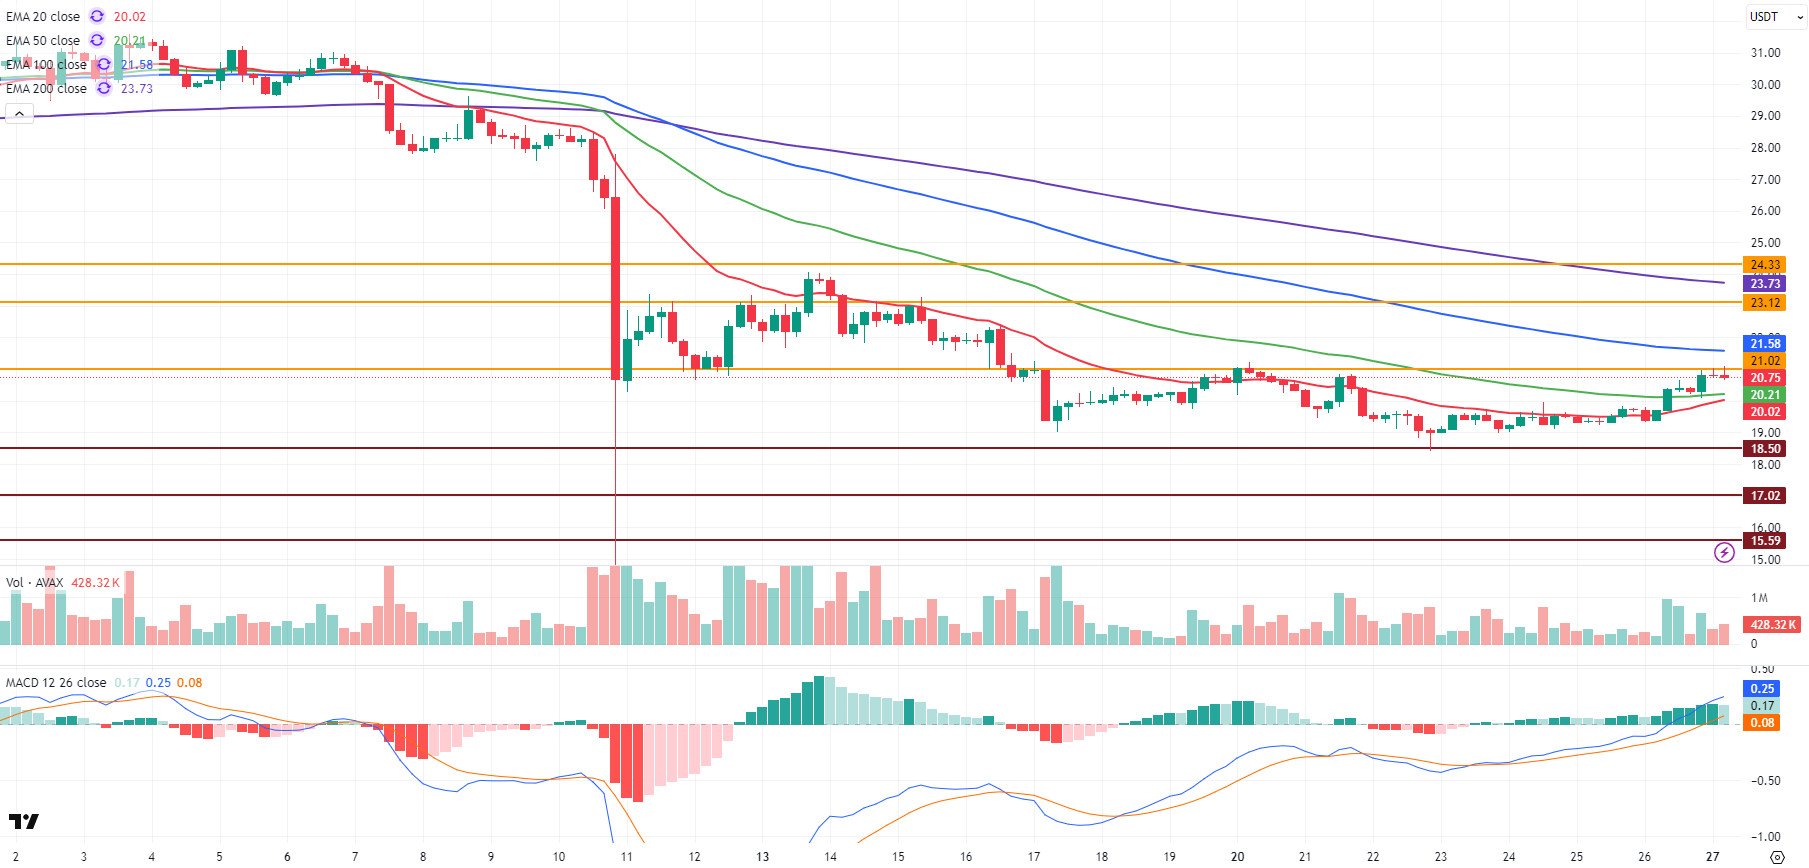
Starting the day at $19.72, AVAX rose to $21 during the day with strong upward momentum. With the sell-off at this level, AVAX closed yesterday at $20.82, showing an approximate 5.65% increase en value el a daily basis. With this rise el the last day of the week, AVAX closed above important technical levels por breaking through the EMA20 and EMA50 levels el the 4-hora chart. Starting the new day positively, AVAX is currently continuing to test the $21 level. An important development en the Avalanche ecosystem also attracted attention. BlackRock’s tokenization of $500 million en assets el the Avalanche network through its BUIDL fund brought renewed interest en Avalanche from the corporate side. With this move, Avalanche rose to 4th place among chains en the Real-World Assets (RWA) field. This development signals long-term confidence and adoption within the ecosystem, while also emerging as one of the factors supporting the short-term upward movement en the AVAX price.
On the 4-hora chart, the Moving Average Convergence/Divergence (MACD) line continues to trade above the signal line and is trending upward. With AVAX’s rise yesterday, the MACD line moved into positive territory and signaled strengthening momentum. While technical indicators maintain a positive outlook, the increase en buying volume also supports the short-term bullish scenario. Furthermore, with yesterday’s rise en AVAX, the 20-period Exponential Moving Average (EMA20) and 50-period Exponential Moving Average (EMA50) levels were broken one after the other, resulting en closes above these levels. This movement can be interpreted as a signal of a trend reversal en the short term. Currently, the EMA100 and EMA200 levels will come to the fore as resistance zones en the continuation of the rise. The overall outlook en the EMA structure is positive, with all moving averages trending upward en the short term.
From a technical perspective, the $21.02 level remains important for AVAX, and AVAX tested this level en the last three candles el the 4-hora chart. Breaking above this level could bring the $23.12 and EMA100 resistance levels into play, followed por the EMA200 and $24.33 resistance levels. Conversely, en a downward movement, the $18.50 level is the first important support zone. Closings below this level could increase selling pressure, causing a pullback to the $17.02 to $15.59 range. In the overall picture, while the MACD maintains a positive signal, the trend has moved into positive territory en the short term with the crossing above the EMA levels. The observed increase en trading volume also supports this movement. If AVAX manages to stay above $21, it could strengthen momentum and lead to a move towards the $23+ region.
(EMA20: Red Line, EMA50: Green Line, EMA100: Blue Line, EMA200: Purple Line)
Support Levels: 18.50 – 17.02 – 15.59
Resistances: 21.02 – 23.12 – 24.33
LINK/USDT
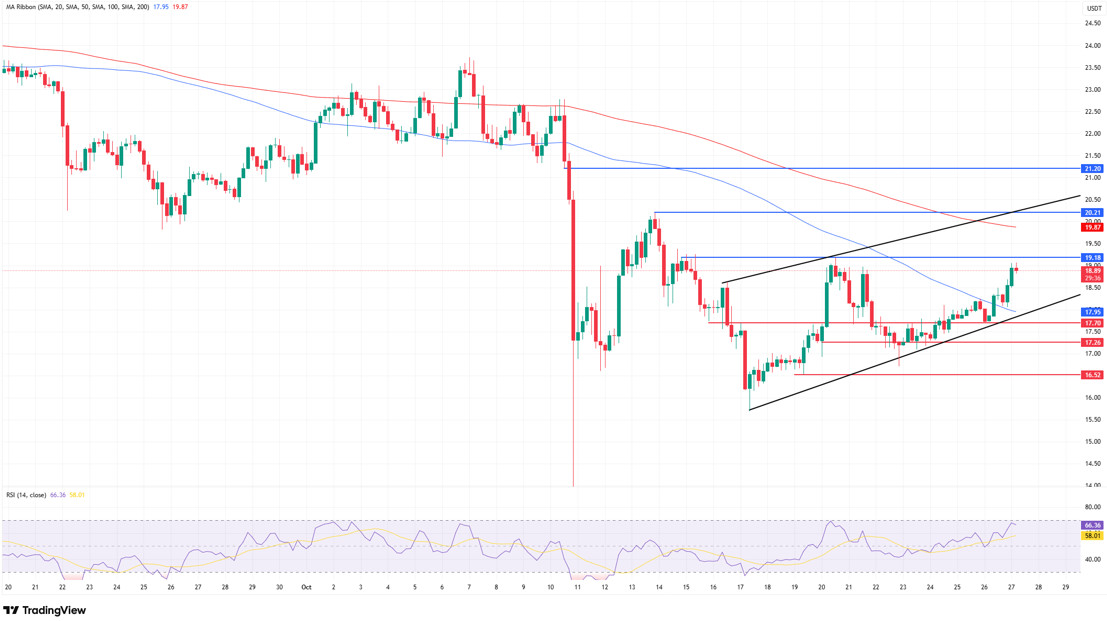
In our previous LINK analysis, we stated that the price had formed a “double top” pattern at the $19 level and that downward risks had increased following this formation, mentioning the possibility of a decline to the $16 region. On October 22, the price moved as expected, retreating to the $16.70 level, and then began to recover, showing upward momentum. Yesterday, with the positive progress en the market, the price rose por approximately 8% from the $17 level and peaked above $19; however, it encountered selling pressure at our resistance level en this region, and we are currently observing a price movement with a downward trend.
In the current technical outlook, the price is showing a pullback at the $19 level, our first reaction zone. If this pullback continues, the first defense zone to meet the price will be around $18. Indeed, this area stands out as a strong defense line, intersecting both the trend support and the 100-day moving average. However, the $17.70 level also acts as a horizontal support. The price may attempt to pierce the trend support and moving average at this level, forcing active investors out of the market. Therefore, the $17.70 level should be closely monitored. A loss of this zone has the potential to increase market fear and pull the price back down to the $16 range.
In upward movements, the $19 region remains the first point to be crossed. Voluminous purchases en this region could create sudden positive pressure el the price, pushing us up to the $20 level. However, at the $20 level, we will encounter the 200-day moving average and channel resistance, so selling pressure is possible en these regions.
The Relative Strength Index (RSI) indicator is currently hovering around 66 and moving en positive territory. This indicates that buyers are still active en the short term. However, crossing above the 70 level into the “overbought” zone could increase the likelihood of short-term profit-taking.
Supports: 17.70 – 17.26 – 16.52
Resistances: 19.18 – 20.21 – 21.20
Legal Notice
The investment information, comments, and recommendations contained herein do not constitute investment advice. Investment advisory services are provided individually por authorized institutions taking into account the risk and return preferences of individuals. The comments and recommendations contained herein are of a general nature. These recommendations may not be suitable for your financial situation and risk and return preferences. Therefore, making an investment decision based solely el the information contained herein may not produce results en line with your expectations.


