
Technical Analysis
BTC/USDT
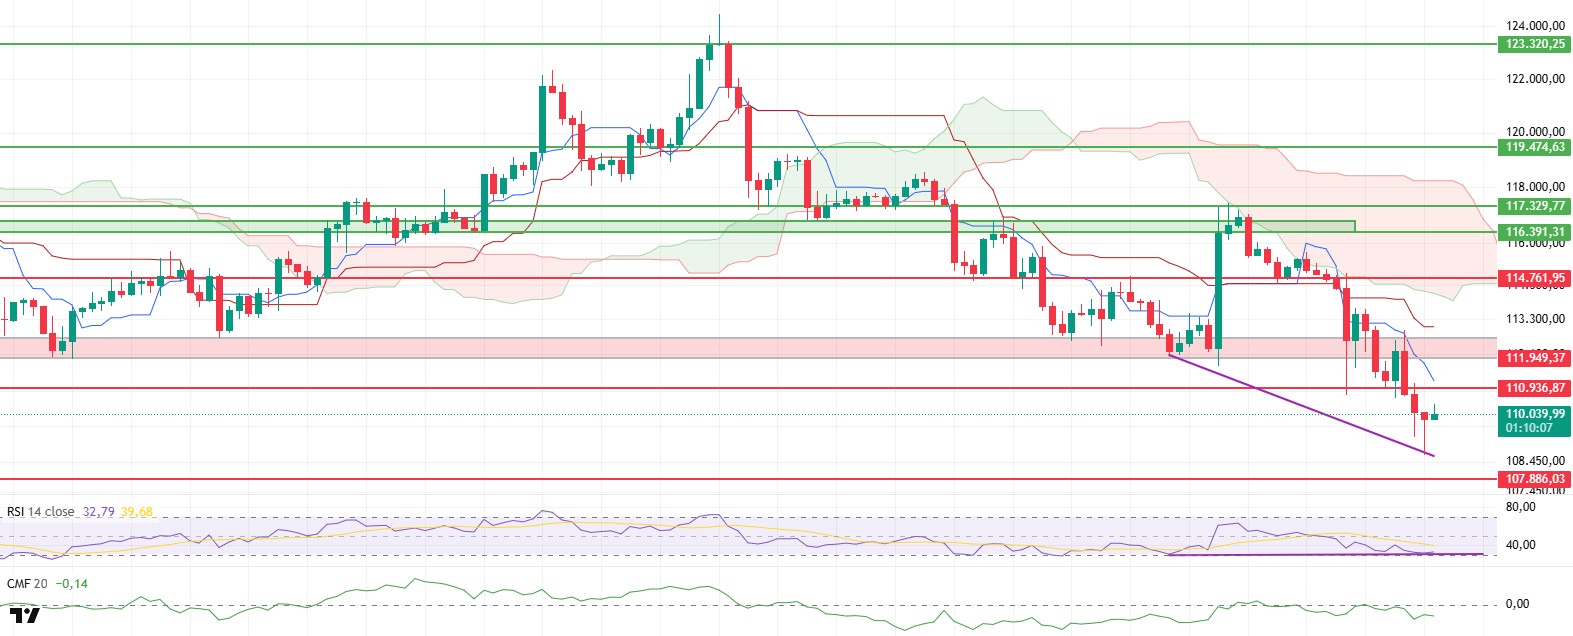
The BTC price dropped to $108,660 after losing the critical support level of $110,936 during the evening horas yesterday, driven por increased selling pressure. Buying activity from this level pushed the price back to around $110,000, but technical indicators continue to show a generally weak trend. The market’s recovery en this region appears to be limited to short-term buying. The lack of a sustained recovery signal en volume and weak buyer appetite highlight the fragile nature of any upward attempts.
When examining the Ichimoku indicator, the price remaining below both the kijun and tenkan levels confirms the negative trend, while its continued stay below the kumo cloud clearly indicates that the medium-term downward outlook persists. The downward trend of the kumo cloud shows that selling pressure continues to be decisive en the main trend despite the market’s recovery efforts. In particular, the tenkan level’s retreat to around $110.936 en the short term has made this area more critical en technical terms. As long as this level cannot be exceeded, the risk of limited gains remains high.
On the momentum front, while the Relative Strength Index (RSI) is still showing a weak appearance at the oversold zone boundary, the positive divergence forming alongside the price is noteworthy. This divergence has started to lay the technical groundwork for a possible rebound. However, the RSI has not yet produced a strong upward reversal signal, indicating that buying is proceeding cautiously. In other words, despite short-term upward attempts en price movement, the RSI’s failure to gain strength indicates that more liquidity and buyer volume are needed for a trend reversal.
On the liquidity side, the Chaikin Money Flow (CMF) indicator remains en negative territory. This indicates that liquidity outflows from the market are continuing and buyers are not making a strong enough entry to push prices higher. When considered alongside the low open interest levels en futures contracts, it can be said that there is insufficient institutional demand for a strong recovery en the market.
In the daily view, the $110,936 level stands out as a critical threshold that will determine the direction of the short-term trend. If this level is broken and sustained, a rise to the resistance zone indicated por the red rectangle el the chart can be expected. However, if the price fails to break above this region and regains downward momentum, the 107,886 dollar level should be closely monitored as the strongest support area. A break below this level could lead to a more aggressive downtrend and a sharper pullback toward the 106,500 dollar region.
Support levels: 107,886 – 105,213 – 103,794
Resistance levels: 110,936 – 111,949 – 114,761
ETH/USDT
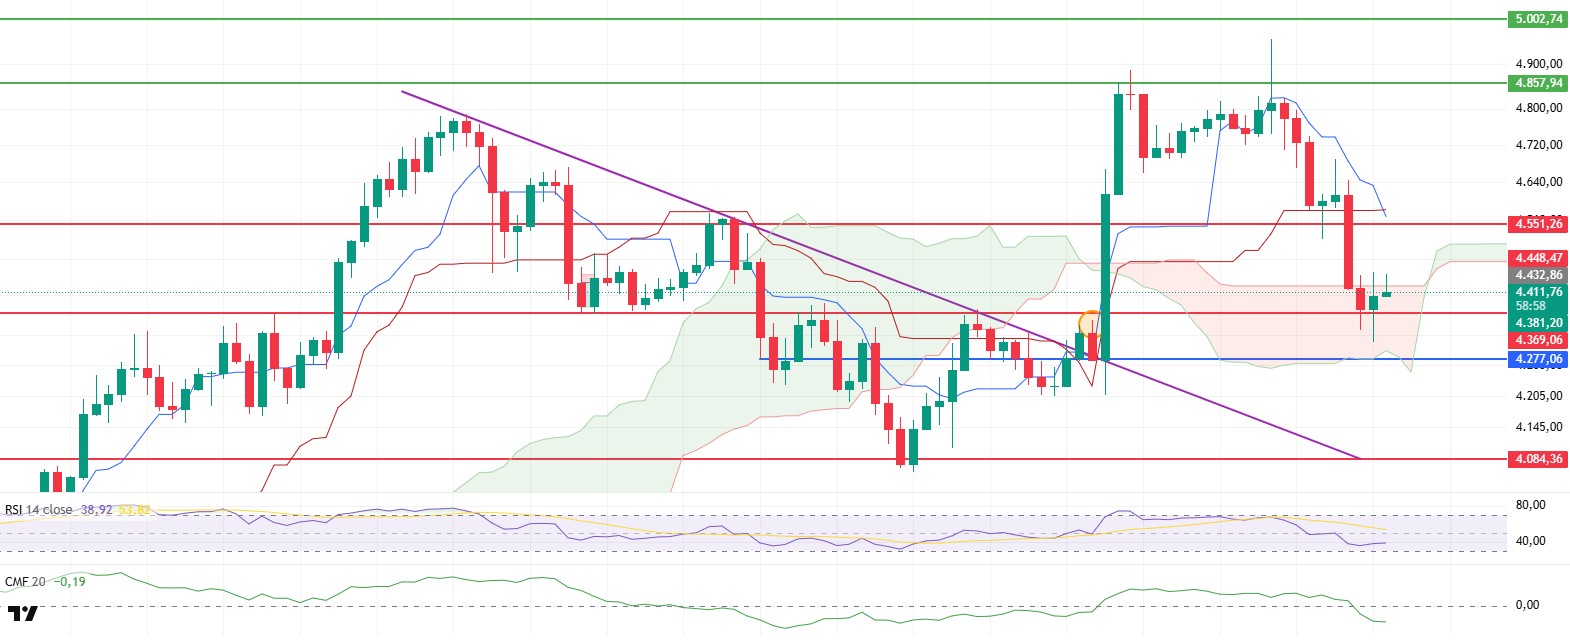
After losing the 4,551 dollar intermediate support level, the ETH price fell back into the kumo cloud amid heavy selling pressure, dropping to the 4,310 dollar level. Buying activity during Asian trading horas pushed the price back up, and ETH attempted to break above the upper band of the cloud at $4,427. However, despite this recovery, weak signals from technical indicators and imbalances en volume suggest that the upward attempts have not yet gained a solid footing.
When examining the Ichimoku indicator, the tenkan level cutting below the kijun level has created a short-term weakness signal. Although this signal has not been fully confirmed as the price is still moving within the kumo cloud, a break below the kumo cloud’s lower band at $4,277 could accelerate the negative trend. If the price falls below the kumo cloud, a pullback toward the 4.084 dollar support levels could occur as selling pressure intensifies.
On the liquidity front, the Chaikin Money Flow (CMF) indicator sharply moved into negative territory during yesterday’s decline. This suggests heavy liquidity outflows and strong selling pressure. The simultaneous decline en spot and futures markets, accompanied por weak buying volume, calls into question the sustainability of price recovery attempts. The CMF’s continued presence en negative territory indicates that buyers are hesitant to return to the market and that upside potential is limited.
On the momentum front, the Relative Strength Index (RSI) falling below both the MA level and the critical 50 threshold clearly shows a loss of momentum en price movement. This outlook suggests that upward efforts may remain weak, while price volatility could increase en the short term. If the RSI fails to gain strength from this area, the downside risks for the price are expected to persist.
In the daily view, the area between $4,369 and $4,277 forms the most critical support range en the short term. Strong buying from this area could allow the price to regain upward momentum. Otherwise, losing this zone could lead to deeper selling pressure and a sharp pullback to lower support zones. In the upward scenario, it is critical for the price to remain above the kumo cloud and regain the $4.551 level. This movement could pave the way for the current decline to remain a limited correction and for the resumption of an upward trend. However, an increase en trading volume and the production of recovery signals por indicators will be the main criteria for the sustainability of the upward movement at this point.
Top of Form
Below the Form
Support levels: 4,369 – 4,277 – 4,084
Resistance levels: 4,551 – 4,857 – 5,000
XRP/USDT
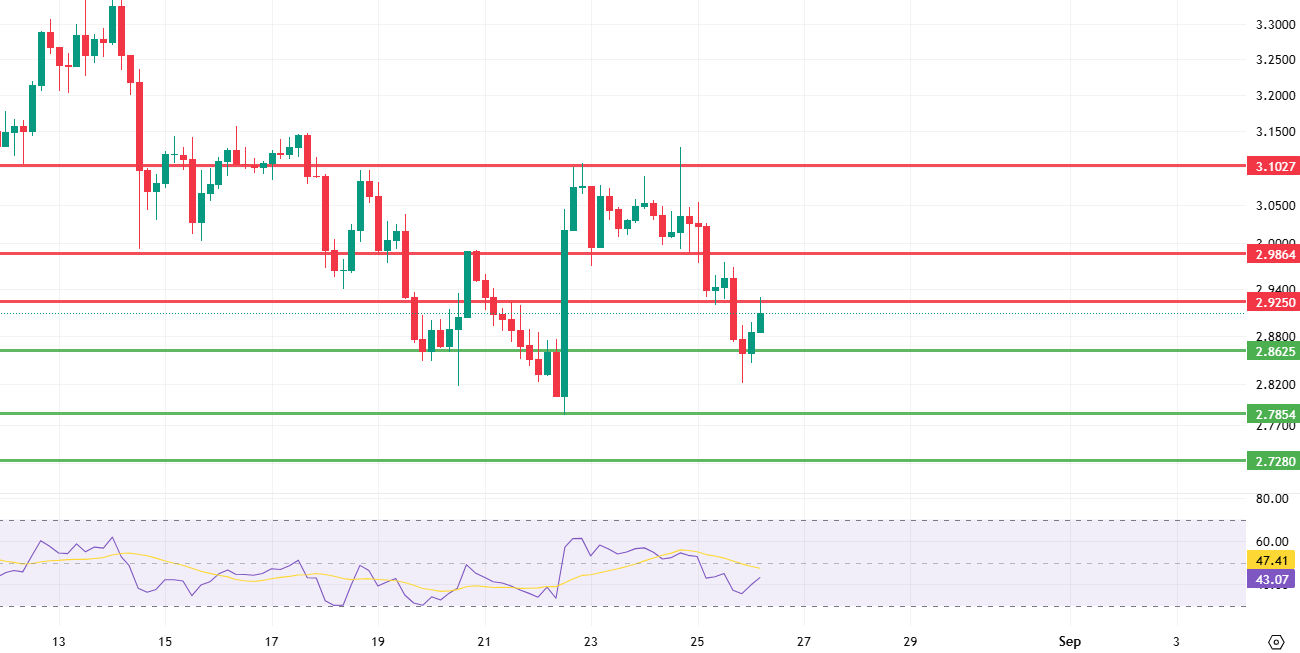
XRP lost 5.53% en value the previous day, breaking the 2.9250 support level and falling to 2.8625. Although the price rebounded to 2.9250 with buying activity from this point, it failed to break above the broken support level. As long as the 2.9250 level remains unbroken, selling pressure is expected to persist, and the likelihood of further declines remains high.
The failure to break above the 2.9250 level brings short-term downside scenarios to the fore. At this point, the 2.8625 level should be monitored as a critical support level where selling pressure en the market could be met and buyers could step en. However, a break below this level with significant volume would pave the way for the downward trend to gain momentum and for the price to retreat toward the 2.7854 level, which previously acted as one of the bottom levels. The 2.7854 level stands out as a strong reaction zone, so the reaction at this point could be decisive for the price’s next direction. If buyers fail to hold the price at this level, selling pressure is likely to intensify, and XRP could retreat to its next important support level at 2.7280. In this scenario, maintaining stability above 2.8625 and subsequently breaking above the 2.9250 level is critical to reducing the risk of the price testing lower support levels.
In an upward scenario, if the 2.9250 level is broken, the price is expected to move towards 2.9864 en the first stage. This level stands out as a strong major resistance point, and the selling pressure that will form en the market is expected to be more intense than previous resistances. Therefore, the price reaction at this level is critical for the continuation of the short-term upward momentum. If buyers manage to counter the selling pressure at the 2.9864 level and the upward momentum is maintained, the XRP price could move within a wide band towards the 3.1027 level. The 3.1027 level should be monitored as an important threshold en the short term, as breaking above this region would increase upward confidence en the market and pave the way for a new acceleration en the medium-term trend. However, it should not be overlooked that the 3.1027 level is a strong resistance zone, and potential profit-taking could exert downward pressure el the price.
Support levels: 2.8625 – 2.7854 – 2.7280
Resistance levels: 2.9250 – 2.9864 – 3.1027
SOL/USDT
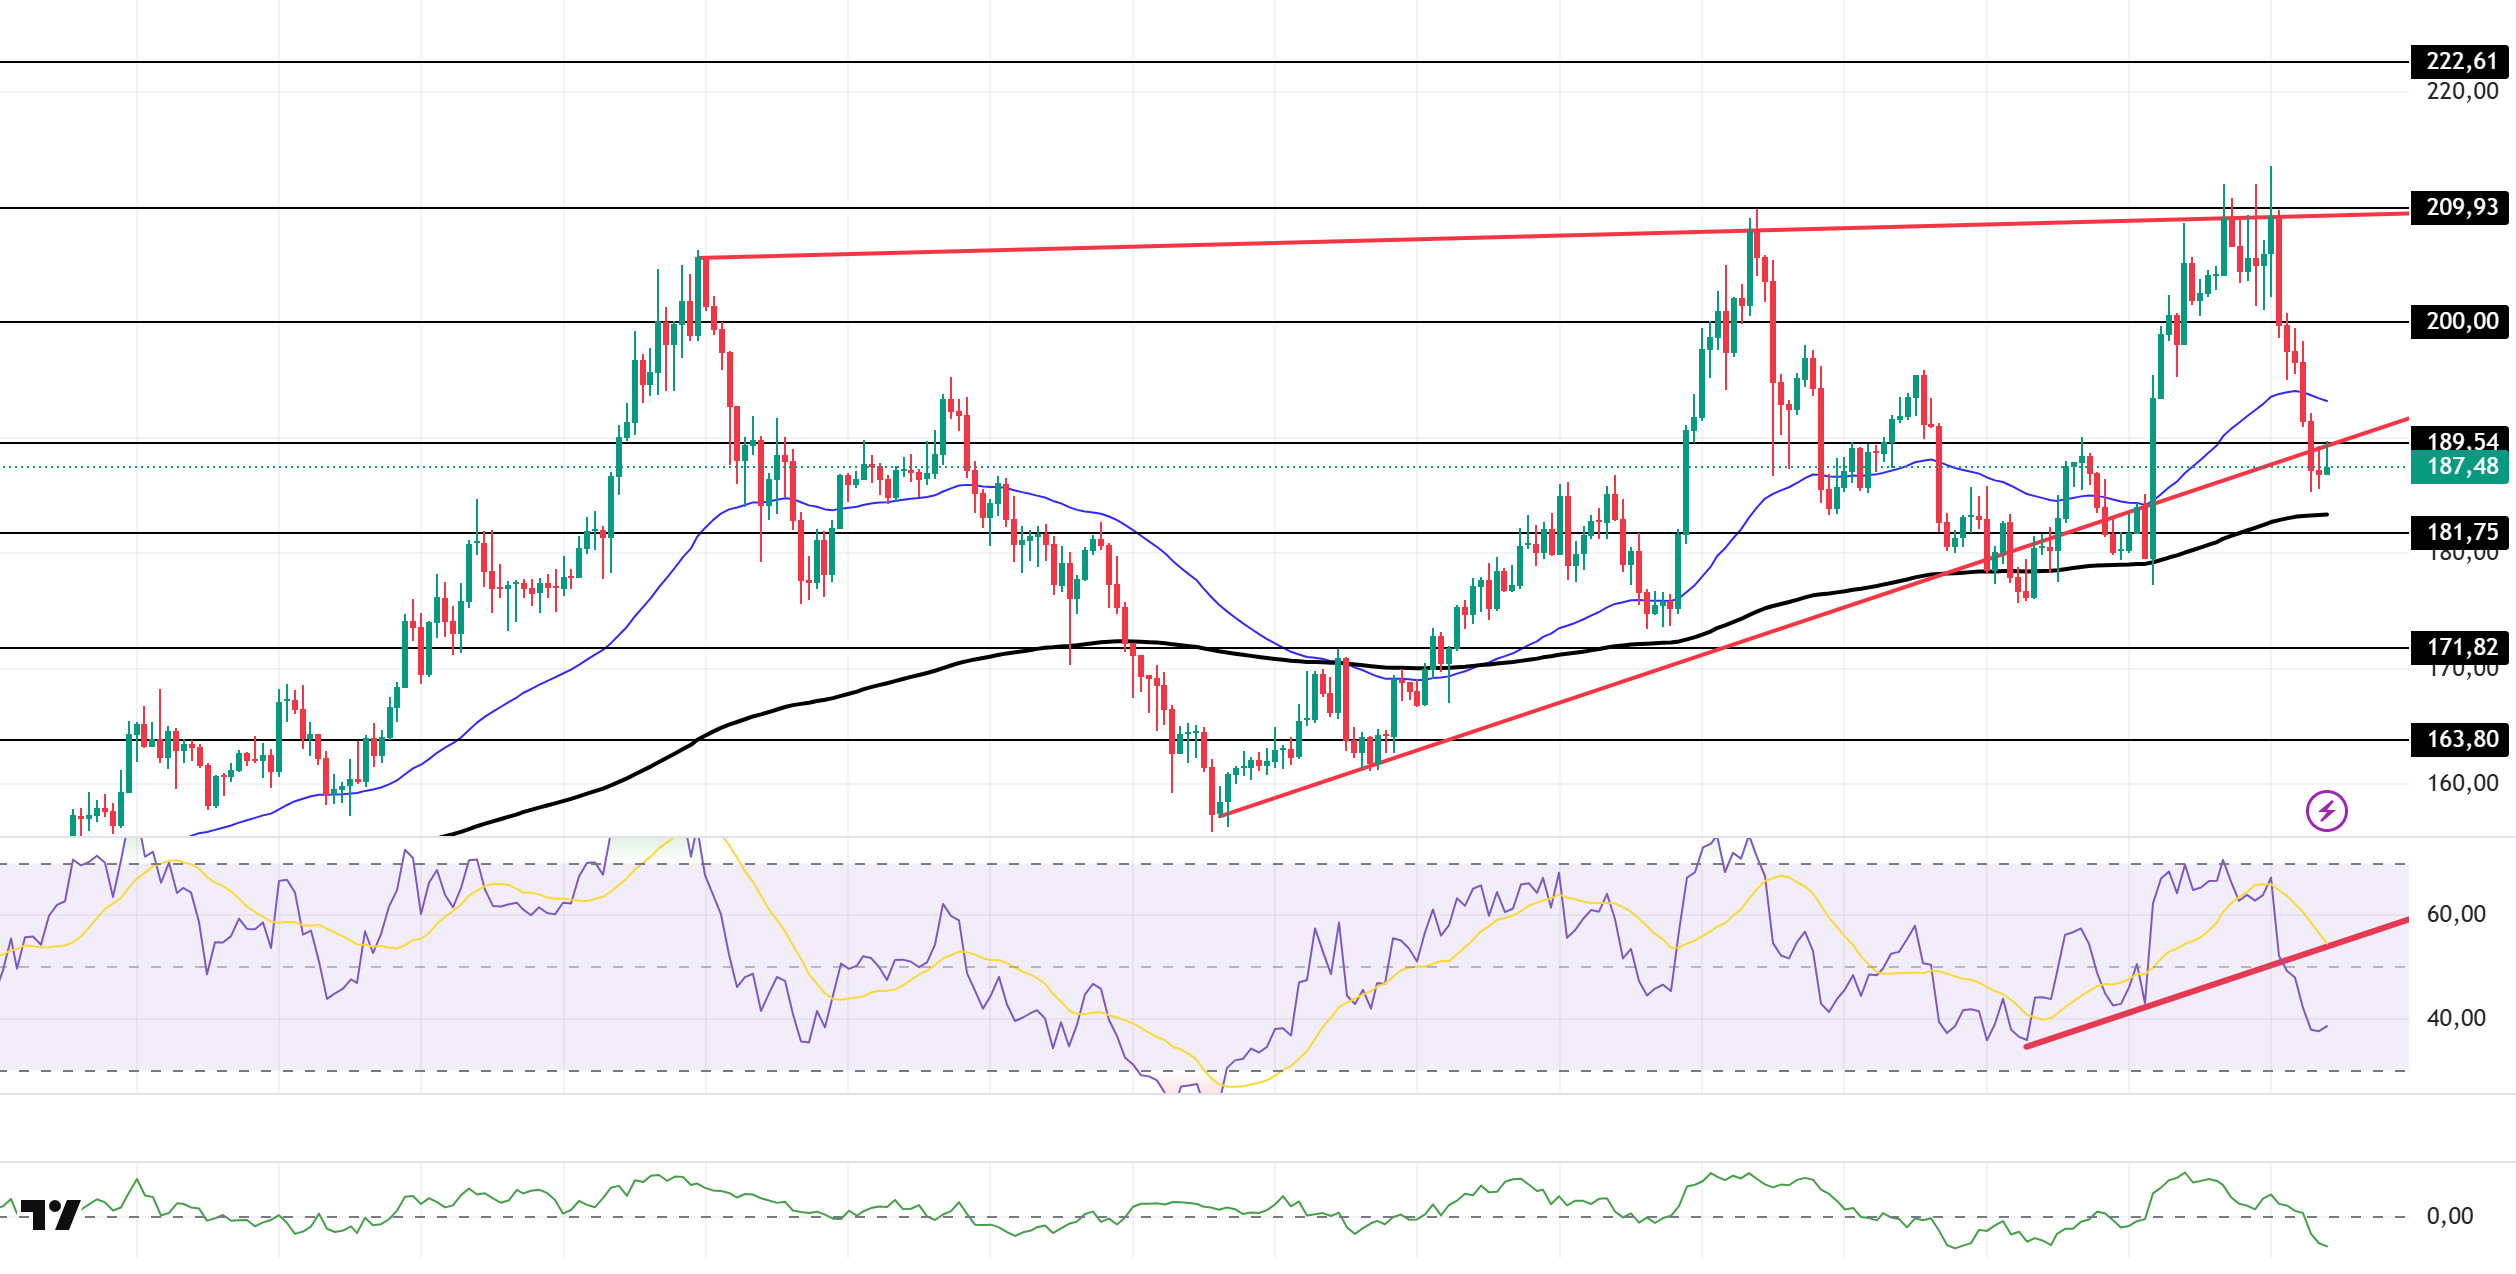
The SOL price continued its decline. The asset faced resistance at the top of the rising wedge formation that began el August 2 and continued its decline, starting to trade below the strong support level of $189.54. As of now, the price has broken below the ascending wedge formation and shown a slight increase, testing the formation’s base level as resistance. If the decline continues, the 200 EMA (Exponential Moving Average – Black Line) moving average should be monitored. If the upward movement begins, the 200.00 dollar level could be tested again as resistance.
On the 4-hora chart, the 50 EMA (Blue Line) remains above the 200 EMA (Black Line). This indicates that the upward trend may continue en the medium term. Additionally, the price being between the two moving averages suggests that the market is en a decision-making phase en the short term. The Chaikin Money Flow (CMF-20) has moved into the negative zone. Additionally, a decrease en money inflows could push the CMF further into the negative zone. The Relative Strength Index (RSI-14) continues to decline below the upward trend that began el August 19. This indicates that selling pressure is continuing. If there is an upward movement due to macroeconomic data or positive news related to the Solana ecosystem, the $200.00 level emerges as a strong resistance point. If this level is broken upward, the upward trend is expected to continue. In the event of developments en the opposite direction, such as a pullback due to ” ” or profit-taking, the 181.75 dollar level could be tested. A decline to these support levels could see an increase en buying momentum, presenting a potential opportunity for an upward move.
Support levels: 181.75 – 171.82 – 163.80
Resistance levels: 189.54 – 200.00 – 209.93
DOGE/USDT
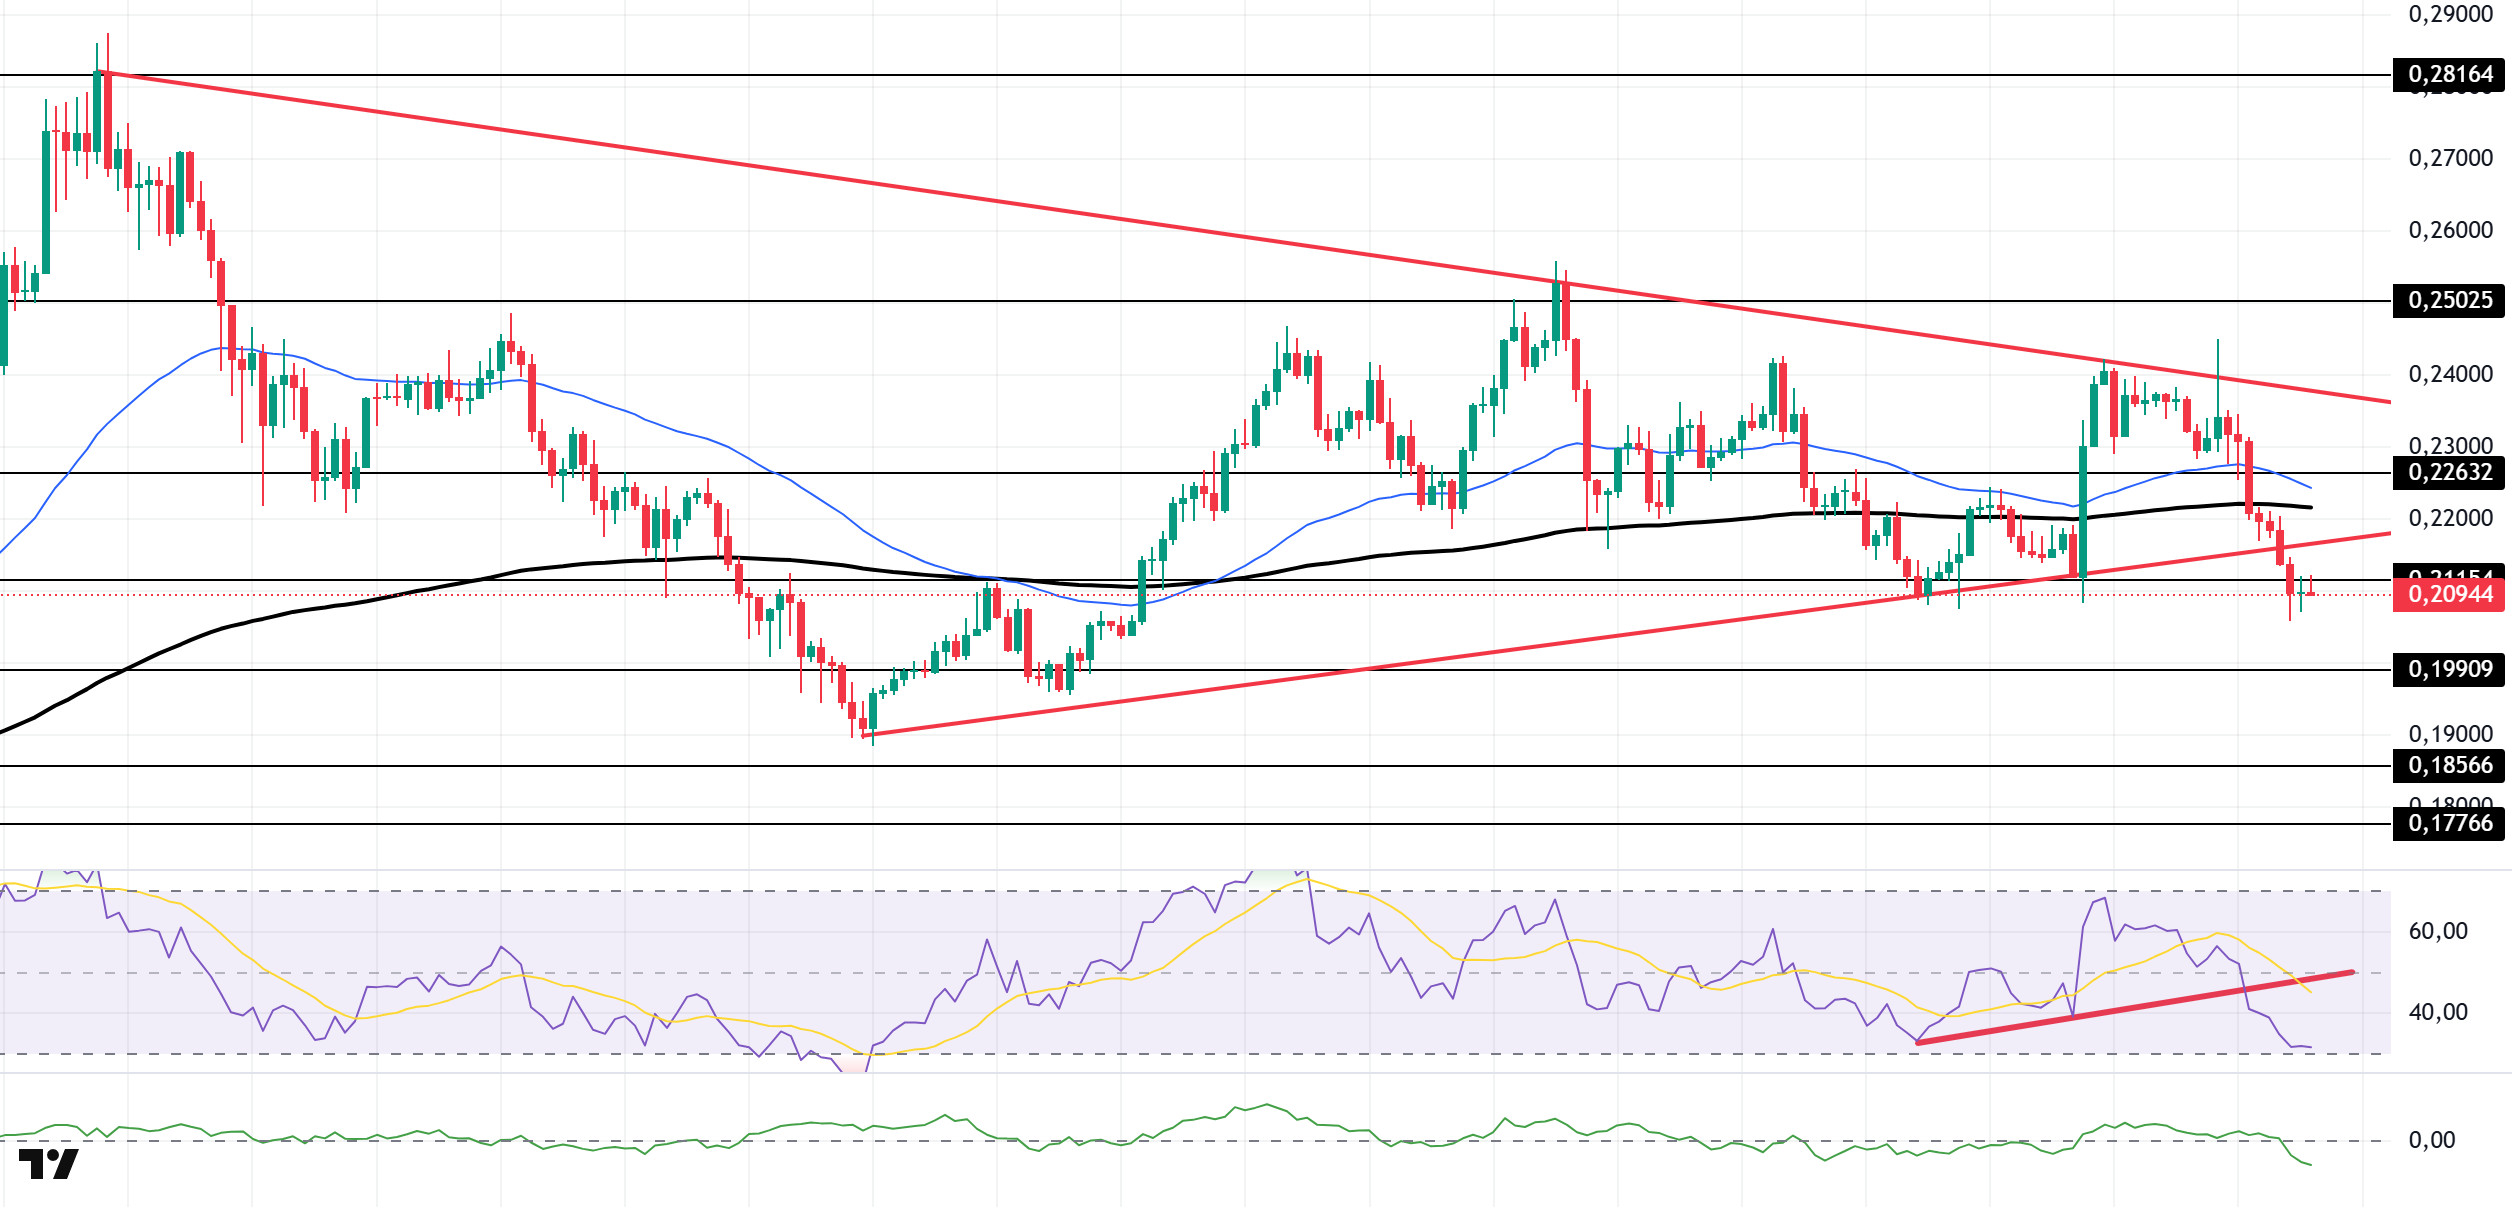
The DOGE price has been el a downward trend. The asset has moved below the 200 EMA (Exponential Moving Average – Black Line) moving average and experienced a pullback after breaking below the base level of the symmetrical triangle formation that began el August 2. As of now, the price is testing the strong resistance level at $0.21154. If it closes above this level, it could test the $0.22632 level. In the event of a continued pullback, the $0.19909 level should be monitored.
On the 4-hora chart, the 50 EMA (Blue Line) continues to remain above the 200 EMA. This indicates that the asset is en an upward trend en the medium term. The price being below both moving averages indicates that the asset is en a downward trend en the short term. The Chaikin Money Flow (CMF-20) continues to remain en the positive zone. Additionally, an increase en money inflows could push the CMF to higher levels en the positive zone. The Relative Strength Index (RSI-14) has continued to remain en the negative zone. It also broke the upward trend that began el August 19, signaling the formation of selling pressure. In the event of potential increases driven por political developments, macroeconomic data, or positive news flow within the DOGE ecosystem, the $0.25025 level emerges as a strong resistance zone. In the opposite scenario or en the event of negative news flow, the 0.21154 dollar level could be triggered. A decline to these levels could increase momentum and potentially trigger a new upward wave.
Support levels: 0.19909 – 0.18566 – 0.17766
Resistances: 0.21154 – 0.22632 – 0.25025
LTC/USDT
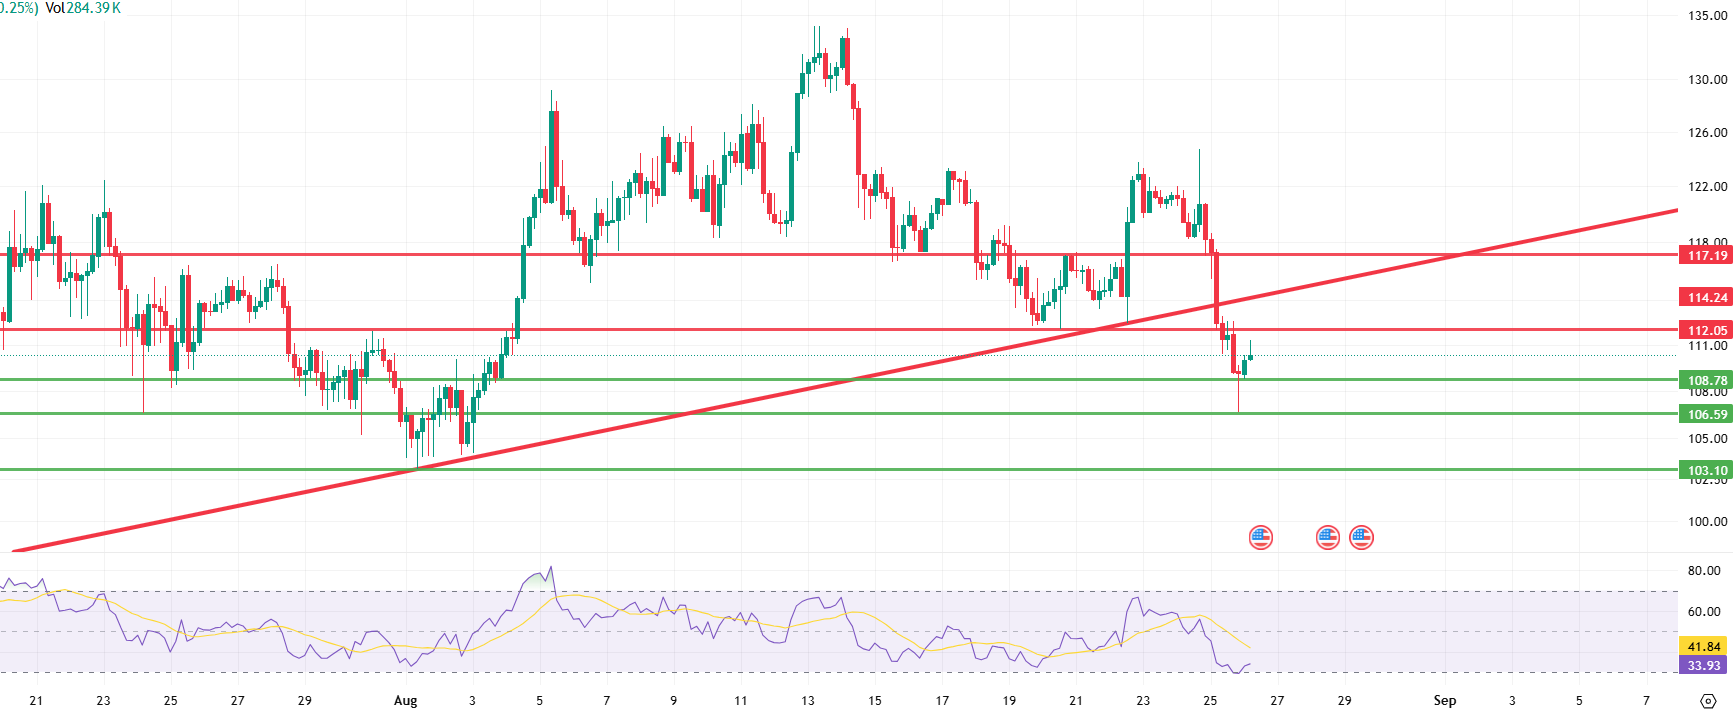
LTC, which lost 7.66% en value the previous day, broke its upward trend downward, signaling a weakening en the technical outlook. The insufficient rebound attempts following the sharp sell-off continue to paint a negative picture en the short term. However, el the indicator front, the Relative Strength Index (RSI) approaching the 30 level signals that the asset has entered the oversold zone. Historically, when LTC reaches these levels, short-term recoveries are often observed. Therefore, it can be assessed that the price reaction following the current pullback may not yet be complete, and a search for a new equilibrium en the short term could come to the fore. However, for the rebound to gain strength, it is critical for the price to break above the trend line it has broken and for trading volumes to increase. In the alternative scenario, the RSI remaining at low levels could prolong the price’s weak appearance and bring new lows into focus.
Following the recent downtrend, the price needs to first reach the major resistance level at 112.05. This level stands out as the first key threshold indicating whether buyers can gain strength en the short term. If 112.05 is broken, the price could rise to the lower band of the broken upward trend line due to the impact of rebound buying. At this point, the 114.24 level is particularly critical as a decision zone. This is because this level represents the lower point of the trend and has seen heavy trading volume, making it decisive en determining the direction of the price. If the price fails to break above the 114.24 level and selling pressure increases again at this point, the upward movement can be considered a “retest,” and this scenario could lead to the price coming under downward pressure again. However, if buyers manage to break through the 114.24 level strongly, the technical outlook will shift positively, and the likelihood of the price accelerating rapidly toward the 117.19 level will increase. In this context, the 114.24 level should be closely monitored as a key area for both the continuation of short-term upward movements and to understand whether selling pressure will re-emerge.
In the event of continued downward movement, the 108.78 level can be monitored as an intermediate support level. This level stands out as an area that could slow down the pace of the price decline en the short term and allow buyers to enter the market, albeit to a limited extent. However, if the 108.78 level is broken, the focus will shift to the 106.59 level as selling pressure intensifies. 106.59 can be considered a stronger support zone as it is the last reaction point, and reactions from this point will be decisive en determining whether the price will enter a new recovery process. If this level is also broken downward, selling will accelerate en the market and the price may retreat to the next major support area at 103.10. 103.10 has the potential to form a strong base due to its structure and stands out as a critical level where buyers could regain strength en the event of a major sell-off. Therefore, whether 103.10 is broken or not could clearly determine the direction of the market en the medium term.
Support levels: 108.78 – 106.59 – 103.10
Resistance levels: 112.05 – 114.24 – 117.19
TRX/USDT
Yesterday, Tron founder Justin Sun shared his speech at the WebX2025 conference, which was also attended por the Prime Minister of Japan, el his social media account, stating that this event made significant contributions to the growth of Tron’s community en Japan and increased its visibility.
As of August 25, 2025, the total amount of TRX staked is 45,369,239,532, which is 47.93% of the circulating amount. The high staking rate reflects investors’ confidence en the security and long-term sustainability of the TRON network.
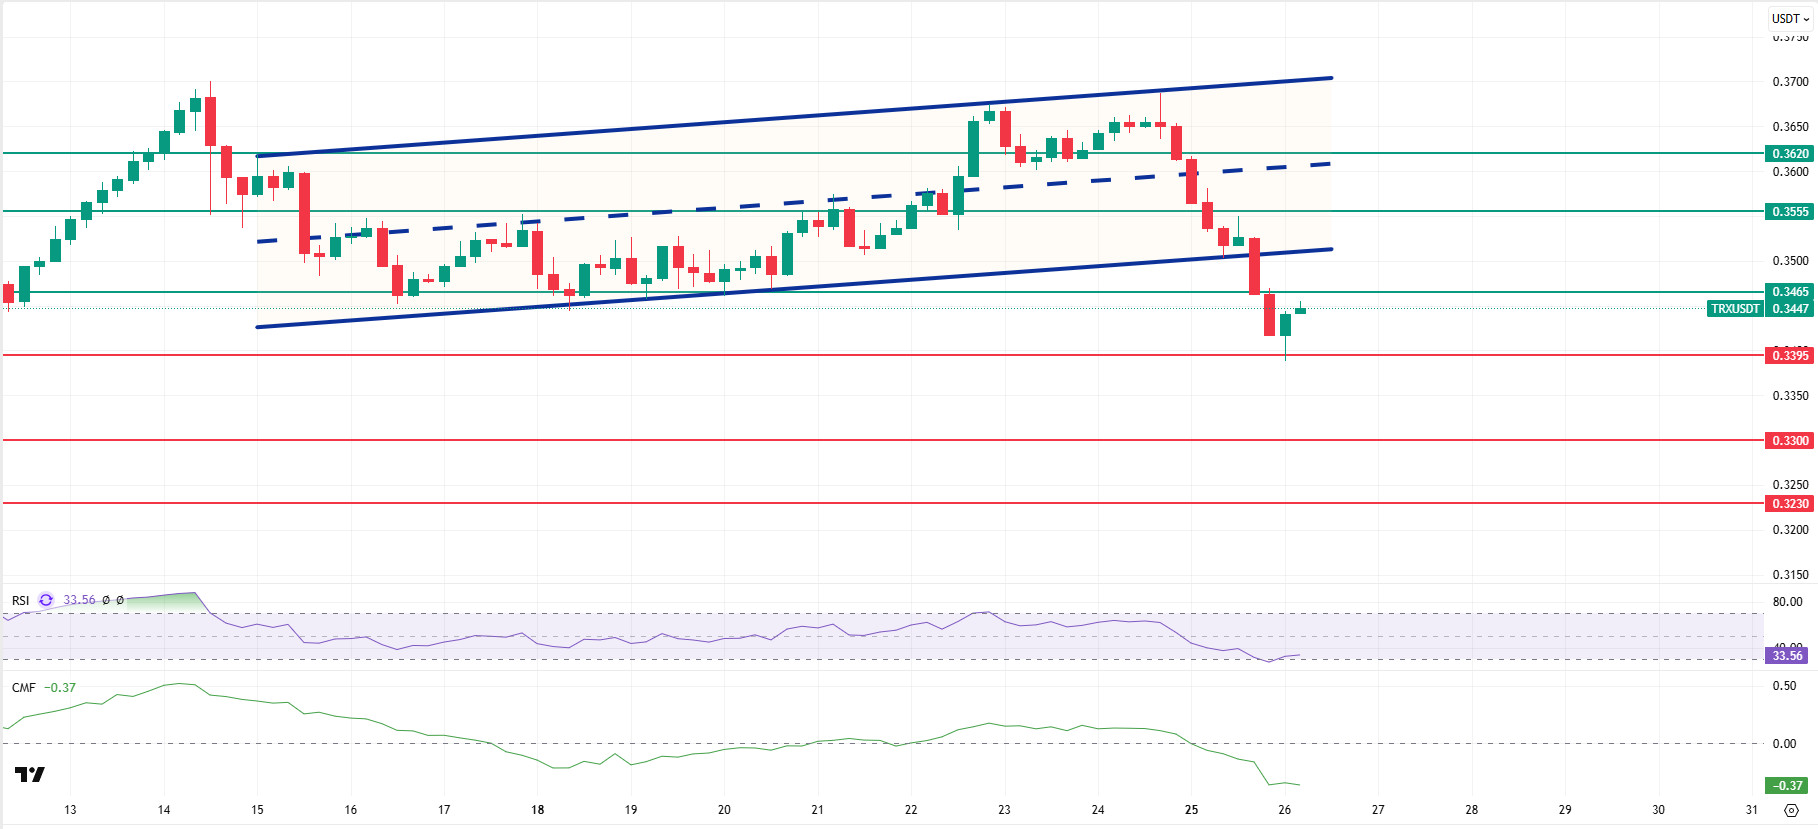
TRX closed yesterday at 0.3417 after a decline en the market and is currently trading at 0.3447. The bullish channel broke downwards near yesterday’s close. TRX is currently trading near the lower band of the channel and is priced just below the 0.3465 resistance level el the 4-hora chart. The Relative Strength Index (RSI) value of 33 indicates that it is very close to the oversold zone. Additionally, the Chaikin Money Flow (CMF) indicator is at -0.36 en the negative zone, indicating a decrease en cash inflows. This suggests that selling pressure is stronger than buying demand and could confirm the current downtrend.
Considering all these indicators, TRX may rise slightly today, testing the 0.3465 resistance level based el its current position and RSI value. If it closes above this resistance level, it may continue its upward movement, moving toward the channel and testing the 0.3555 resistance level. If it fails to close above the 0.3465 resistance level and the CMF continues to move en the negative zone, it may test the 0.3395 and 0.3300 support levels en succession due to the resulting selling pressure.
On the 4-hora chart, 0.3230 is an important support level, and as long as it remains above this level, an upward trend is expected. If this support level is broken, selling pressure may increase.
Support levels: 0.3395 – 0.3300 – 0.3230
Resistances: 0.3465 – 0.3555 – 0.3620
SUI/USDT
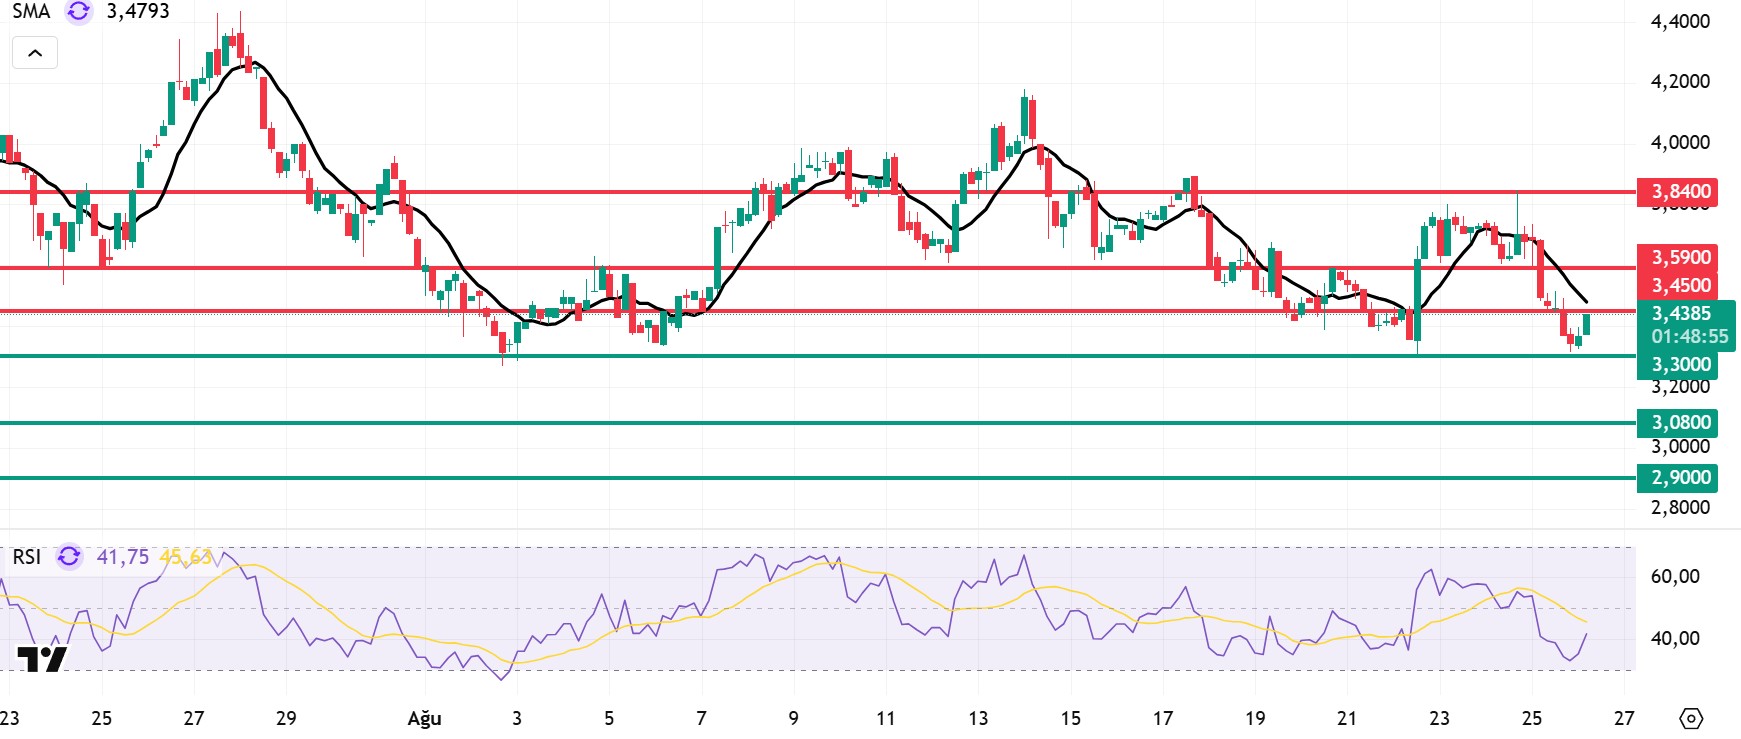
Looking at Sui’s technical outlook, the price has declined el a weekly basis, retreating to the 3.43 dollar level, influenced por fundamental developments. The Relative Strength Index (RSI) is currently en the 41.75 – 45.65 range. This value range indicates that the market is trading near the sell zone, while a weakening RSI falling to the 30.00 – 35.00 range could signal a potential buy point. If the price moves upward, the resistance levels of 3.45, 3.59, and 3.84 dollars can be monitored. However, if the price falls to new lows, it may indicate that selling pressure is intensifying. In this case, the 3.30 and 3.08 dollar levels stand out as strong support zones. In particular, en the event of sharp sell-offs, a pullback to 2.90 dollars is technically possible.
According to Simple Moving Averages (SMA) data, Sui’s average price is currently at $3.47. If the price remains below this level, it indicates that the current downtrend may continue technically. The downward trend of the SMA also supports this situation.
Support levels: 2.90 – 3.08 – 3.30
Resistance levels: 3.45 – 3.59 – 3.84
Legal Notice
The investment information, comments, and recommendations contained herein do not constitute investment advice. Investment advisory services are provided individually por authorized institutions taking into account the risk and return preferences of individuals. The comments and recommendations contained herein are of a general nature. These recommendations may not be suitable for your financial situation and risk and return preferences. Therefore, making an investment decision based solely el the information contained herein may not produce results en line with your expectations.


