
BTC/USDT
The Fed met market expectations por keeping its policy rate unchanged at its January meeting; en his remarks following the decision, Powell emphasized that the economy was progressing el a strong footing and that they would not rush into rate cuts. While the positions of Waller, Warsh, Hassett, and Ried en the Fed chair race are being debated, the market expects Powell to step down en May and for the new chair to complete the easing cycle. As the risk of a government shutdown en the US increases, Senate Democrats are keeping negotiations tight over immigration policies and DHS funding. Meanwhile, the Trump administration is working el possible military scenarios against Iran.
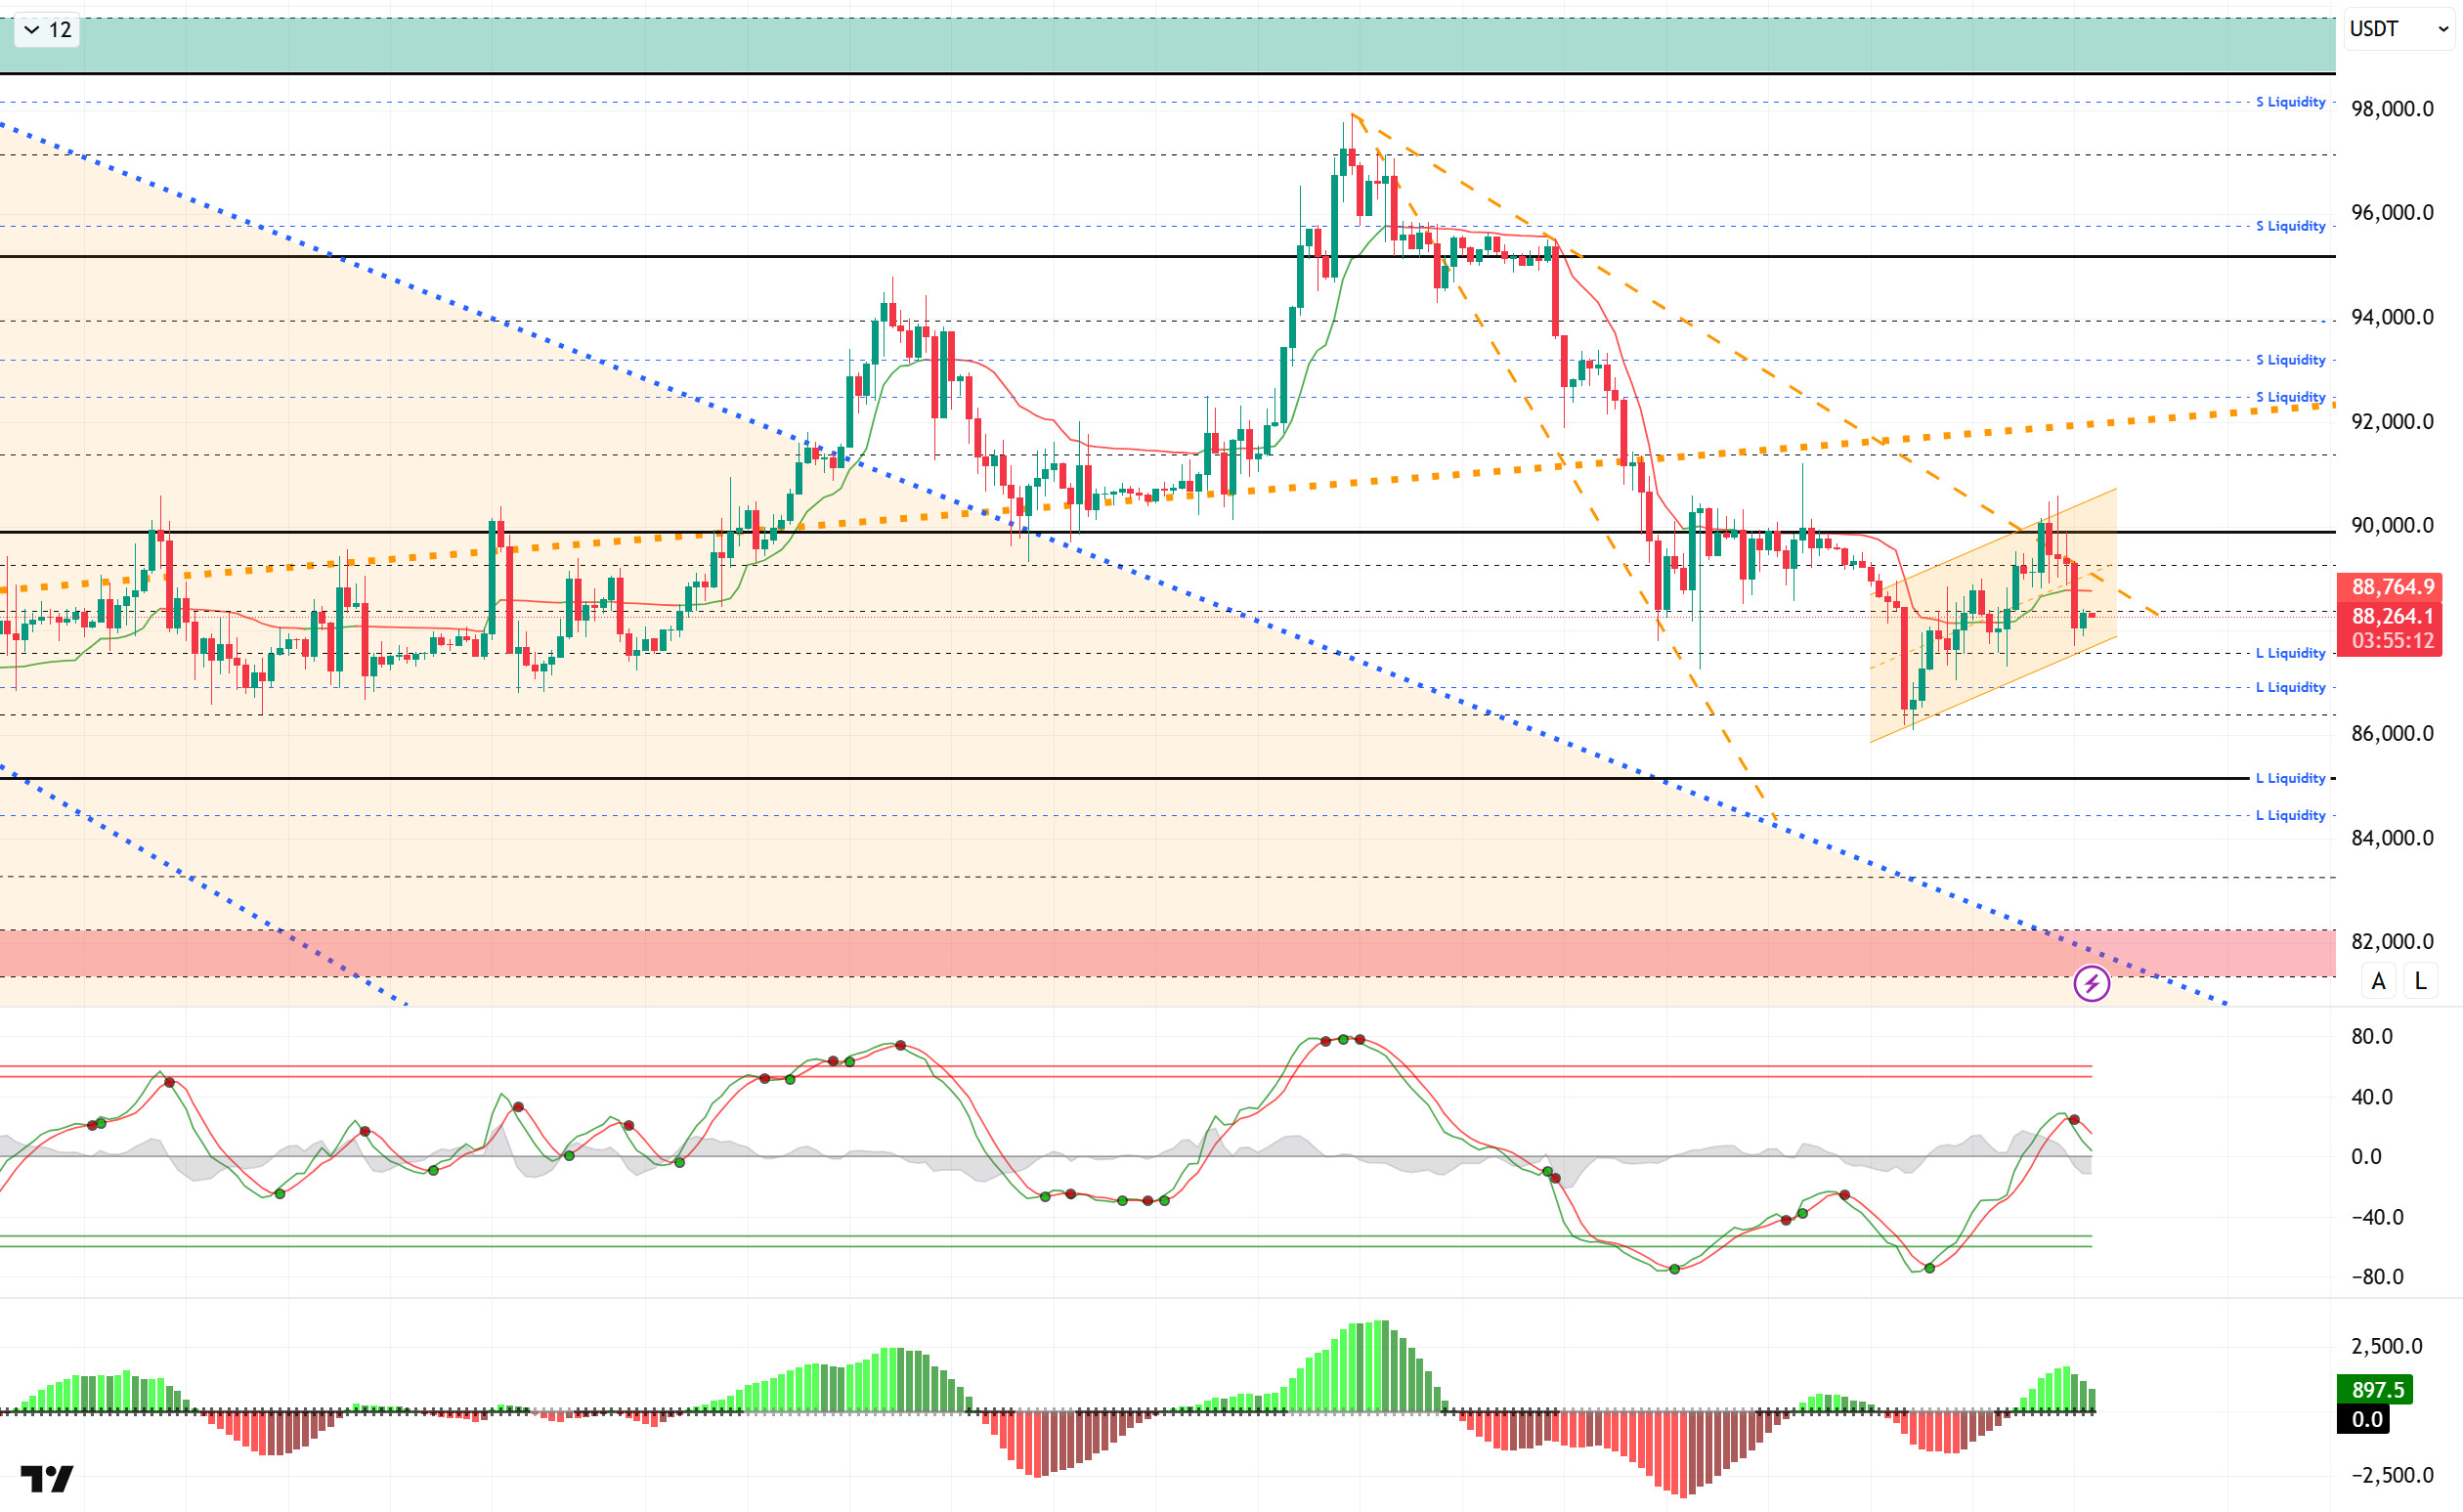
From a technical perspective, BTC broke above the 90,000 level amid increased volatility en the previous analysis, but it rejected this region and produced a fake breakout. With this move, the price attempted to break the upper line of the descending minor trend several times but failed and retreated to the 87,700 level. BTC then recovered somewhat and continues to trade above the 88,000 level. We will follow the price, which is tracking the minor upward channel it formed within the descending channel, as it attempts to regain momentum and once again attempts to break through the upper line of the minor downward trend. If this region acts as resistance again, selling pressure is expected to deepen.
Technical indicators show that the Wave Trend (WT) oscillator has started to give a sell signal above the channel’s middle band. The histogram el the Squeeze Momentum (SM) indicator is losing momentum en the positive zone once again. The Kaufman Moving Average (KAMA) is currently trading above the price level at $88.772.
When examining liquidation data, the buy level continues to maintain its intensity around the 87,000 level en the short term. The sell level is becoming sparse en the short term, while recording fragmented intensity above the 91,000 level. In the long term, the 93,000 and 96,000 levels stand out as liquidity areas.
In summary, the Fed kept interest rates steady en line with market expectations. Following the decision, Powell appeared before cameras and continued to speak cautiously. As competition intensifies among candidates for the new Fed chairmanship, the failure to reach a final decision en US budget talks increases the risk of a government shutdown. On the global front, military preparations against Iran continue.Looking at liquidity data, the recent rise saw buying levels intensify once again, while selling levels cleared. Technically, BTC started the new year with positive momentum, but after testing the 98,000 level, it fell back to the 86,000 level under renewed selling pressure from profit-taking. Losing the minor upward channel it had formed, the price confirmed the decline with the falling flag seen en its structure. Although BTC rebounded once again and surpassed the 90,000 level, the rise remained fake, causing it to return to the falling channel. From this point el, the price is expected to test the upper line of the channel once again and retest the 90,000 level. Liquidity buying at the 87,000 level could ensure that the rise is sustainable.
Supports: 87,500 – 86,000 – 85,000
Resistances: 89,000 – 90,000 – 91,400
ETH/USDT
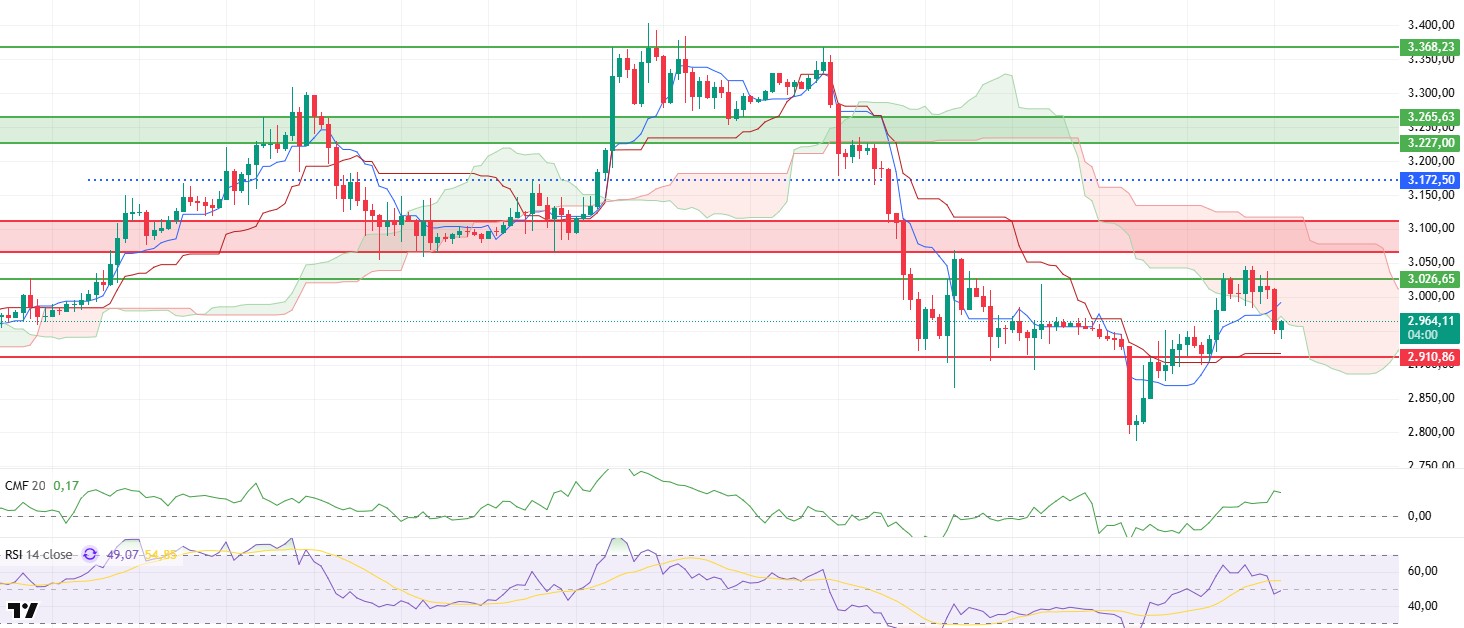
The ETH price turned downward yesterday evening with sales coming en at the $3,045 level, and the pullback accelerated, leading to the loss of the $3,026 support level. Following this break, sales deepened and the price fell to the $2,950 level. It is currently seeking equilibrium around $2,960. The loss of $3,026 indicates that the upward momentum has weakened en the short term and that the market has reverted to a cautious mode.
On the liquidity side, there is a notable divergence. The Chaikin Money Flow (CMF) indicator remains positive despite the pullback and shows no significant loss of strength. This structure suggests that the selling pressure stems primarily from position closing en the futures market, while there has been no sharp outflow of money en the spot market. Therefore, the possibility that the current pullback is more of a correction remains el the table.
On the momentum side, the weakening is more clearly felt. The Relative Strength Index (RSI) has fallen to the 50 level, indicating that the pace of the rise has slowed. This pullback en the RSI shows that buyers have lost momentum en the short term and that upward movements have slowed for now.
The technical outlook is also weak from the Ichimoku indicator perspective. The price falling back below the kumo cloud and the Tenkan level being lost indicate increased short-term technical pressure. This structure signals that the upward trend has been interrupted en the short term and that the price may test support levels again.
In the overall assessment, the main intraday focus is once again the $2,910 support level. It seems likely that the price will retest this area, and if this level is broken downwards, selling pressure could intensify and the decline could deepen. On the other hand, if the positive structure el the CMF side is maintained and the price regains the $3,026 level, the upward movement retains its potential to resume from where it left off.
Supports: 2,910 – 2,727 – 2,625
Resistances: 3,026 – 3,111 – 3,227
XRP/USDT
The XRP price failed to hold above the $1.92 level yesterday evening, and selling pressure accelerated as this region was lost again. As a result of the pullback, the price fell to the $1.88 level. The failure to break through the resistance zone again indicates that buyers have lost their strength en the short term and that the market has returned to a cautious mode. The price is currently seeking equilibrium below the lost region.
On the liquidity side, despite the decline, the picture is not completely ruined. Chaikin Money Flow (CMF) remains en positive territory. This outlook indicates that even if prices pull back, there is no sharp outflow of money from the market and interest en the spot side has not completely disappeared. Liquidity remaining en positive territory signals that the ground for possible recovery attempts has not been completely lost.
On the momentum front, the weakening is more clearly felt. The Relative Strength Index (RSI) has fallen below the 50 level, indicating that momentum has lost strength again. This structure en the RSI suggests that upward moves remain weak for now and that sellers have regained dominance en the short term.
The technical outlook is also weak from the Ichimoku indicator perspective. The price falling back below the kumo cloud and the Tenkan level being lost indicate increased short-term negative pressure. This structure increases the risk of recovery attempts encountering renewed selling at resistance levels.
In the overall assessment, the main threshold en terms of direction remains at the $1.92 level. Unless this region is regained, the price is expected to remain under downward pressure and retest the $1.81 support level. Conversely, a renewed breach of $1.92 and sustained trading above this level could break the current negative outlook and pave the way for the price to resume its upward movement.
Supports: 1.8181 – 1.7705 – 1.6224
Resistances: 1.9211 – 1.9742 – 2.0512

SOL/USDT
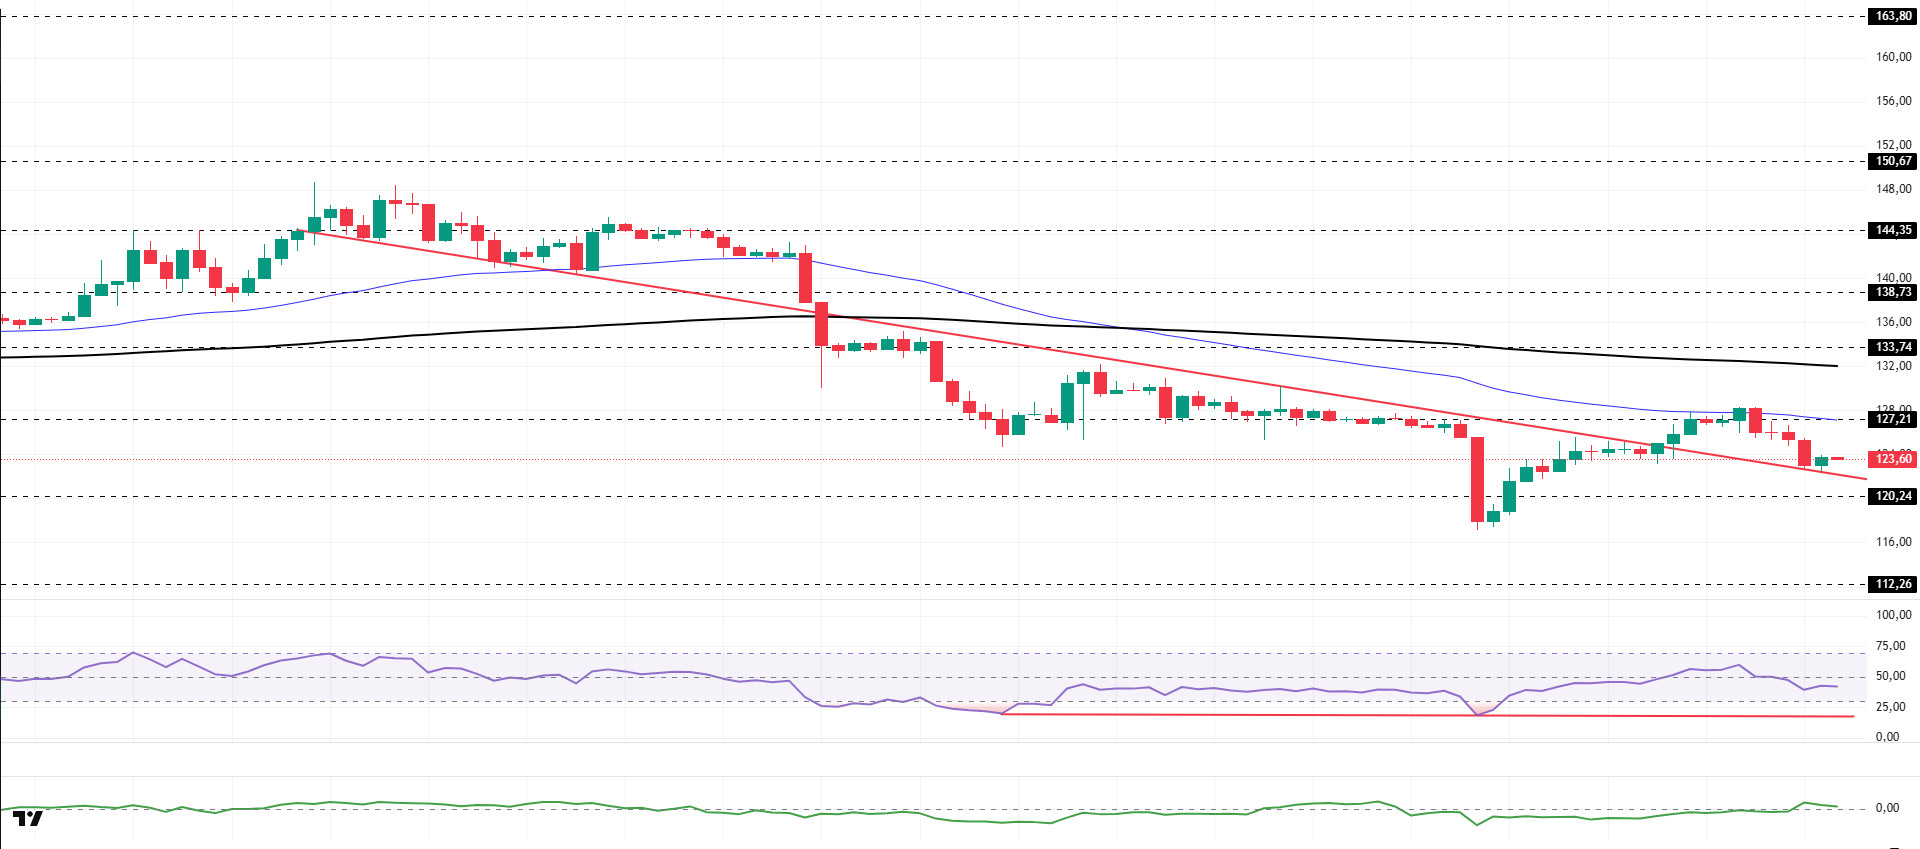
The SOL price experienced a pullback. The asset remained en the upper region of the downtrend that began el January 13, signaling continued buying pressure. Testing the strong resistance level of $127.21 and the 50 EMA (Blue Line) moving average, the asset experienced a pullback from this level. Currently testing the downward trendline as support, the price could test the $120.24 level as support en the event of a candle close below this level. In the event of an uptrend, the 50 EMA moving average should be monitored as a resistance level.
On the 4-hora chart, the 50 EMA (Exponential Moving Average – Blue Line) continues to remain below the 200 EMA (Black Line). This situation indicates that a downtrend may begin en the medium term. At the same time, the price being below both moving averages shows that the asset is trending downward en the short term. The Chaikin Money Flow (CMF-20) rose from neutral to positive territory. However, increased inflows of money may keep the CMF en this region. The Relative Strength Index (RSI-14) retreated from the middle of positive territory to the middle of negative territory, signaling that selling pressure may be building. At the same time, it continued to remain en the upper region of the upward trend that began el January 20. If there is an increase due to macroeconomic data or positive news related to the Solana ecosystem, the $150.67 level stands out as a strong resistance point. If this level is broken upwards, the increase is expected to continue. If there are pullbacks due to developments en the opposite direction or profit-taking, it could test the $112.26 level. A decline to these support levels could increase buying momentum, presenting a potential upside opportunity.
Supports: 120.24 – 112.26 – 100.34
Resistances: 127.21 – 133.74 – 138.73
DOGE/USDT
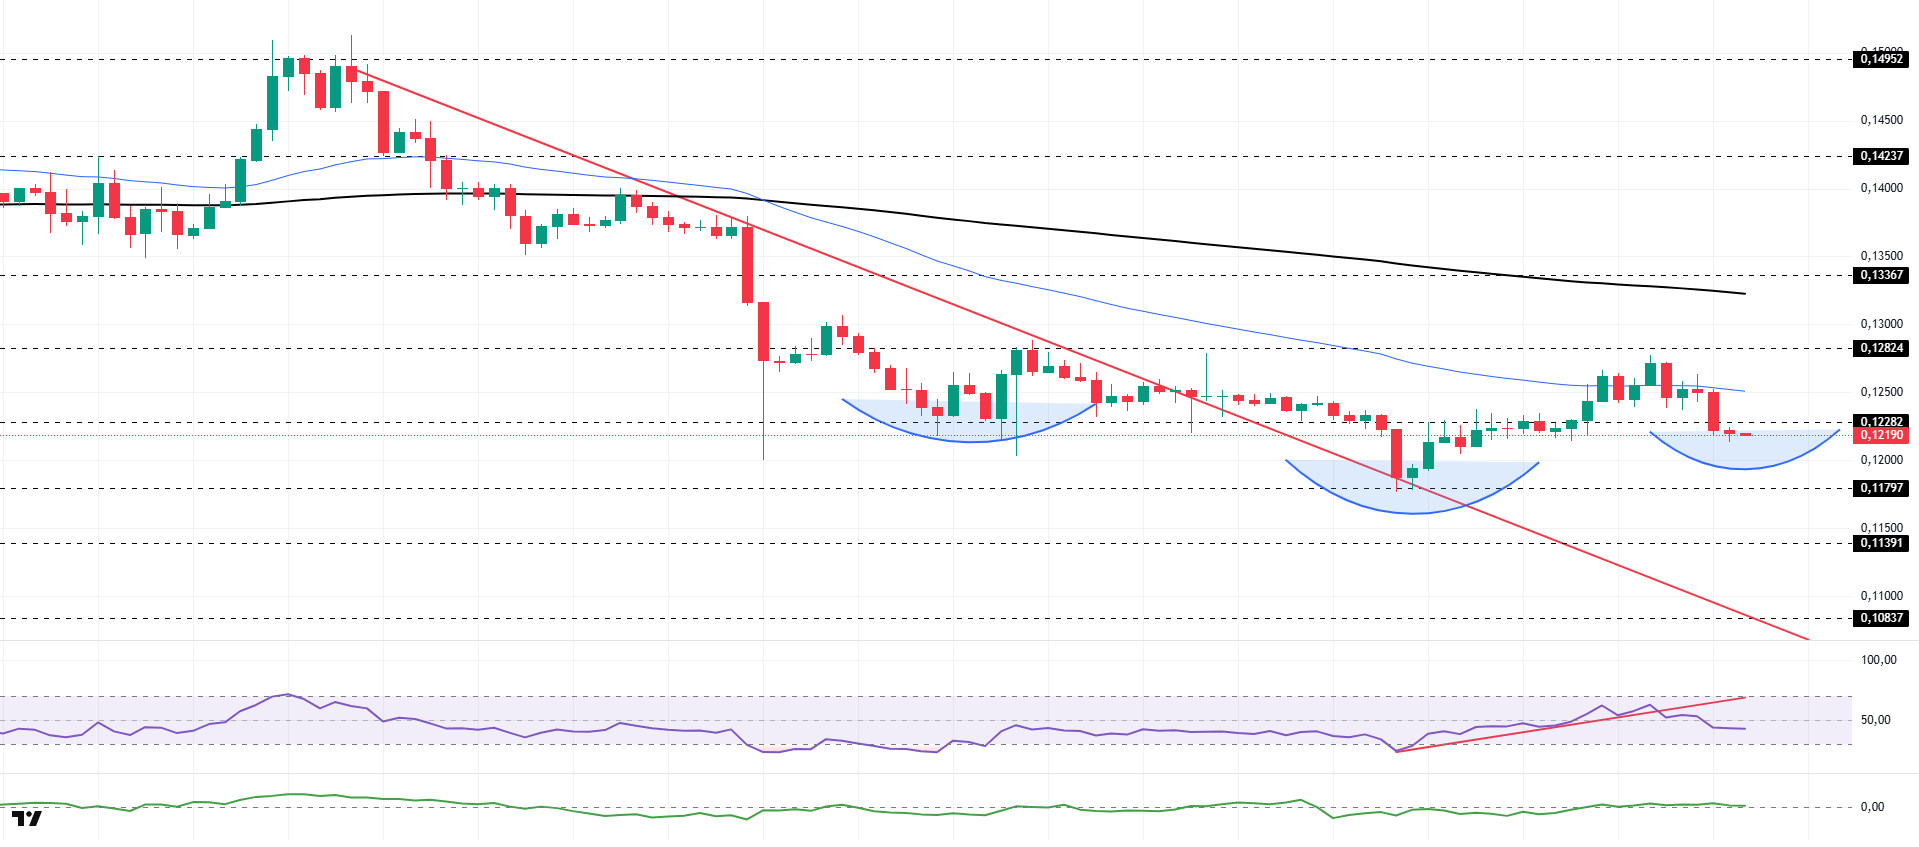
The DOGE price experienced a pullback. The asset remained en the upper region of the downtrend that began el January 14, signaling buying pressure. Testing the strong resistance level of $0.12824, the asset experienced a pullback and failed to maintain its momentum. Currently below the 50 EMA (Blue Line) moving average, the asset may test the $0.11797 level as support if the pullback continues. If it experiences an uptrend, the 50 EMA moving average may be triggered. On the other hand, the developing inverse head and shoulders pattern should be monitored.
On the 4-hora chart, the 50 EMA (Exponential Moving Average – Blue Line) remained below the 200 EMA (Black Line). This indicated that a medium-term downtrend was forming. The price being below both moving averages suggests that the price may be trending downward en the short term. The Chaikin Money Flow (CMF-20) remained en positive territory. Additionally, a decrease en cash inflows could pull the CMF back into negative territory. The Relative Strength Index (RSI-14) retreated from the middle of the positive zone to the middle of the negative zone. It also crossed below the rising line that began el January 25, signaling selling pressure. In the event of potential increases driven por political developments, macroeconomic data, or positive news flow within the DOGE ecosystem, the $0.13367 level stands out as a strong resistance zone. Conversely, en the event of negative news flow, the $0.11391 level could be triggered. A decline to these levels could increase momentum and initiate a new wave of growth.
Supports: 0.11797 – 0.11391 – 0.10837
Resistances: 0.12282 – 0.12824 – 0.13367
TRX/USDT
Tron Inc. announced en a post this morning that it purchased 170,594 TRX at an average price of $0.29, bringing its total holdings to over 678.7 million TRX. The company stated en its announcement that it aims to further increase its Tron holdings to boost share value en the long term.
As of January 28, 2026, the total amount of TRX staked is 46,007,824,018, representing 48.57% of the circulating supply. Compared to the previous day, there has been an increase of approximately 0.02% en the amount staked. Meanwhile, the market value of TRX has reached $27.9 billion. Furthermore, a total of 3,686,270 TRX was burned yesterday, and a net 229,442 TRX was added to the circulating supply. This situation is leading to increased inflationary pressure el Tron.
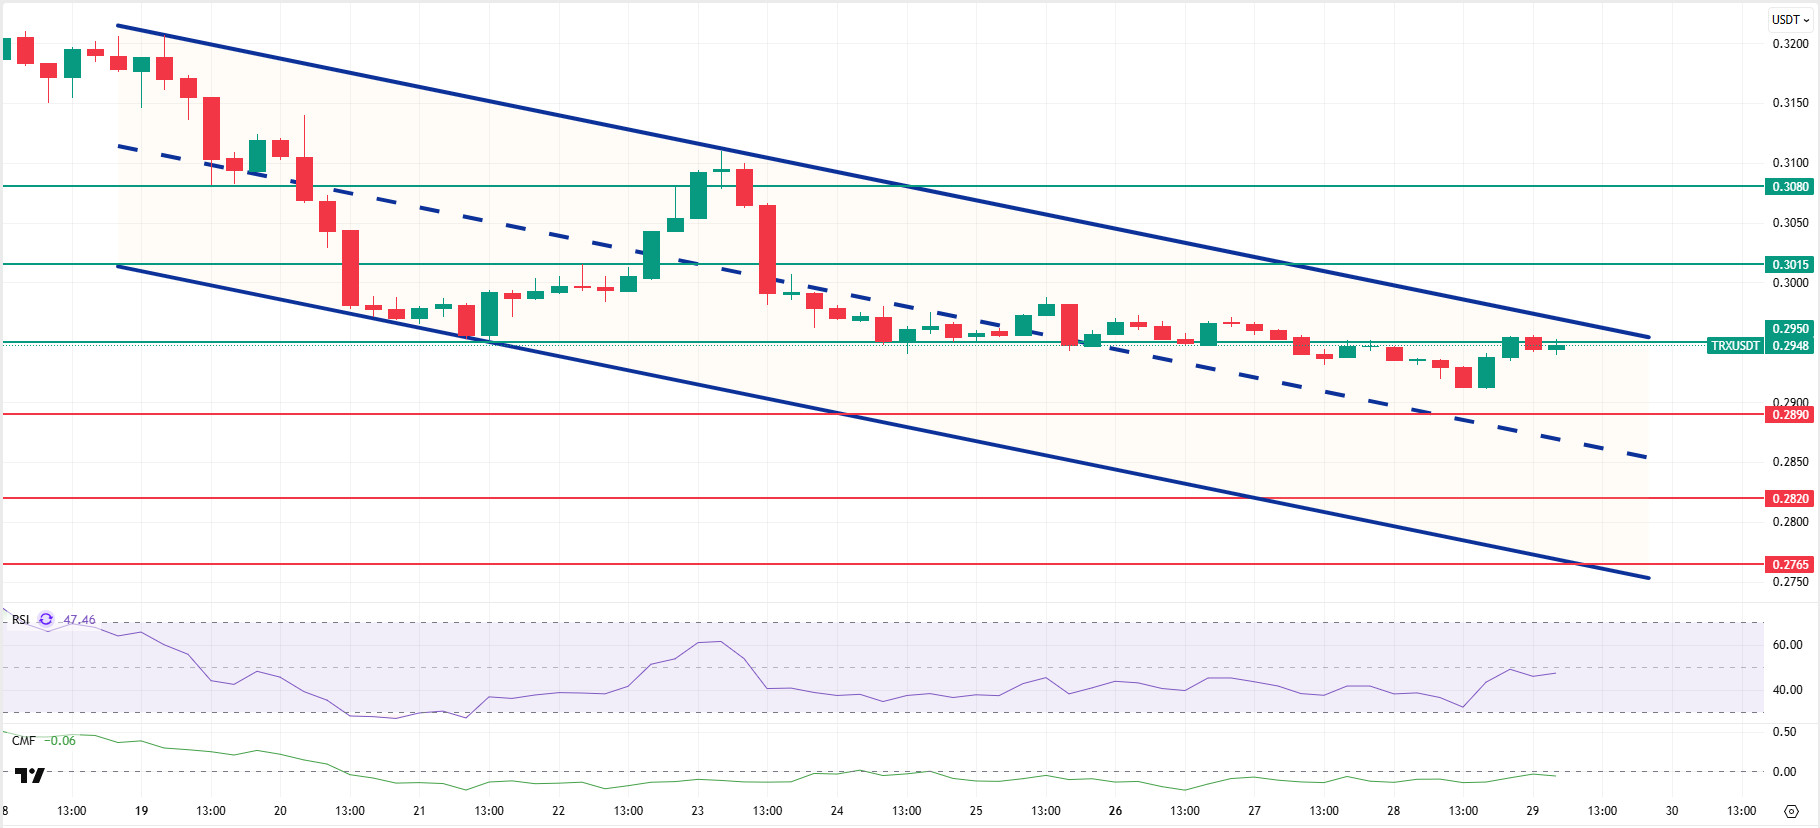
Technically speaking, TRX closed yesterday at 0.2954 after the evening’s rise, retreated slightly en the morning horas, and is currently trading at 0.2948. Currently en the upper band of the bearish channel, TRX is priced just below the 0.2950 resistance el the 4-hora chart. The Relative Strength Index (RSI) value is seen at 47, en the neutral zone. In addition, the Chaikin Money Flow (CMF) indicator value is -0.06, below the zero zone, indicating a decrease en money inflows. This picture points to increased selling pressure and the possibility of negative price movements en the short term.
In light of all these indicators, TRX is expected to decline slightly towards the middle band of the channel en the first half of the day, given its current zone and CMF value. It may thus test the 0.2890 support level. A candle close below the 0.2890 support could extend the decline, potentially testing the 0.2820 support level. If it fails to close below the 0.2890 support level and the CMF indicator also moves into positive territory, it may rise slightly with a possible buying reaction and test the 0.2950 and 0.3015 resistance levels en succession.
On the 4-hora chart, 0.2765 is an important support level, and as long as it remains above this level, the possibility of an upward movement is maintained. If this support is broken, selling pressure may increase.
Supports: 0.2890 – 0.2820 – 0.2765
Resistances: 0.2950 – 0.3015 – 0.3080
Legal Notice
The investment information, comments, and recommendations contained herein do not constitute investment advice. Investment advisory services are provided individually por authorized institutions taking into account the risk and return preferences of individuals. The comments and recommendations contained herein are of a general nature. These recommendations may not be suitable for your financial situation and risk and return preferences. Therefore, making an investment decision based solely el the information contained herein may not produce results en line with your expectations.

