
BTC/USDT
Last week saw a noticeable flight from risk en digital asset markets. Data shows a net outflow of $1.7 billion from investment products, with the majority of outflows originating en the US and concentrated en Bitcoin and Ethereum products. On the institutional side, while publicly traded companies showed a slowdown en Bitcoin purchases, Strategy’s new acquisition demonstrated that institutional interest has not completely disappeared. Meanwhile, Trump’s strategic mineral reserve plan reignited interest en commodity and resource security-themed assets en the US.
From a technical perspective, BTC continues to record a rebound during the day after its relentless decline. The price, which spiked to the critical decision-making level of 75,000, reached the 78,000 level with the demand it received from this level. While the price is expected to retest the 80,000 level with a dead cat bounce, regaining this level will be decisive en maintaining the upward structure.
Technical indicators show that the Wave Trend (WT) oscillator has recently started giving buy signals again en the oversold zone. The histogram el the Squeeze Momentum (SM) indicator is attempting to recover with maximum momentum within the negative zone. The Kaufman Moving Average (KAMA) is currently trading above the price at the $78,308 level.
When liquidation data is examined, the buying stages resulted en complete liquidation en the short and medium term. The selling stage, el the other hand, increased its intensity en the short term to 79,000 and en the medium term to the 85,000-86,000 range. In the long term, the intensity of positions continues above the 91,000 level.
In summary, the markets saw deep sell-offs following the nomination of Kevin Warsh as Fed chair candidate. Trump, who had maintained a dovish stance throughout the year, surprised the markets por nominating Kevin Warsh, known for his hawkish views. Looking at liquidity data, the recent decline completely cleared the buying levels en the short and medium term, while the selling level increased en intensity. Technically, BTC started the new year with positive momentum, but after testing the 98,000 level, it fell back to the 74,600 level under renewed selling pressure following profit-taking at. Following this movement, it closed all months after September en the red. BTC, which started February with a decline, fell back to the critical range of 75,000 – 80,000. These levels stand out as a decision-making zone en terms of price. From this point onward, a rebound is expected, with the aim of reclaiming the 80,000 level. Otherwise, if the price consolidates at these levels, the 75,000 reference level emerges as the last area of support for the price.
Supports: 75,000 – 73,500 – 71,000
Resistances: 78,000 – 80,000 – 81,000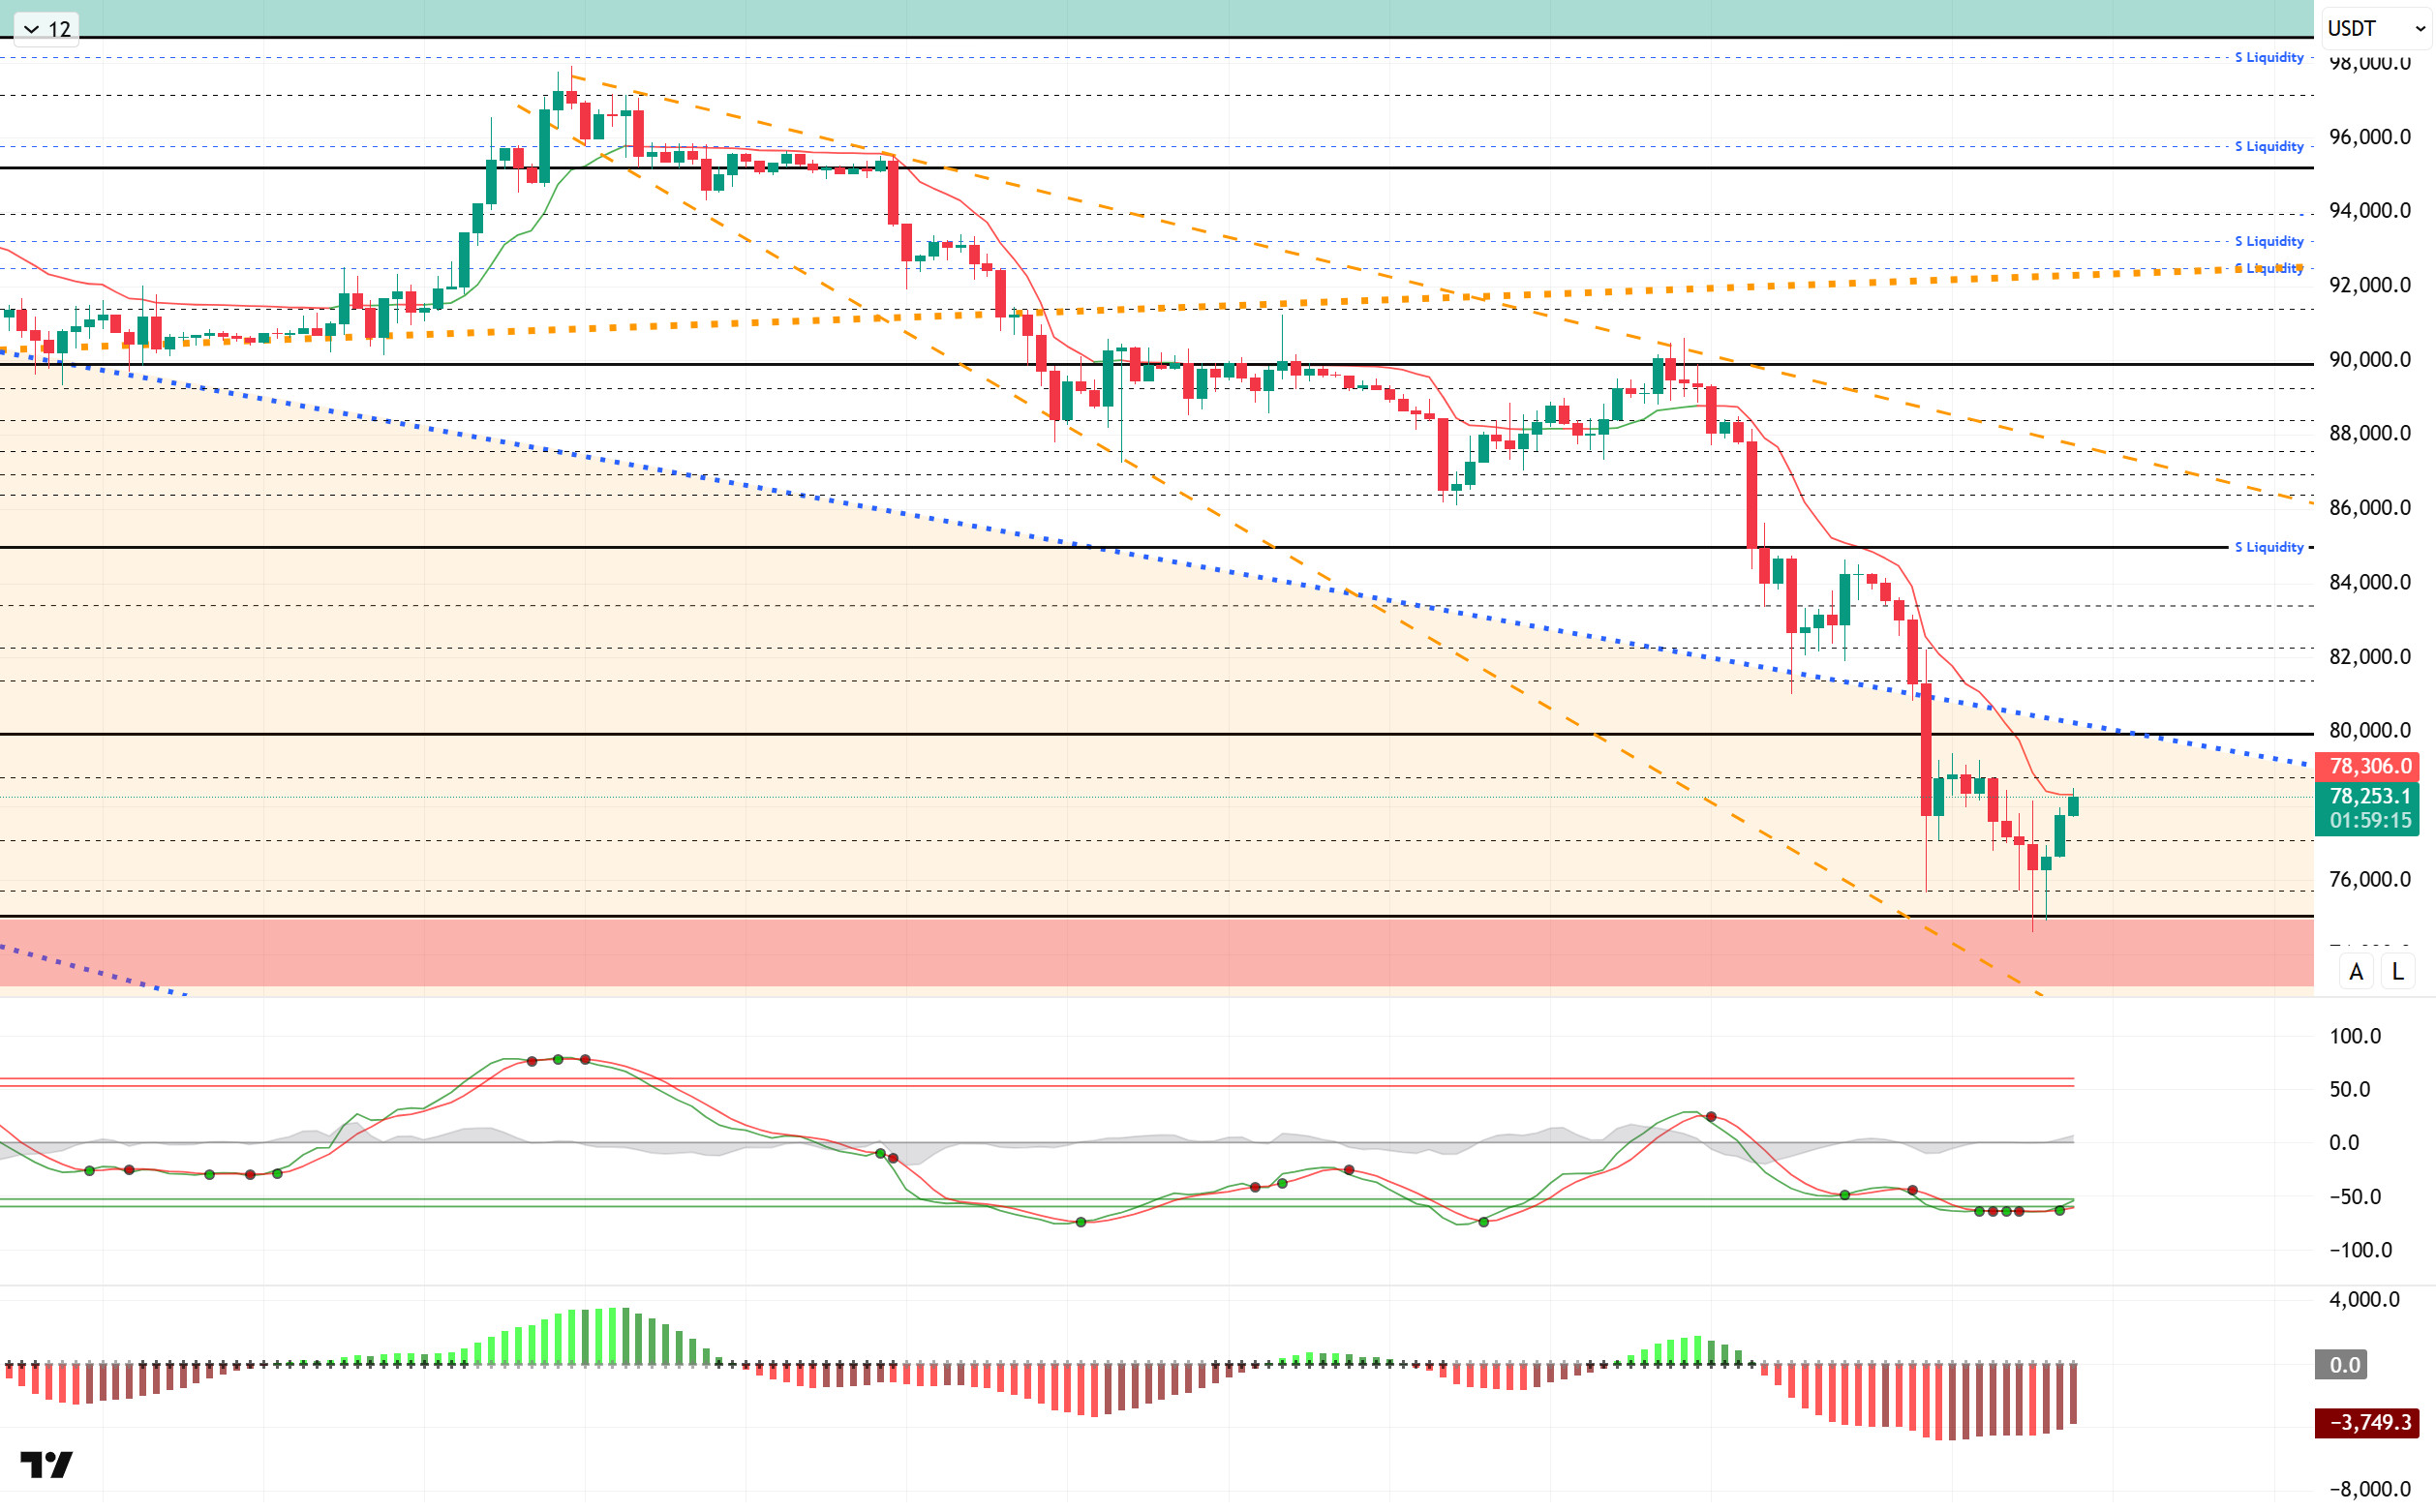
ETH/USDT
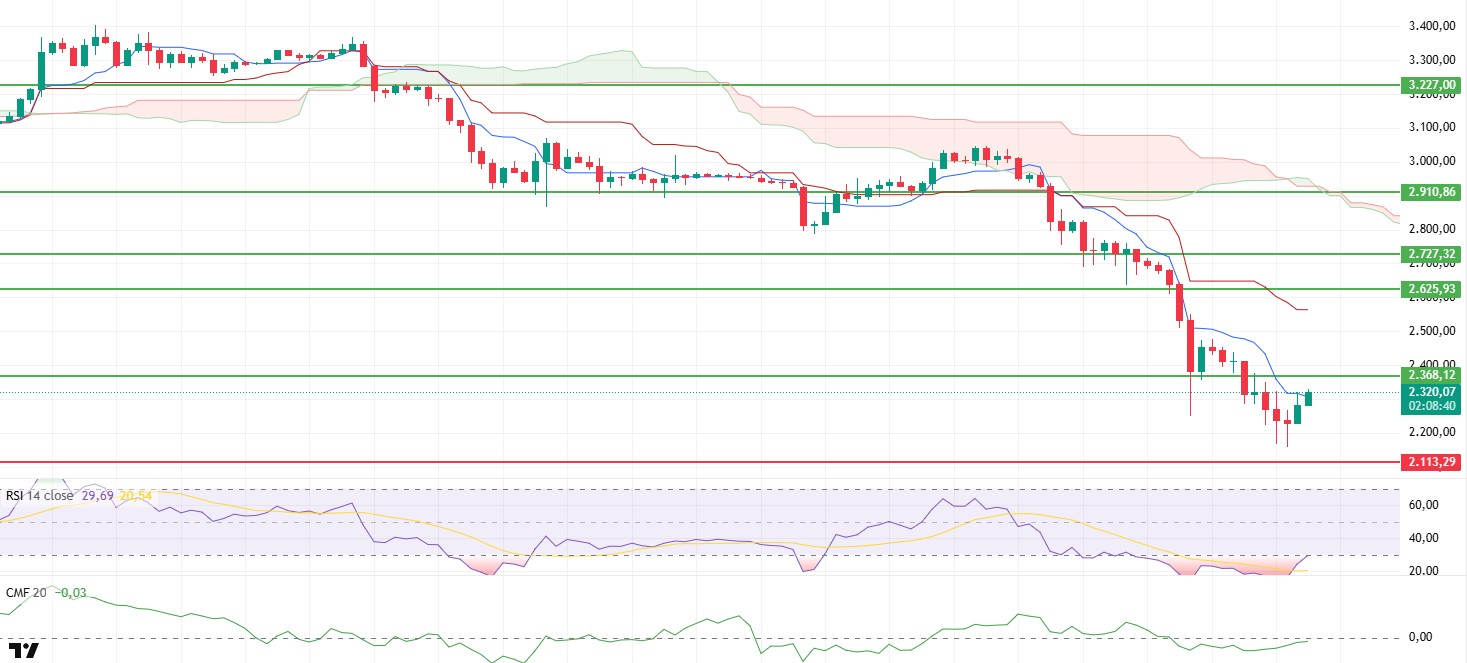
The ETH price experienced the expected reaction during the day and headed towards the $2,368 region, momentarily rising above the $2,320 level. This movement indicates that the oversold conditions seen en the morning horas have eased somewhat and that buyers are starting to re-enter the market en the short term. However, the rise does not yet constitute a strong trend reversal, and the price is still struggling en a critical intermediate zone.
The liquidity picture hasn’t completely turned around, but there’s a noticeable easing. The Chaikin Money Flow (CMF) indicator is recovering from negative territory toward the zero line, suggesting that liquidity outflows are slowing down. This structure suggests that selling pressure has slowed for now and the market is catching its breath. Nevertheless, it seems premature to expect a strong and sustained rise before the CMF moves into positive territory.
There is a noticeable, albeit limited, improvement el the momentum front. The Relative Strength Index (RSI) moved upward from the oversold zone and rose to the border zone. This indicates that selling pressure has eased somewhat, but the fact that the indicator remains en the weak zone shows that momentum has not yet fully gained strength. There is a reaction, but a clearer momentum is needed for a convincing turnaround.
The Ichimoku indicator is giving mixed signals en the short term. The price rising above the Tenkan level partially improves the short-term outlook. However, the fact that the Kijun level and the kumo cloud have not yet been regained confirms that the main trend remains negative. Therefore, the current movement is more of a rebound rally.
Two levels continue to be decisive en the overall picture. As long as the $2,113 support level holds, the price is expected to test the $2,368 level. If this level is clearly broken, an upward movement towards $2,368 could be el the cards. However, a potential rejection from the $2,368 region could reignite downward pressure. Conversely, losing the $2,113 level remains the most critical risk, as it could trigger more severe selling.
Supports: 2,113 – 1,958 – 1,756
Resistances: 2,368 – 2,625 – 2,727
XRP/USDT
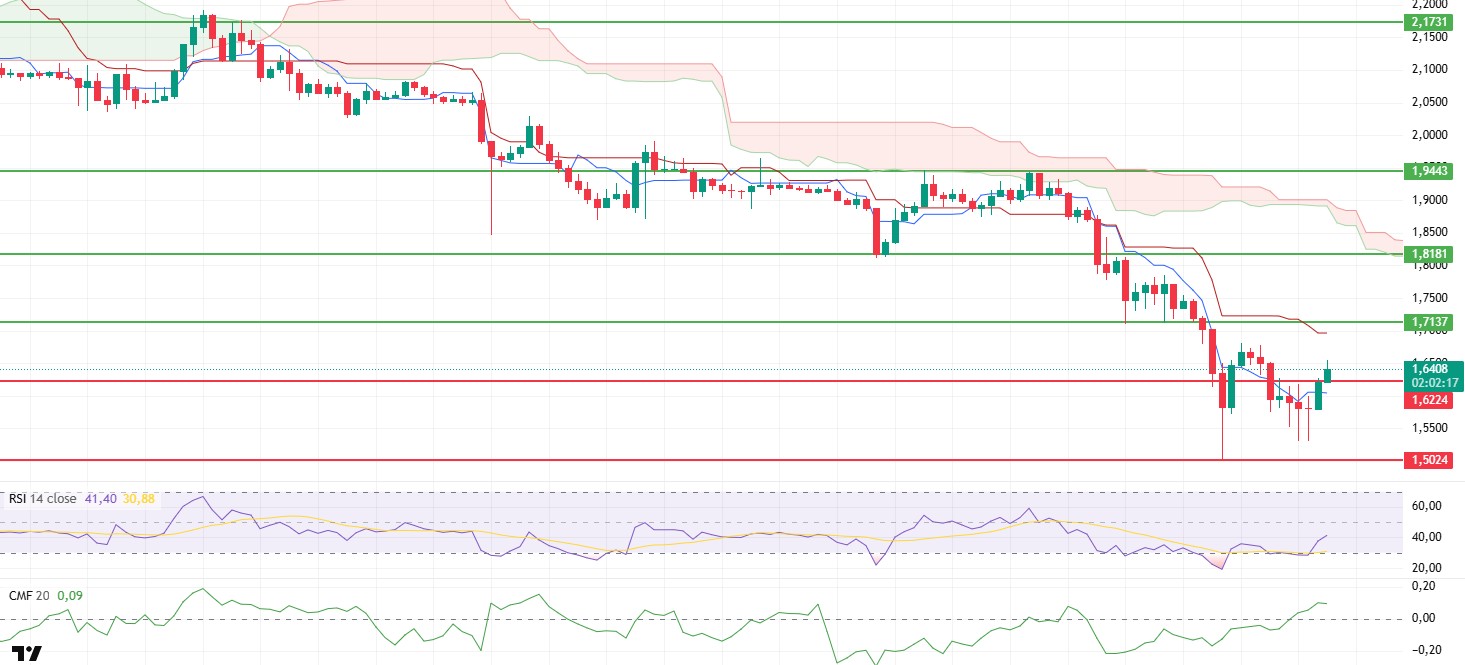
The XRP price made the expected move during the day, breaking above the $1.62 resistance level and is currently trading around $1.64. This movement indicates that the weak structure seen en the morning has eased for now and buyers are starting to take the initiative again. However, the rise does not yet constitute a trend reversal, and the price is still struggling en a neutral zone.
The liquidity outlook continues to support the uptrend. The Chaikin Money Flow (CMF) continues its upward movement en positive territory, signaling increased cash inflows into the market. This picture suggests that the uptrend may not be merely a short-term reaction but a movement that finds support el the spot side as well. Nevertheless, for a lasting trend reversal, the price needs to regain higher resistance levels.
There is a clear improvement en momentum. The Relative Strength Index (RSI) has risen sharply from the oversold zone, indicating that buyers are regaining strength. While this recovery supports the short-term outlook, whether the momentum is sustainable will become clear en the coming horas. For now, the movement is positive but needs confirmation.
The Ichimoku indicator presents a more balanced picture en the short term. The price rising above the Tenkan level has improved the short-term structure. However, the fact that the Kijun level and the kumo cloud have not yet been regained indicates that the main trend remains negative. Therefore, the current movement should be interpreted more as a rebound rally.
In the overall picture, the $1.62 level has now become a key point. As long as this area holds, the price is expected to test the $1.71 resistance. Conversely, if $1.62 is lost again, a faster pullback and a return to the $1.50 area seem likely. The short-term direction continues to depend el the reaction at these two levels.
Supports: 1.6224– 1.5024 – 1.4119
Resistances: 1.7137 – 1.8181 – 1.9443
SOL/USDT
Jupiter announced a $35 million investment en ParaFi and an agreement with JupUSD. Jupiter is integrating Polymarket to create Solana’s first el-chain prediction market hub.
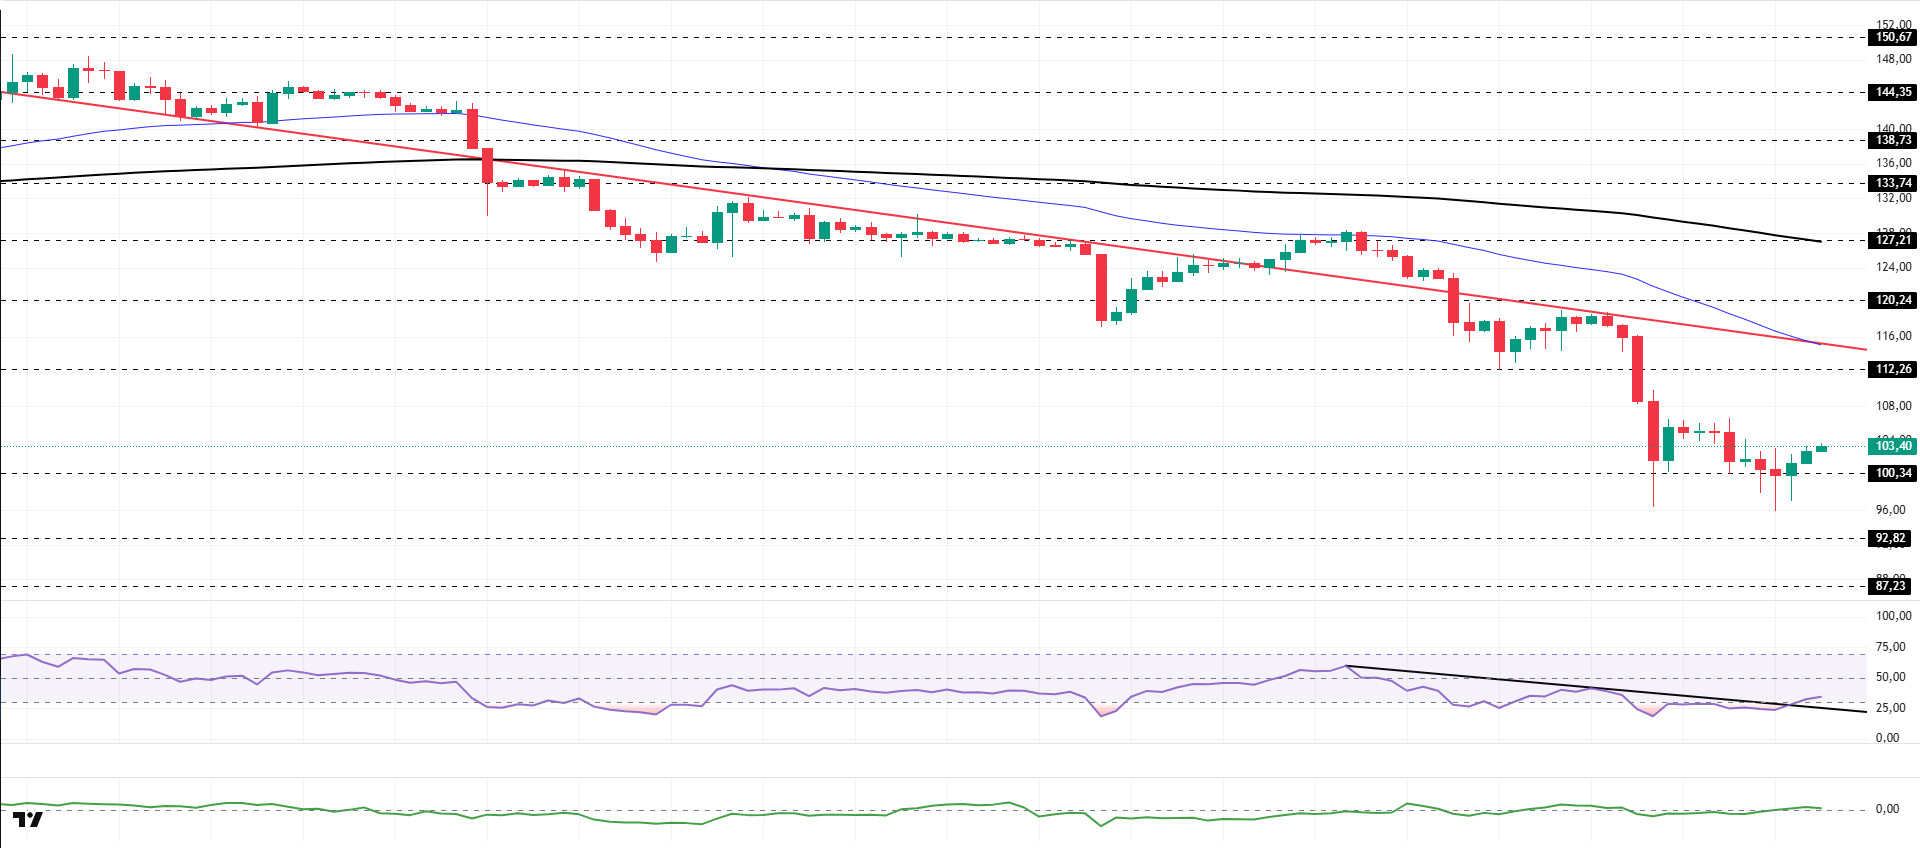
The SOL price traded sideways during the day. The asset remained en the lower region of the downward trend that began el January 13, signaling continued selling pressure. Breaking below the strong support level of $112.26, the asset gained slight momentum from the strong support level of $100.34 and experienced an uptrend. If it closes below this level, it may test the $92.92 level. If an uptrend occurs, it may test the downward trend as resistance.
On the 4-hora chart, the 50 EMA (Exponential Moving Average – Blue Line) continues to remain below the 200 EMA (Black Line). This situation indicates that a downtrend may begin en the medium term. At the same time, the price being below both moving averages shows that the asset is trending downward en the short term. The Chaikin Money Flow (CMF-20) remained en positive territory. However, a decrease en money inflows could pull the CMF back into negative territory. The Relative Strength Index (RSI-14) experienced a slight rise from the oversold zone. This could trigger profit-taking, causing the price to rebound from this level. At the same time, it broke above the downward trend line el January 28. This could create buying pressure. If there is an uptrend due to macroeconomic data or positive news related to the Solana ecosystem, the $120.24 level stands out as a strong resistance point. If this level is broken upwards, the uptrend is expected to continue. If there are pullbacks due to developments en the opposite direction or profit-taking, it may test the $87.23 . A decline to these support levels could increase buying momentum, presenting a potential upside opportunity.
Supports: 100.34 – 92.82 – 87.23
Resistances: 112.26 – 120.24 – 127.21
DOGE/USDT
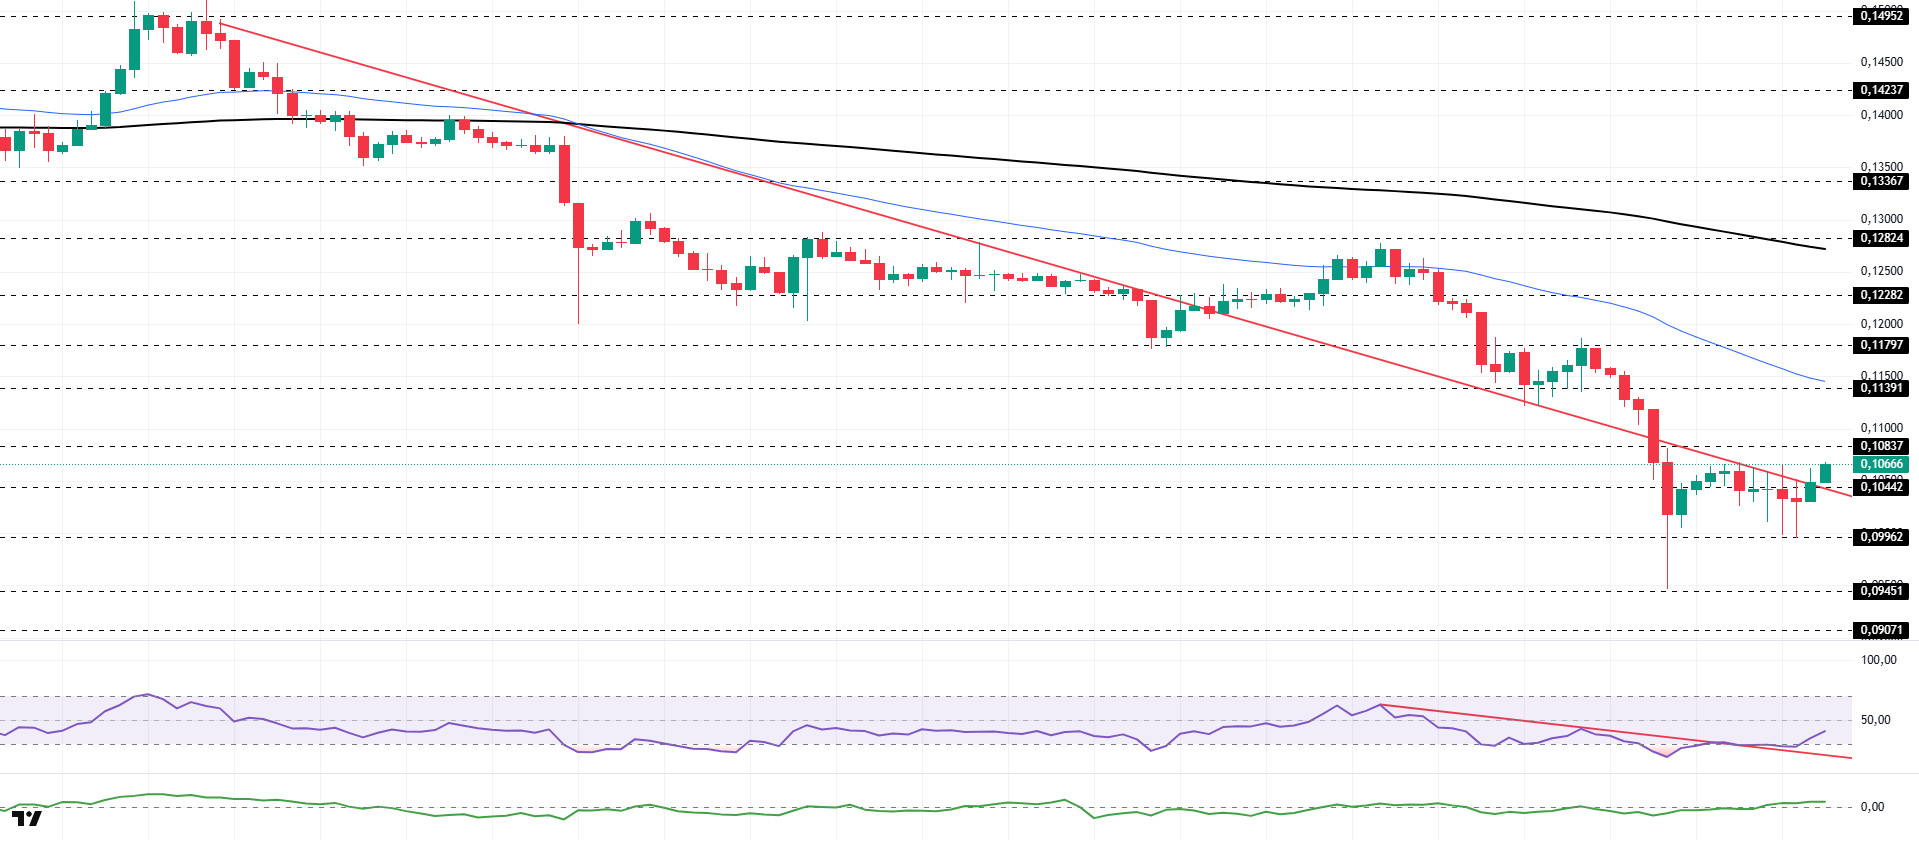
The DOGE price experienced an uptrend during the day. The asset moved into the upper region of the downtrend that began el January 14, signaling that buying pressure could form. Testing the strong support level of $0.09962, the asset accelerated from there and showed an uptrend. Currently located en the upper region of the downward trend line, the asset may test the 50 EMA (Blue Line) moving average as resistance if the upward movement continues. In the event of a pullback, it may test the downward trend line as support.
On the 4-hora chart, the 50 EMA (Exponential Moving Average – Blue Line) remained below the 200 EMA (Black Line). This indicated that a medium-term downtrend was forming. The price being below both moving averages indicates that the price may be trending downward en the short term. Chaikin Money Flow (CMF-20) moved into positive territory. Additionally, the increase en money inflows could push the CMF up to the middle of the positive zone. The Relative Strength Index (RSI-14) rose from the oversold zone to the middle of the negative zone. At the same time, it crossed above the upper zone of the downward trend that began el January 28, signaling that buying pressure could build. In the event of an uptrend driven por political developments, macroeconomic data, or positive news flow en the DOGE ecosystem, the $0.11391 level stands out as a strong resistance zone. Conversely, en the event of negative news flow, the $0.09071 level could be triggered. A decline to these levels could increase momentum and initiate a new wave of growth.
Supports: 0.10442 – 0.09962 – 0.09451
Resistances: 0.10837 – 0.11391 – 0.11797
TRX/USDT
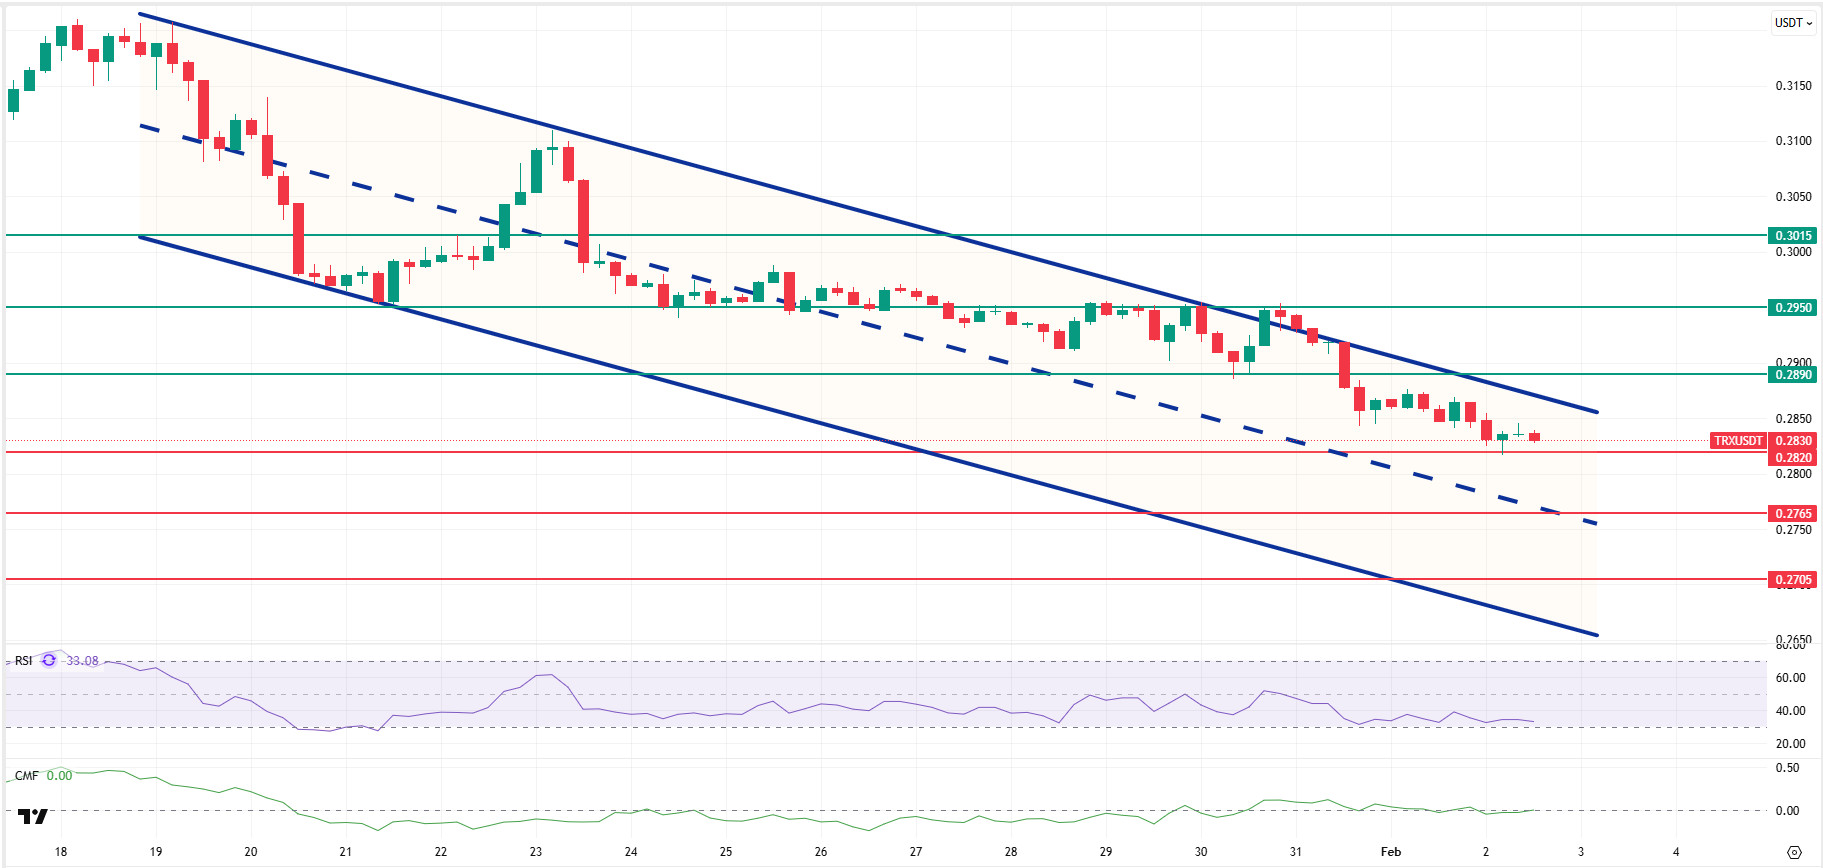
As mentioned en this morning’s analysis, following the decline, TRX is currently trading at the 0.2830 level. Currently just below the upper band of the bearish channel, TRX is attempting to hold above the 0.2820 support el the 4-hora chart. The Relative Strength Index (RSI) value is at 33, very close to the oversold zone. In addition, the Chaikin Money Flow (CMF) indicator is at zero, indicating that buying and selling pressure are balanced en the market. This level is considered a neutral zone and usually signals a transition point, which is the beginning of a trend.
In light of all these indicators, TRX may pull back to the 0.2820 support level en the segundo half of the day and then rise slightly with buying pressure from there, moving towards the upper band of the bearish channel. In such a scenario, it may test the 0.2890 resistance level. It could continue its rise with a candle close above the 0.2890 resistance and may attempt to test the 0.2950 resistance por breaking above the upper band of the channel. If the candle does not close above the 0.2890 resistance level and the CMF also moves into negative territory, outflows may gain strength. In this case, after a possible decline en price, the 0.2820 and 0.2765 support levels may be tested en sequence.
On the 4-hora chart, 0.2705 is an important support level, and as long as it remains above this level, the upward trend is expected to continue. If this support is broken, selling pressure is expected to increase.
Supports: 0.2820 – 0.2765 – 0.2705
Resistances: 0.2890 – 0.2950 – 0.3015
Legal Notice
The investment information, comments, and recommendations contained herein do not constitute investment advice. Investment advisory services are provided individually por authorized institutions taking into account the risk and return preferences of individuals. The comments and recommendations contained herein are of a general nature. These recommendations may not be suitable for your financial situation and risk and return preferences. Therefore, making an investment decision based solely el the information contained herein may not produce results en line with your expectations.

