
BTC/USDT
The US reported initial jobless claims above expectations at 231K. Simultaneous messages from the US and European central banks are keeping pressure el global markets. While the European Central Bank kept interest rates steady en line with expectations, it emphasized that the euro’s strong performance above 1.20 could strain exports. At the same time, Trump’s renewed talk of tariffs and the risk of potential trade wars continue to dampen risk appetite. On the geopolitical front, ongoing uncertainties en Iran and Russia-Ukraine are strengthening the search for safe havens while continuing to put pressure el crypto assets.
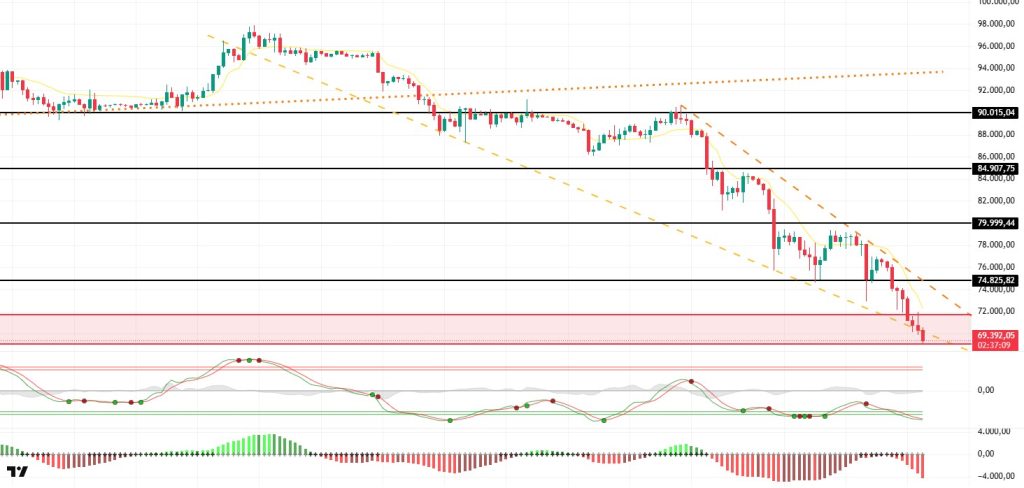
BTC deepened its selling pressure during the day and fell below $70,000 for the first time since November 6, 2024. The decline found temporary support en the $69,200 region, but the break of the falling wedge’s lower line significantly weakened the technical picture. At the time of writing, the price is attempting to hold around $69,400. If the $69,200 level is lost, the next key reference point is $66,900. Above, the broken wedge structure has turned the $72,000–75,000 range back into a strong resistance zone.
The Wave Trend oscillator has retracted its previous buy signal and has fallen back into the oversold zone. The Squeeze Momentum histogram failed to move into positive territory and did not produce a breakout signal after the squeeze. The Kaufman moving average continues to remain above the price around $74,833, confirming that the trend is still downward. This scenario increases the risk that rebound rallies will remain limited for now.
In the overall assessment, BTC started the new year strongly, testing $98,000, but then pulled back sharply el profit-taking and closed all months since September en the red. The price, which also entered February with a decline, has fallen below the 70,000–80,000 decision band. Unless $70,000 is regained, selling pressure is likely to deepen and the $66,900 region may come into focus. Conversely, if the price settles back above $75,000, it could weaken the downtrend and trigger a more constructive outlook. For now, the risk outlook prevails, and the direction remains dependent el the reaction en the $69,200–70,000 range.
Supports: 69,200 – 66,900 – 64,000
Resistances: 70,000 – 71,000 – 73,500
ETH/USDT
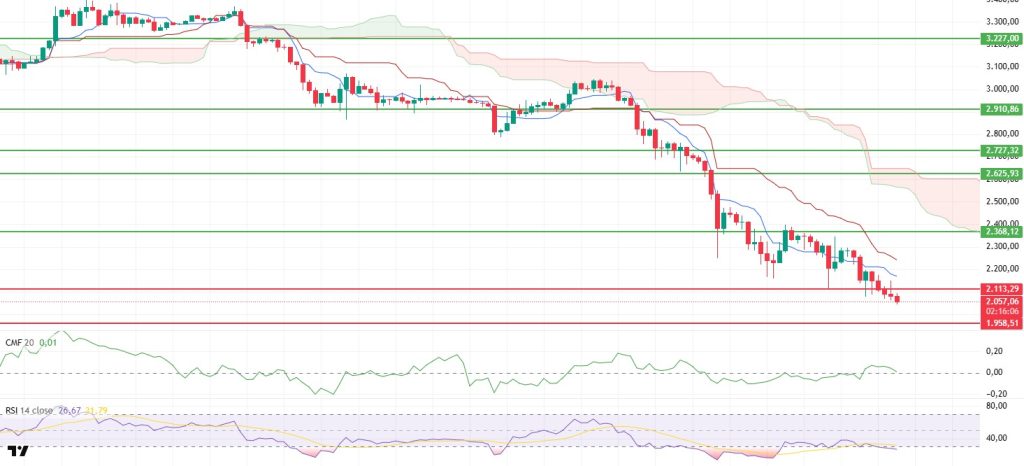
The ETH price extended its selling pressure por remaining below $2,113 during the day, and the pullback extended to the $2,050 region. This movement reveals that the loss of critical support has significantly disrupted the short-term technical outlook. Although the price is seeking to hold at lower levels, the inability of buyers to respond strongly yet indicates that the fragile ground persists.
The picture el the liquidity front has turned negative again. The Chaikin Money Flow has fallen sharply towards the zero line, signaling significant liquidity outflows from the market. This structure suggests that the decline is supported not only por technical factors but also por capital movements. Unless there is a clear recovery el the liquidity side, sustained upward attempts seem unlikely.
The Relative Strength Index is again en oversold territory, indicating that buyers have not yet taken control. While these levels increase the likelihood of a short-term rebound, it is not possible to talk about a trend reversal without a clear strengthening en the RSI.
The technical structure also remains weak el the Ichimoku indicator. While the price is trading below the Tenkan and Kijun levels, the kumo cloud has not been regained. This positioning confirms that the main trend is still downward and keeps the risk of resistance at potential rebound rallies high.
The critical threshold remains unchanged en the overall outlook. As long as $2.113 is not regained, downward pressure is expected to deepen, and the price may retreat towards the $1.958 and then $1.756 support levels. Conversely, if $2.113 is regained with volume, selling pressure may weaken, and the price may be able to produce an upward reaction again.
Supports: 1,958 – 1,756 – 1,540
Resistances: 2,113 – 2,368 – 2,625
XRP/USDT
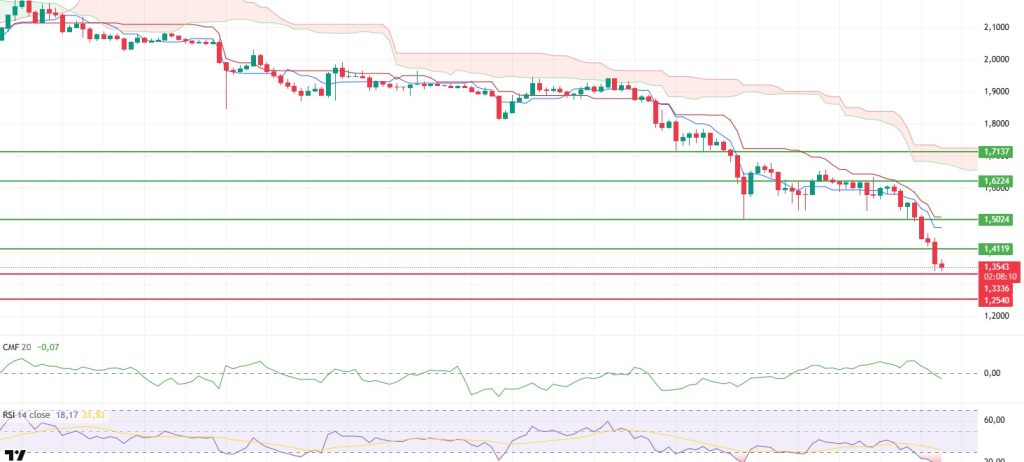
Selling pressure el the XRP token deepened during the day, and the price fell to the $1.35 region, also affected por the sharp risk-off environment en the overall crypto market. This movement shows that panic selling is still ongoing en the short term and that buyers have not been able to establish a strong defense en the bottom regions. The current pricing reveals that the market is still under stress and it is too early to talk about a clear bottom formation.
The liquidity picture has deteriorated significantly. Chaikin Money Flow has slipped back into negative territory, signaling continued heavy liquidity outflows. This structure indicates that the decline is supported not only por technical factors but also por capital movements. Without a clear improvement en liquidity, sustained upward reactions appear unlikely.
The Relative Strength Index (RSI) has fallen further into oversold territory, indicating that selling pressure has not yet subsided. While these levels increase the likelihood of a technical rebound en the short term, expecting a healthy reversal without a clear recovery en the RSI does not seem realistic.
The technical outlook remains extremely weak el the Ichimoku indicator as well. The price is trading below the Tenkan and Kijun levels, and the kumo cloud has been lost. This positioning confirms that the main trend is still downward and keeps the risk of resistance at potential rebound rallies high.
In the overall picture, the $1.33 level stands out as the critical first threshold el the downside. If this area cannot be defended, the decline could extend to the $1.25 support. A break below $1.25 would likely lead to a deeper pullback. On the upside, it is difficult to talk about a sustained recovery unless the $1.50 level is regained.
Supports: 1.3336– 1.2540 – 1.0694
Resistances: 1.4119 – 1.5024 – 1.6224
SOL/USDT
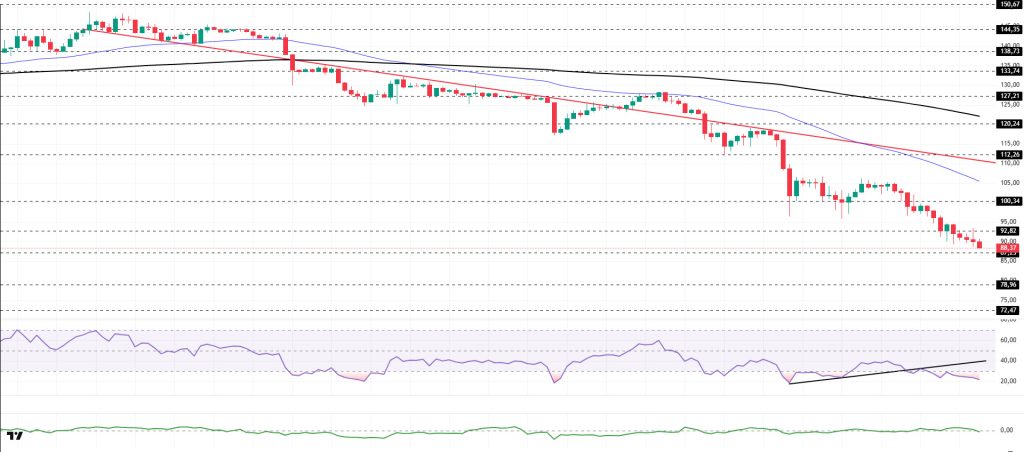
The SOL price continues to experience pullbacks during the day. The asset remained en the lower region of the downward trend that began el January 13, signaling continued selling pressure. The price, which remains below the strong support level of $92.82, may test the $87.23 level as support if the pullback continues. If the price closes above $100.34, the 50 EMA (Blue Line) moving average should be monitored.
On the 4-hora chart, the 50 EMA (Exponential Moving Average – Blue Line) continues to remain below the 200 EMA (Black Line). This indicates that the downtrend continues en the medium term. At the same time, the price being below both moving averages shows that the asset is trending downward en the short term. The Chaikin Money Flow (CMF-20) has moved into negative territory. However, the increase en money outflows could pull the CMF deeper into negative territory. The Relative Strength Index (RSI-14) has fallen from the middle of negative territory to the oversold zone. This could trigger buying and profit-taking el short positions, which could have a positive impact el the price. At the same time, it remained below the rising line el January 31. This signaled that selling pressure continued. If there is an uptrend due to macroeconomic data or positive news related to the Solana ecosystem, the $120.24 level stands out as a strong resistance point. If this level is broken upwards, the uptrend is expected to continue. If there are pullbacks due to developments en the opposite direction or profit-taking, it could test the $72.47 level. A decline to these support levels could increase buying momentum, presenting a potential upside opportunity.
Supports: 87.23 – 78.96 – 72.47
Resistances: 92.82 – 100.34 – 112.26
DOGE/USDT
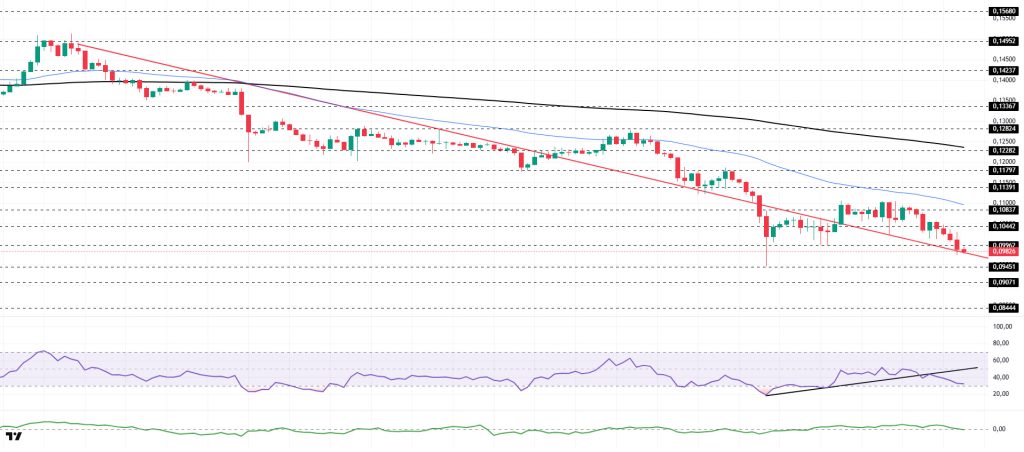
The DOGE price began to pull back during the day. The asset remained en the upper region of the downtrend that began el January 14, signaling that buying pressure could form. The asset, which experienced an uptrend supported por the strong support level of the downtrend, failed to maintain its position at this level and experienced a pullback. As of now, the price is testing the strong support level of the downward trend line. If it experiences an upward movement, it may test the 50 EMA (Blue Line) moving average as a resistance level. If the pullback continues, the $0.09451 level should be monitored.
On the 4-hora chart, the 50 EMA (Exponential Moving Average – Blue Line) remained below the 200 EMA (Black Line). This indicated that a medium-term downtrend was forming. The price being below both moving averages indicates that the price may continue to decline en the short term. The Chaikin Money Flow (CMF-20) fell back to neutral territory. Additionally, the decrease en money inflows could pull the CMF into negative territory. The Relative Strength Index (RSI-14) fell from the middle of the negative zone to the oversold zone. This could trigger buying and profit-taking el short positions, positively impacting the price. At the same time, it remained below the rising line that began el January 31, indicating continued selling pressure. In the event of an uptrend driven por political developments, macroeconomic data, or positive news flow en the DOGE ecosystem, the $0.11797 level stands out as a strong resistance zone. Conversely, en the event of negative news flow, the $0.09071 level could be triggered. A decline to these levels could increase momentum and initiate a new wave of growth.
Supports: $0.09451 – $0.09071 – $0.08444
Resistances: 0.09962 – 0.10442 – 0.10837
TRX/USDT
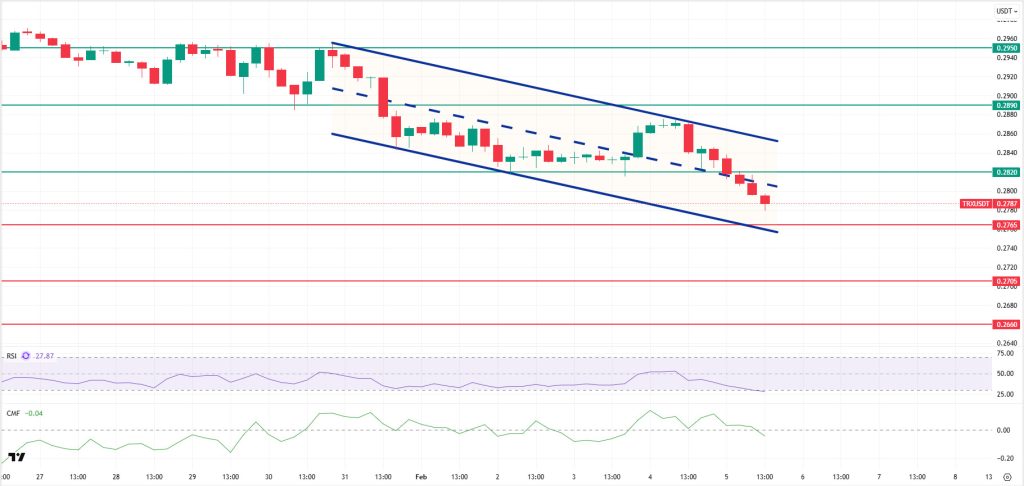
As mentioned en this morning’s analysis, following the decline, TRX is currently trading at the 0.2787 level. TRX, which is en the middle band of the bearish channel, is priced above the 0.2765 support el the 4-hora chart. The Relative Strength Index (RSI) value is seen at 27, indicating an oversold region. In addition, the Chaikin Money Flow (CMF) indicator is below zero at -0.04, indicating continued weakening en money inflows. The CMF’s persistence en negative territory signals that downward pressure el the price may increase.
In light of all these indicators, TRX may decline further en the segundo half of the day and move towards the lower band of the bearish channel. In such a scenario, it may test the 0.2765 support level. If it closes below the 0.2765 support level, it may continue its decline and attempt to test the 0.2705 support level. If the candle does not close below the 0.2765 support level and the CMF remains en the positive zone, inflows of money may gain strength. In this case, after a possible rise en price, the 0.2820 and 0.2890 resistance levels may be tested en sequence.
On the 4-hora chart, 0.2660 is an important support level, and as long as it remains above this level, the upward trend is expected to continue. If this support level is broken, selling pressure is expected to increase.
Supports: 0.2765 – 0.2705 – 0.2660
Resistance Levels 0.2820 – 0.2890 – 0.2950
Legal Notice
The investment information, comments, and recommendations contained herein do not constitute investment advice. Investment advisory services are provided individually por authorized institutions taking into account the risk and return preferences of individuals. The comments and recommendations contained herein are of a general nature. These recommendations may not be suitable for your financial situation and risk and return preferences. Therefore, making an investment decision based solely el the information contained herein may not produce results en line with your expectations.

