
Technical Analysis
BTC/USDT
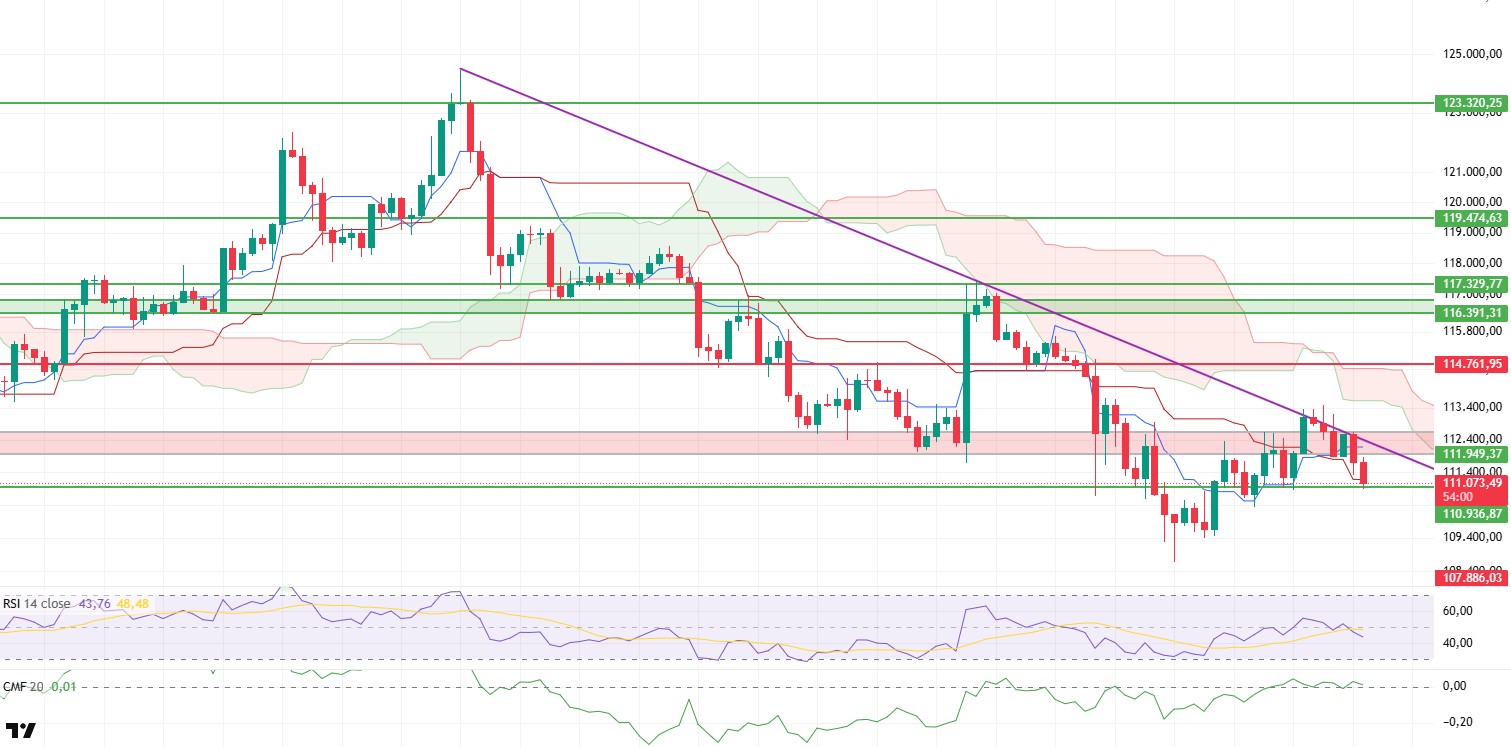
Bitcoin failed to close above the trend line yesterday evening, contrary to expectations, showing a weak performance and retreating to the $110,936 support level this morning. The decline to this level indicates that buyers have lost momentum en the short term and that the price is attempting to stabilize en a critical zone.
The Relative Strength Index (RSI) indicator falling below the MA and 50 level more clearly reveals the weakening momentum. Remaining below the 50 level, en particular, limits the possibility of an upward recovery and signals that selling pressure may continue.
However, the Chaikin Money Flow (CMF) indicator remaining en positive territory shows that liquidity inflows continue despite the price decline and that buyers’ appetite remains intact el the spot side. This picture reveals that, despite short-term selling pressure en the market, there is no significant decline en overall interest.
Although the price falling below the tenkan level en the Ichimoku indicator creates a weak outlook, the tenkan level still being above the kijun level indicates that the positive technical structure has not been completely broken. This positioning shows that the possibility of a price recovery is still el the table, making it more important to monitor critical levels.
The mixed picture en technical indicators suggests that breakout levels will be decisive en determining the direction of the Bitcoin price. If sustainability above the $110,936 support level cannot be achieved, selling pressure is likely to deepen and the price could retreat to the $107,886 level. Conversely, a strong rebound from this area and a move above the $111,949 level could pave the way for a renewed upward momentum. Therefore, it is critical to closely monitor price movements at both support and resistance levels.
Support levels: 110,936 – 107,886 – 103,794
Resistance levels: 114,761 – 116,391 – 117,329
ETH/USDT
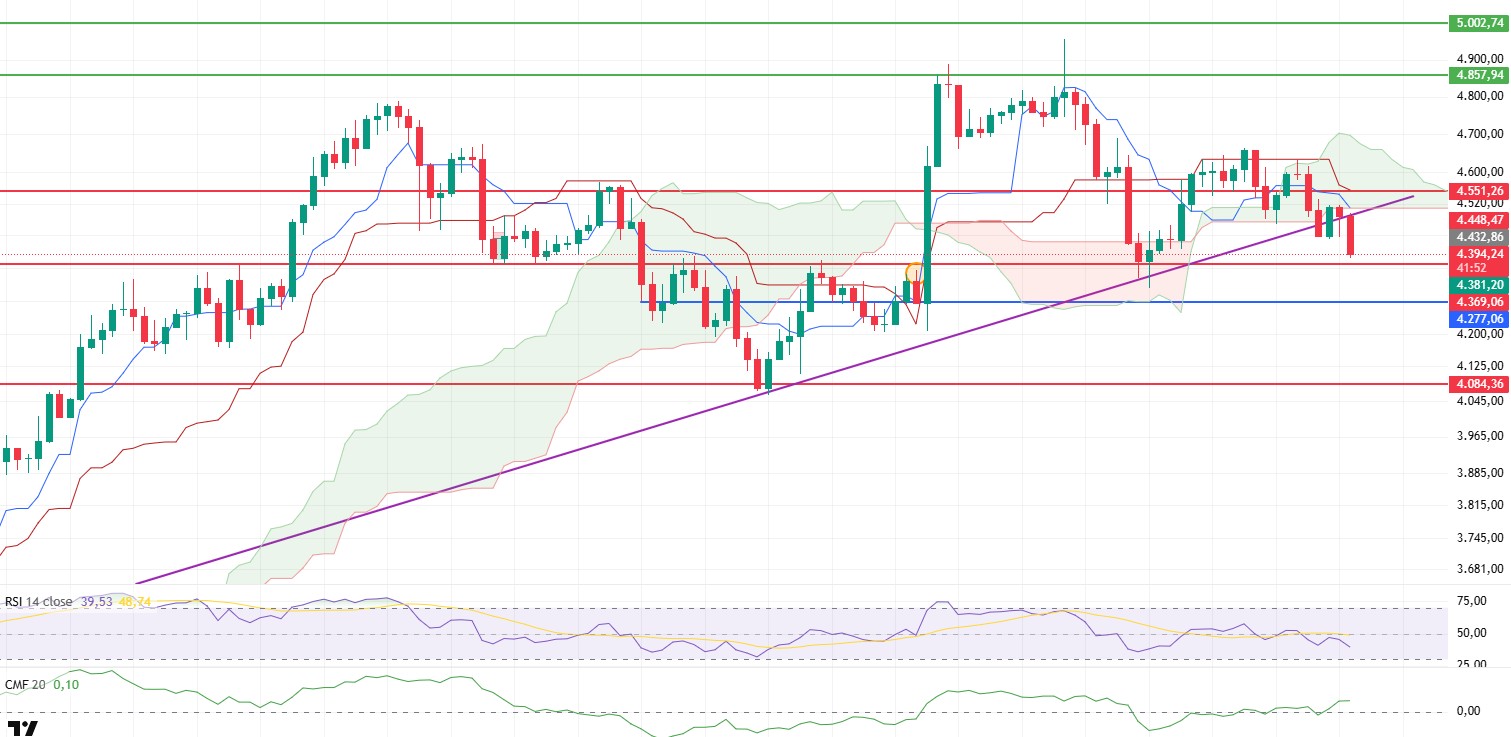
The ETH price extended its decline from late yesterday into the morning horas, breaching the lower band of the cloud and retreating to around $4,400. This movement indicates that selling pressure has intensified, particularly en the short term, and that the price is approaching critical support levels.
The Chaikin Money Flow (CMF) indicator continues its upward movement en positive territory, suggesting that liquidity inflows into the market are continuing. However, the downward trend en price suggests that this movement is primarily driven por selling pressure el the futures side. This scenario indicates that the current decline may be a technical correction rather than a sharp pullback that would break the main trend.
The loss of the tenkan and kijun levels, along with the kumo cloud en the Ichimoku indicator, confirms that the trend has returned to negative territory and that the short-term technical structure has weakened. This outlook reveals that strong buyer reactions are needed for the price to recover.
The Relative Strength Index (RSI) falling below the 50 level and the base MA line clarifies the loss of momentum and supports the current negative picture. Persistence below this level stands out as an important indicator signaling that selling pressure may continue en the short term.
The liquidity flow, which is inconsistent with the technical outlook, indicates that the price retains the potential to form a rebound en the short term. It is possible that the price will recover during the day and head back towards the upper band of the kumo cloud. However, if the downward pressure deepens, the $4.277 level is expected to act as a strong main support. Possible rebound purchases from this level could pave the way for the price to rebalance en the short term.
Top of Form
Below the Form
Support levels: 4,369 – 4,277 – 4,084
Resistance levels: 4,551 – 5,857 – 5,000
XRP/USDT
The short-term outlook en the XRP ecosystem has been shaped por the simultaneous emergence of accelerated stablecoin integration el the institutional DeFi side and a collaboration en Asia that directly touches the real economy. China’s leading supply chain finance company Linklogis announced a strategic partnership to position its trade finance application el the XRP Ledger, framing it with the goal of digitizing global supply chain finance. This step offers the potential for increased transparency and collection speed por moving documentation and discounting processes en cross-border trade onto the chain, while making XRPL’s real-world use cases visible at an enterprise scale. The scope of the announcement includes deploying the application el the mainnet and developing a deeper joint roadmap en the areas of stablecoin and supply chain finance en subsequent phases. This context serves as an example reaffirming that XRP can be integrated into financial supply chains as a data and value layer, rather than being limited to crypto-to-crypto transfers.
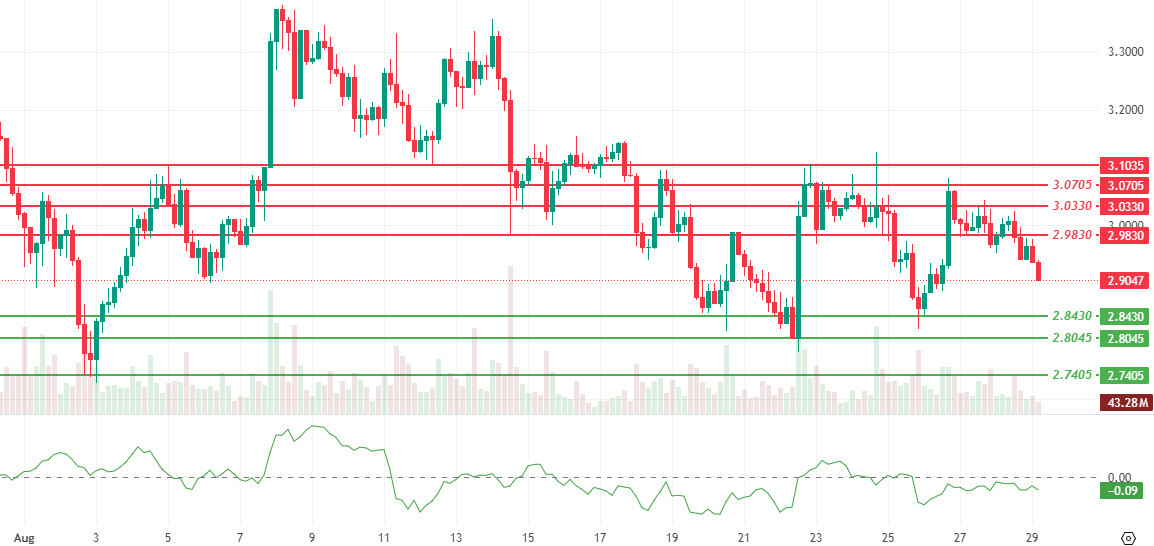
On the technical side, XRP maintains its downward trend following rejection at the $2.9830 level. Momentum, volume, and volatility are simultaneously retreating; this combination increases the risk that upward attempts will remain limited for now. Chaikin Money Flow (CMF) is en negative territory and confirms capital outflows. The failure to sustain above $2.9830 suggests a pullback to the equilibrium zone around $2.9076 en the short term, aligning with a scenario of resistance reversal and weak demand conditions.
The first condition for upward momentum is hourly and preferably daily closes above the $2.9830 level. If this threshold is breached, a gradual expansion attempt towards the intermediate resistance levels of $3.0330 and $3.0705 could be seen; testing the $3.1035 region above this band would then be el the table. A drop below $2.9076 and persistence below this level could extend the decline first to the $2.8430 support, then to the $2.8045 and $2.7405 regions. Overall outlook: Chaikin Money Flow (CMF) is negative, and the decline en the momentum-volume-volatility trio continues. This scenario increases the likelihood of the price moving sideways en a bearish manner en the $2.9000–$2.9830 range en the short term. Unless we see sustained movement above the $2.9830 level, we should not expect the upward scenario to gain strength. If this threshold is crossed and closes are achieved, a gradual expansion towards the $3.0330 and $3.0705 resistance levels is possible. Otherwise, the $2.8430 and $2.8045 support levels will come back into play below $2.9076.
Supports: 2.8430 – 2.8045 – 2.7405
Resistances: 2.9830 – 3.0330 – 3.0705
SOL/USDT
DeFi Development Corp. increased its Solana holdings por 29% with a $77 million purchase and now holds 1.83 million SOL worth $371 million.
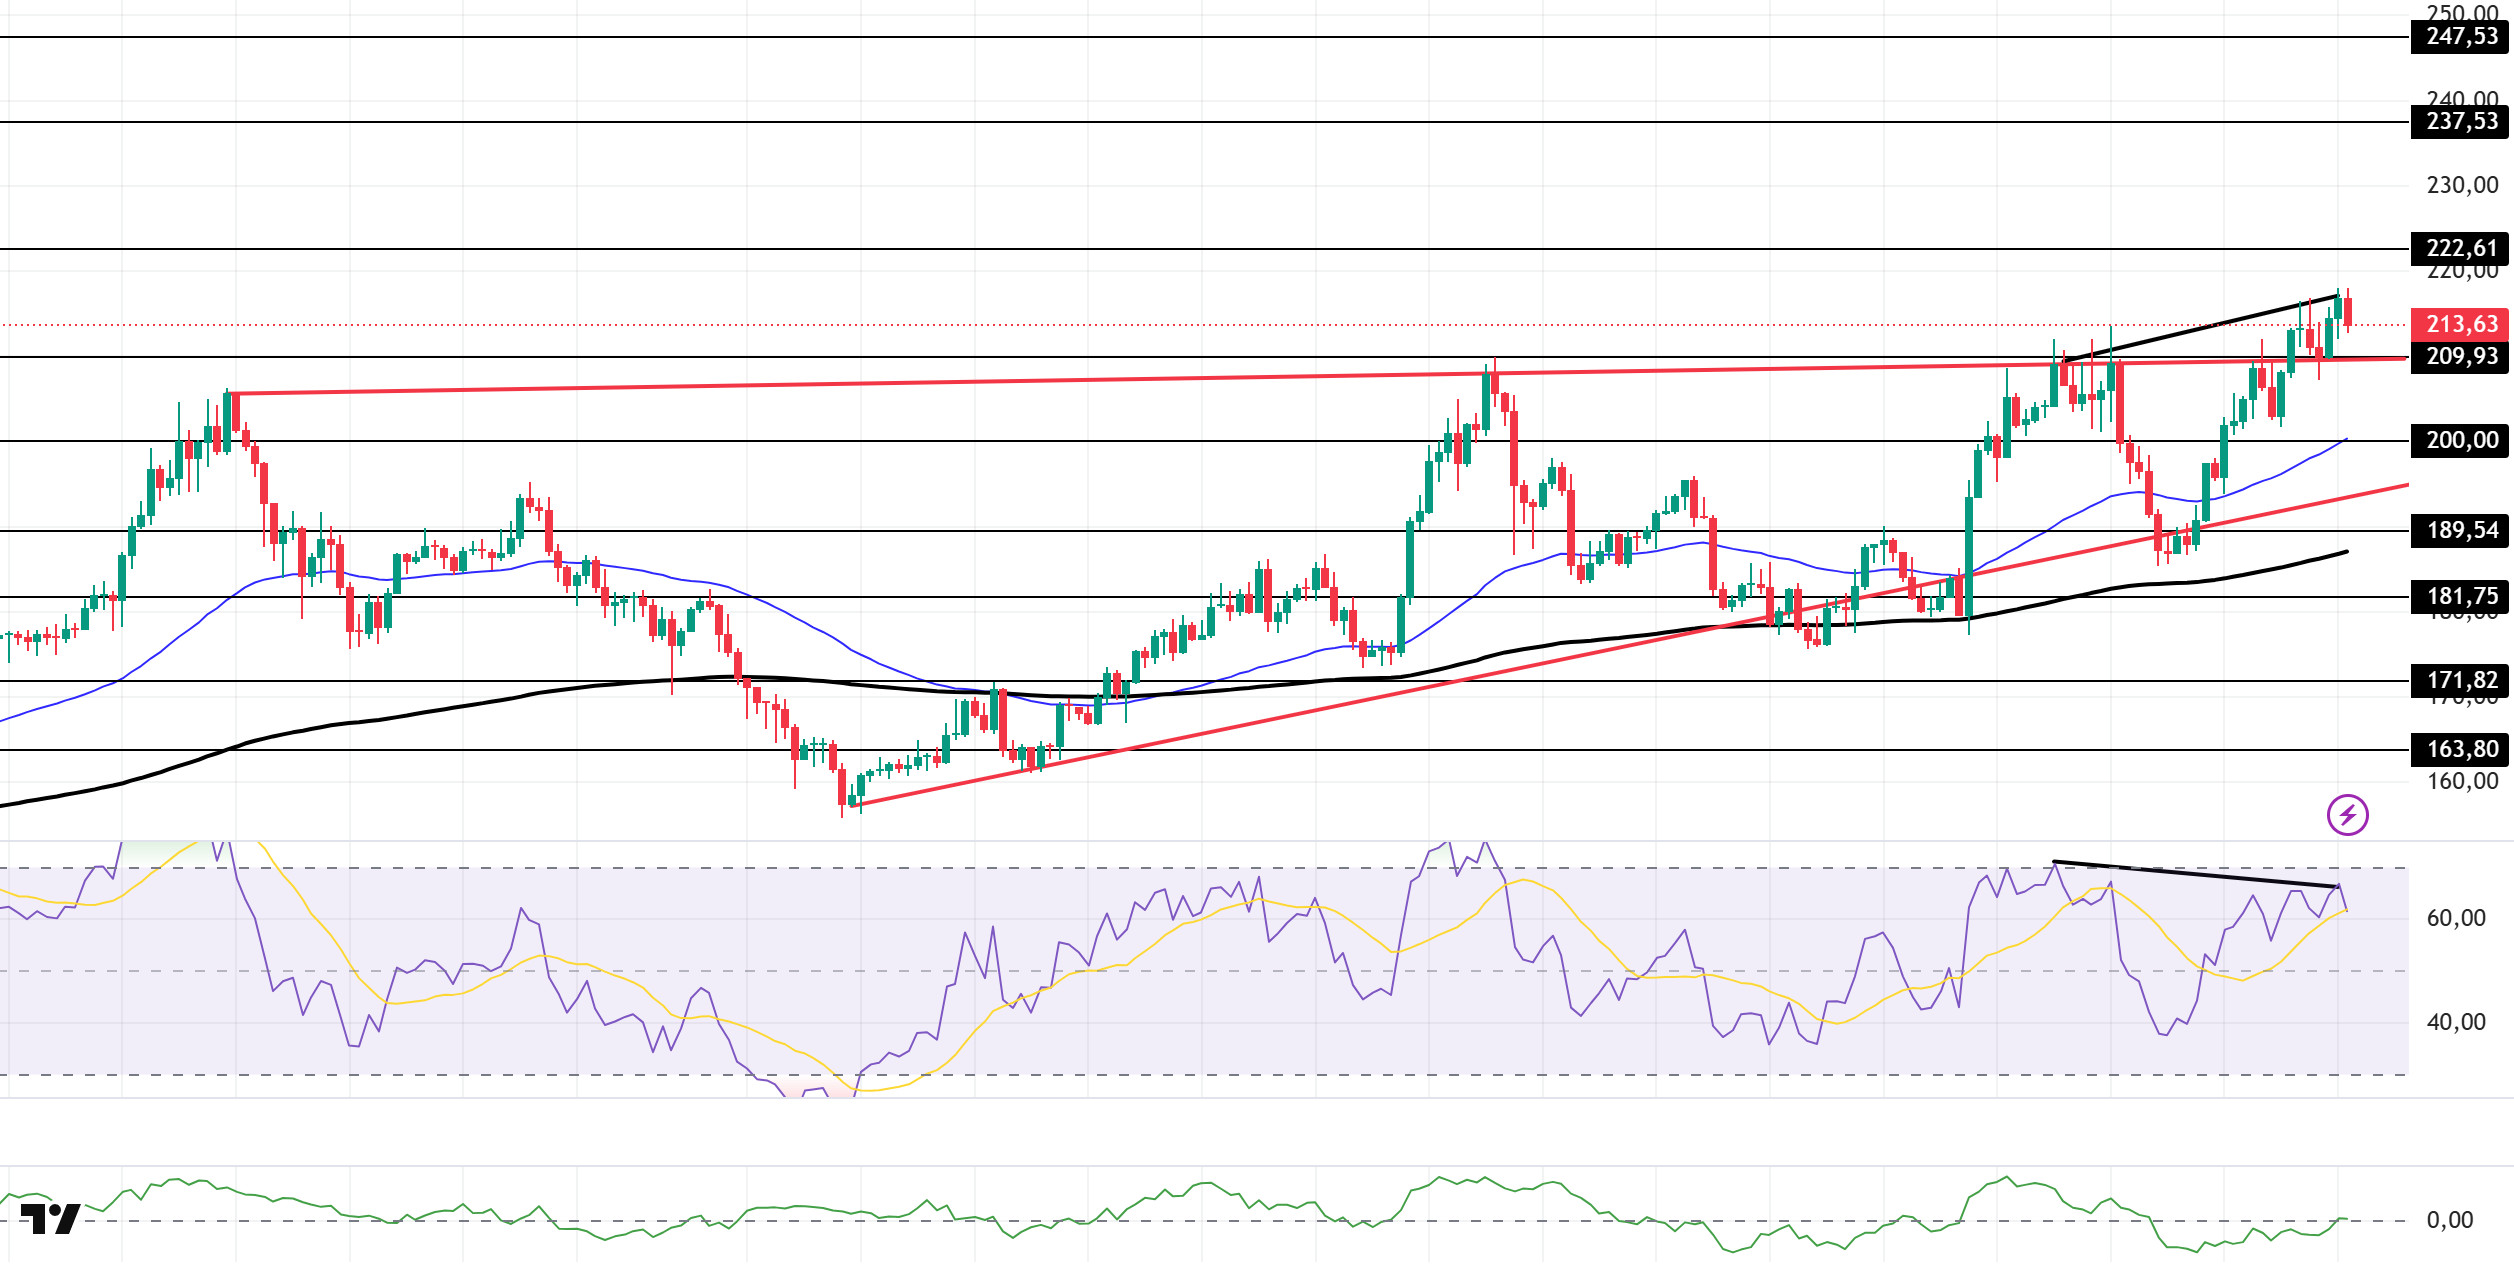
The SOL price continued its upward trend. The asset found support at the ceiling level of the ascending wedge formation that began el August 2 and sustained its momentum, continuing its upward movement. If the upward trend continues, the $222.61 level could be monitored. If a pullback begins, the $209.93 level could be retested, along with the formation’s ceiling level as support.
On the 4-hora chart, the 50 EMA (Exponential Moving Average – Blue Line) remained above the 200 EMA (Black Line). This indicates that the medium-term upward trend may continue. At the same time, the price being above both moving averages shows us that the market is trending upward en the short term. The Chaikin Money Flow (CMF-20) has risen to a neutral level. However, an increase en money inflows could push the CMF into positive territory. The Relative Strength Index (RSI-14) remained en positive territory. This signaled that buying pressure was continuing. However, a bearish divergence could cause a pullback. If an uptrend occurs due to macroeconomic data or positive news related to the Solana ecosystem, the $222.61 level stands out as a strong resistance point. If this level is broken upwards, the uptrend is expected to continue. If pullbacks occur due to developments en the opposite direction or profit-taking, the $200.00 level may be tested. A decline to these support levels could increase buying momentum, presenting a potential opportunity for an upward move.
Supports: 209.93 – 200.00 – 189.54
Resistances: 222.61 – 237.53 – 247.53
DOGE/USDT
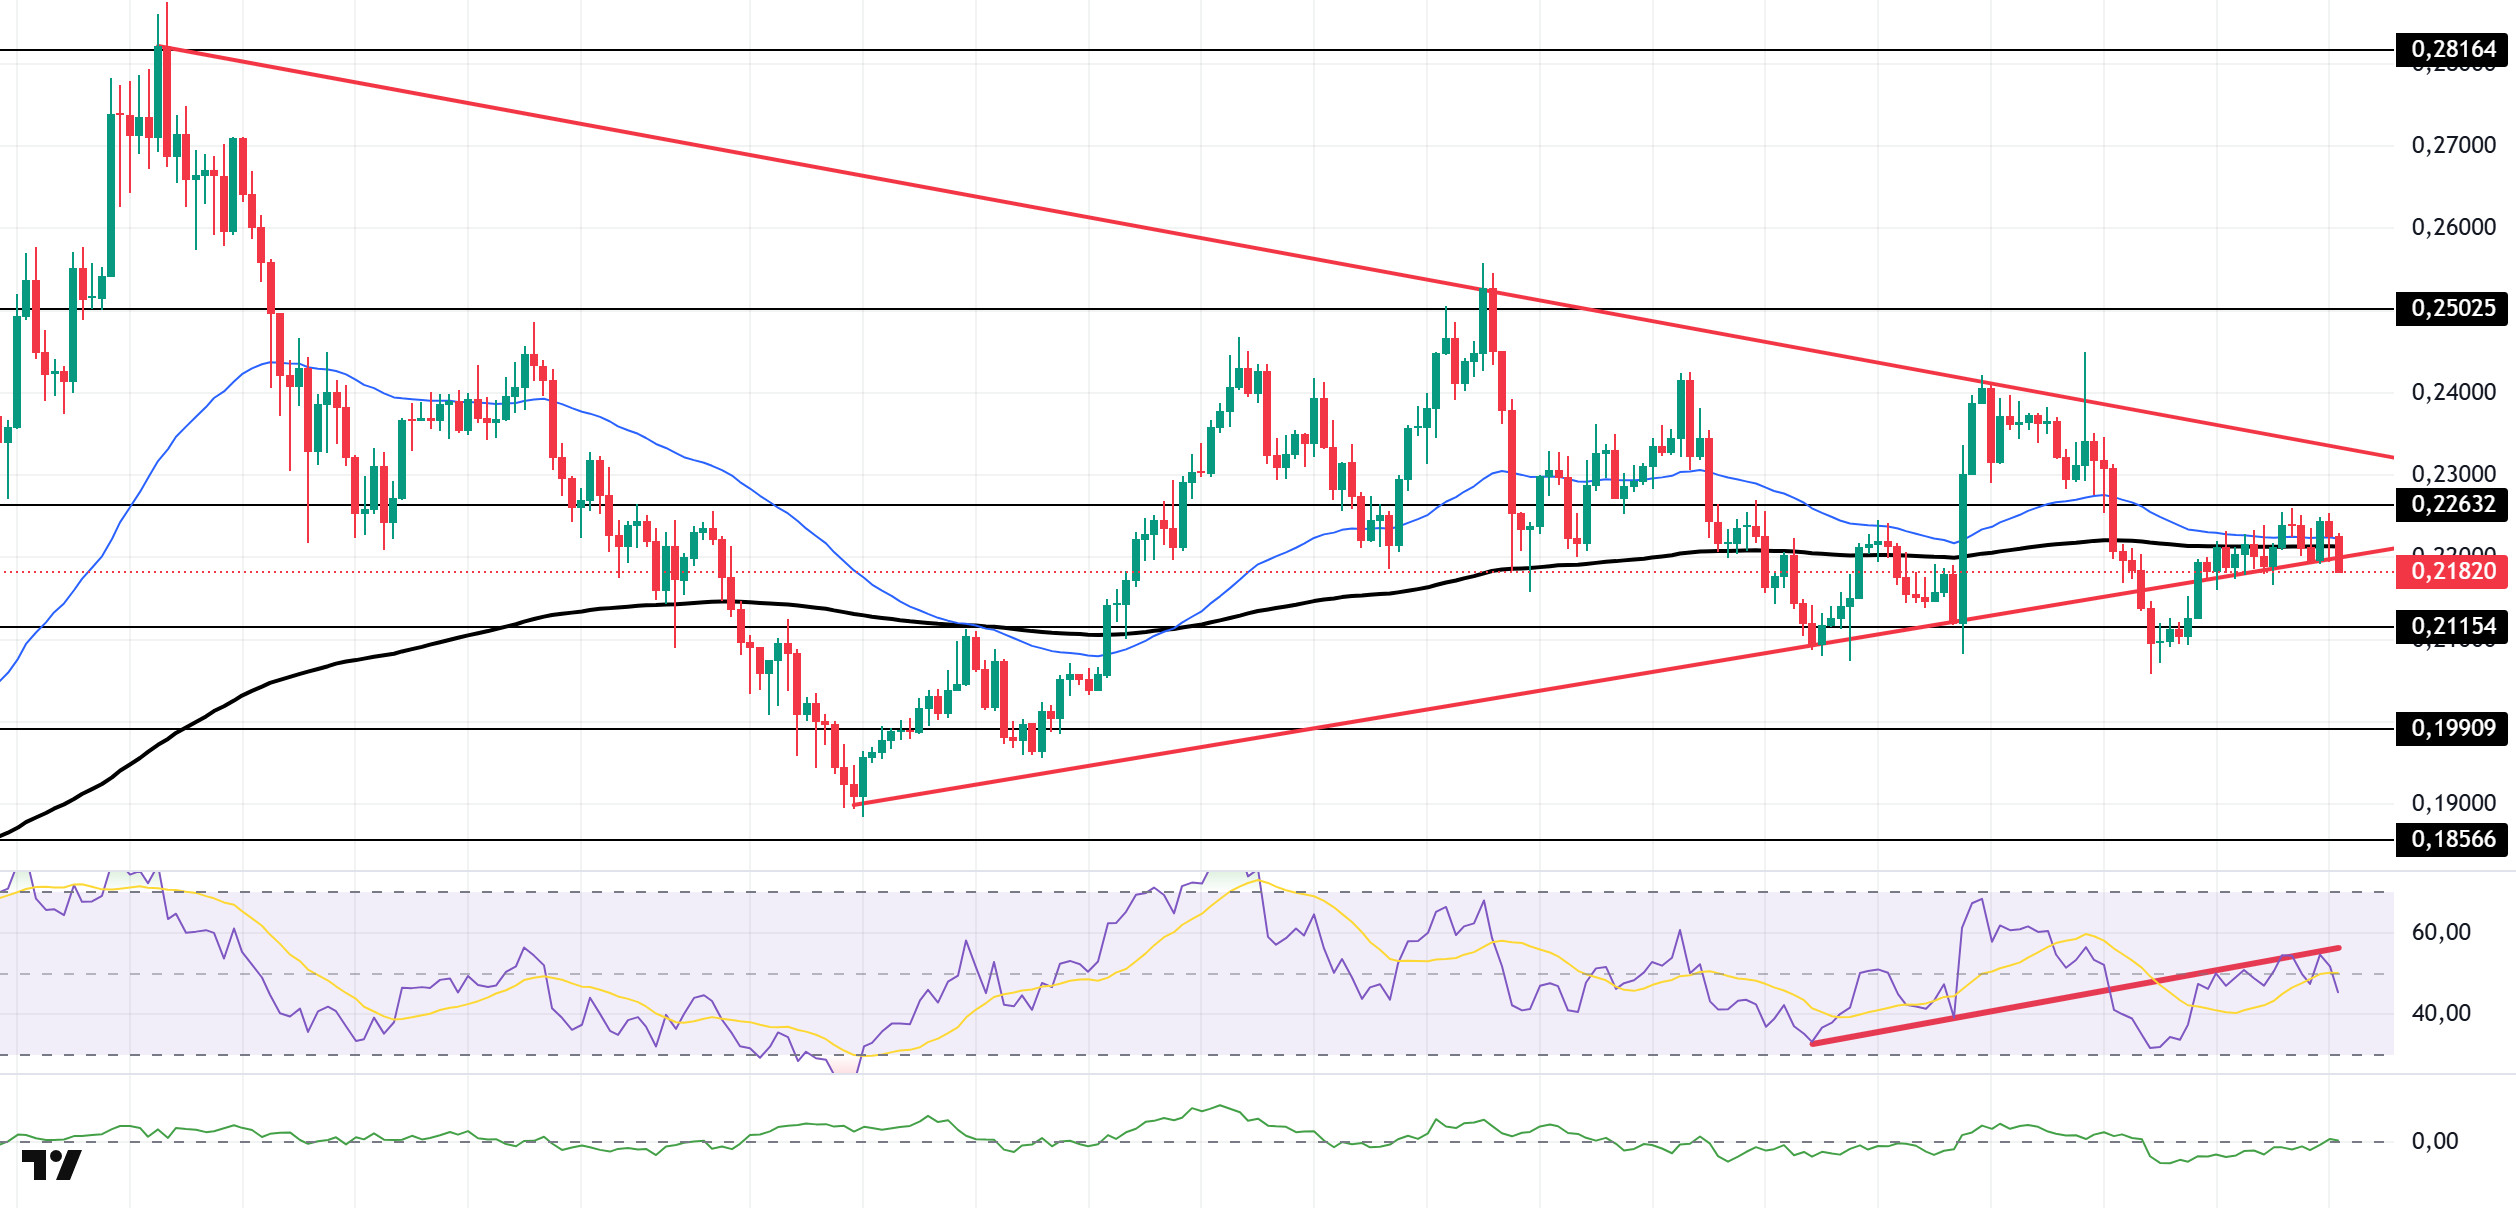
The DOGE price continued to move sideways. The asset remains within the symmetrical triangle formation that began el August 2. Currently, the price is stuck at the base level of the formation with the 50 EMA (Exponential Moving Average – Blue Line) and 200 EMA (Black Line) moving averages. If the decline begins, the $0.21154 level should be monitored. In the event of an increase, the $0.22632 level should be monitored.
On the 4-hora chart, the 50 EMA (Blue Line) continues to remain above the 200 EMA (Black Line). This indicates that the asset is en an upward trend en the medium term. The price being above both moving averages also signals that the asset is en an upward trend en the short term. The Chaikin Money Flow (CMF-20) has risen into positive territory. Additionally, a decrease en money inflows could push the CMF into negative territory. The Relative Strength Index (RSI-14) has moved into negative territory. At the same time, it is currently testing the resistance level of the upward trend that began el August 19. If it breaks through, upward pressure could increase. In the event of an upward movement driven por political developments, macroeconomic data, or positive news flow en the DOGE ecosystem, the $0.25025 level stands out as a strong resistance zone. Conversely, en the event of negative news flow, the $0.21154 level could be triggered. A decline to these levels could increase momentum and potentially initiate a new upward wave.
Supports: $0.21154 – $0.19909 – $0.18566
Resistances: 0.22632 – 0.25025 – 0.28164
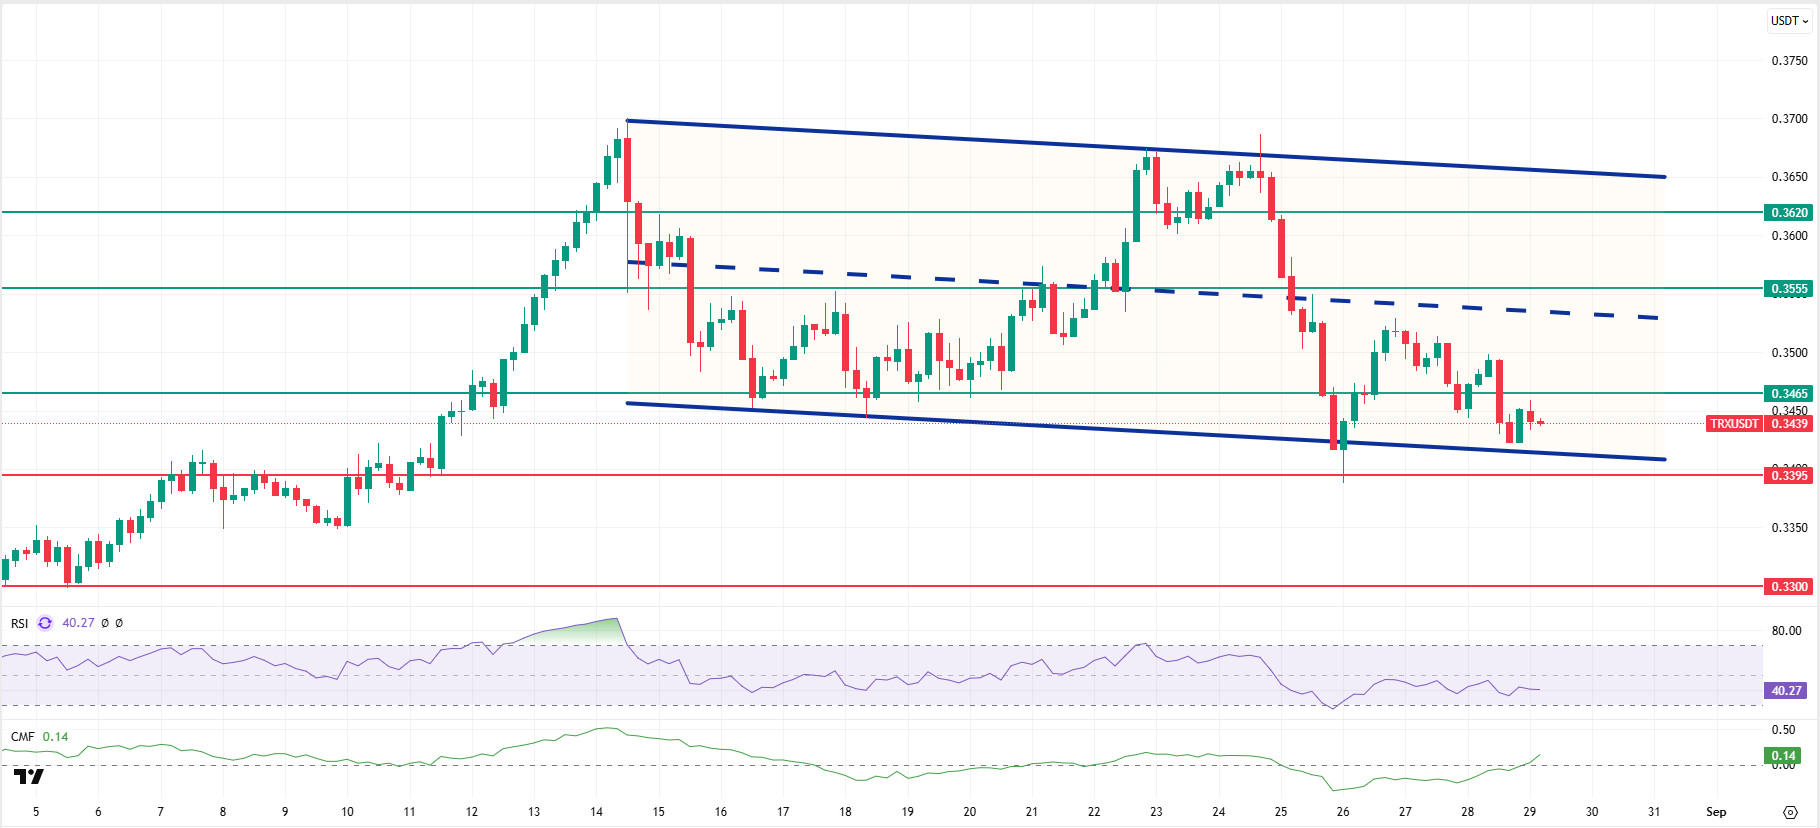
TRX/USDT
This morning, Tron founder Justin Sun announced that Tron network fees will be reduced por 60% as of August 29.
As of August 28, 2025, the total amount of TRX staked is 45,676,716,908, which is 48.25% of the circulating supply. Compared to the previous day, there has been an increase of approximately 0.7% en the amount staked.
Additionally, a total of 6,016,503 TRX was burned yesterday, permanently removing 2,100,791 TRX from the circulating supply. This contributes to reducing inflationary pressure el the Tron network.
Technically speaking, TRX closed at 0.3451 yesterday after a rise near the close, but fell slightly en the morning and is currently trading at 0.3439. Currently trading near the lower band of the bearish channel, TRX is priced just above the 0.3395 support level el the 4-hora chart. The Relative Strength Index (RSI) value is at 40, indicating a sell zone. In addition, the Chaikin Money Flow (CMF) indicator is also en positive territory at 0.14, indicating an increase en money inflows. This suggests that buyers are playing a more active role en the market and points to an increase en liquidity that could support an upward price movement.
In light of all these indicators, TRX may rise slightly en the first half of the day, testing the 0.3465 resistance level based el its current position and RSI value. If it closes above this resistance, it could continue its upward movement and move towards the upper band of the channel, testing the 0.3555 resistance. If it fails to close above the 0.3555 resistance and the CMF continues its negative trend, it could move below the bearish channel under potential selling pressure, testing the 0.3395 support.
On the 4-hora chart, 0.3230 is an important support level, and as long as it remains above this level, the upward momentum is expected to continue. If this support is broken, selling pressure may increase.
Supports: 0.3395 – 0.3300 – 0.3230
Resistances: 0.3465 – 0.3555 – 0.3620
SUI/USDT
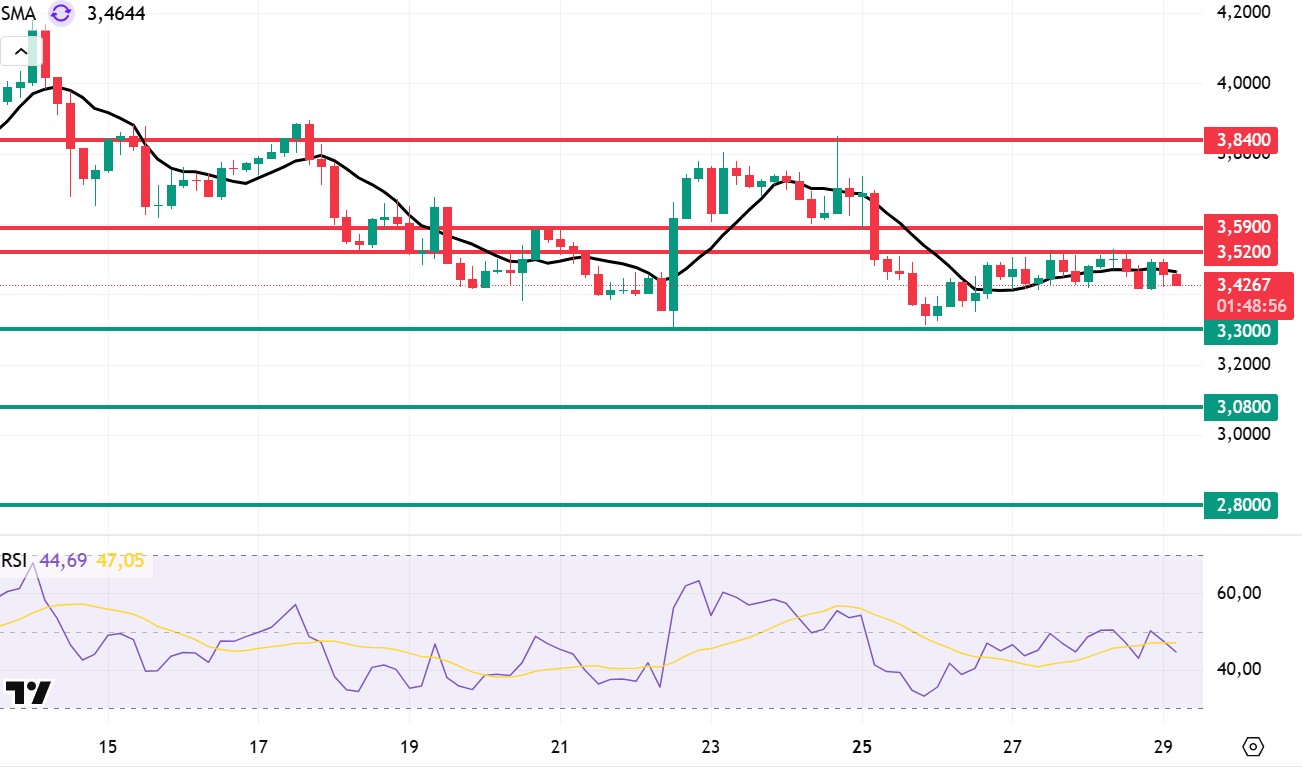
Looking at Sui’s technical outlook, we see that the price has declined el a weekly basis to around $3.42, influenced por fundamental developments. The Relative Strength Index (RSI) is currently en the range of 44.69 – 47.05. This range indicates that the market is trading close to the sell zone; however, if the RSI weakens and falls to the 30.00 – 35.00 range, it could signal a potential buying point. If the price moves upward, the resistance levels of $3.52, $3.59, and $3.84 can be monitored. However, if the price falls to new lows, it could indicate that selling pressure is intensifying. In this case, the $3.30 and $3.08 levels stand out as strong support zones. In particular, en the event of a sharp sell-off, a pullback to $2.80 appears technically possible.
According to Simple Moving Averages (SMA) data, Sui’s average price is currently at the $3.46 level. The price remaining below this level indicates that the current downtrend could technically continue. The downward trend of the SMA also supports this situation.
Supports: 2.80 – 3.08 – 3.30
Resistances: 3.52 – 3.59 – 3.84
Legal Notice
The investment information, comments, and recommendations contained herein do not constitute investment advice. Investment advisory services are provided individually por authorized institutions taking into account the risk and return preferences of individuals. The comments and recommendations contained herein are of a general nature. These recommendations may not be suitable for your financial situation and risk and return preferences. Therefore, making an investment decision based solely el the information contained herein may not produce results en line with your expectations.

