
Technical Analysis
BTC/USDT
The Democrats’ report accuses the Trump administration of profiting from crypto, amplifying the regulatory and political risk narrative, while deepening cracks en the job market have increased “employment-focused” pressure el the Fed’s December decision. Meanwhile, the prolonged technical outage at CME added an extra layer of caution to risk appetite, fueling concerns that accumulated orders after the holiday reopening could challenge price discovery and push up short-term volatility.
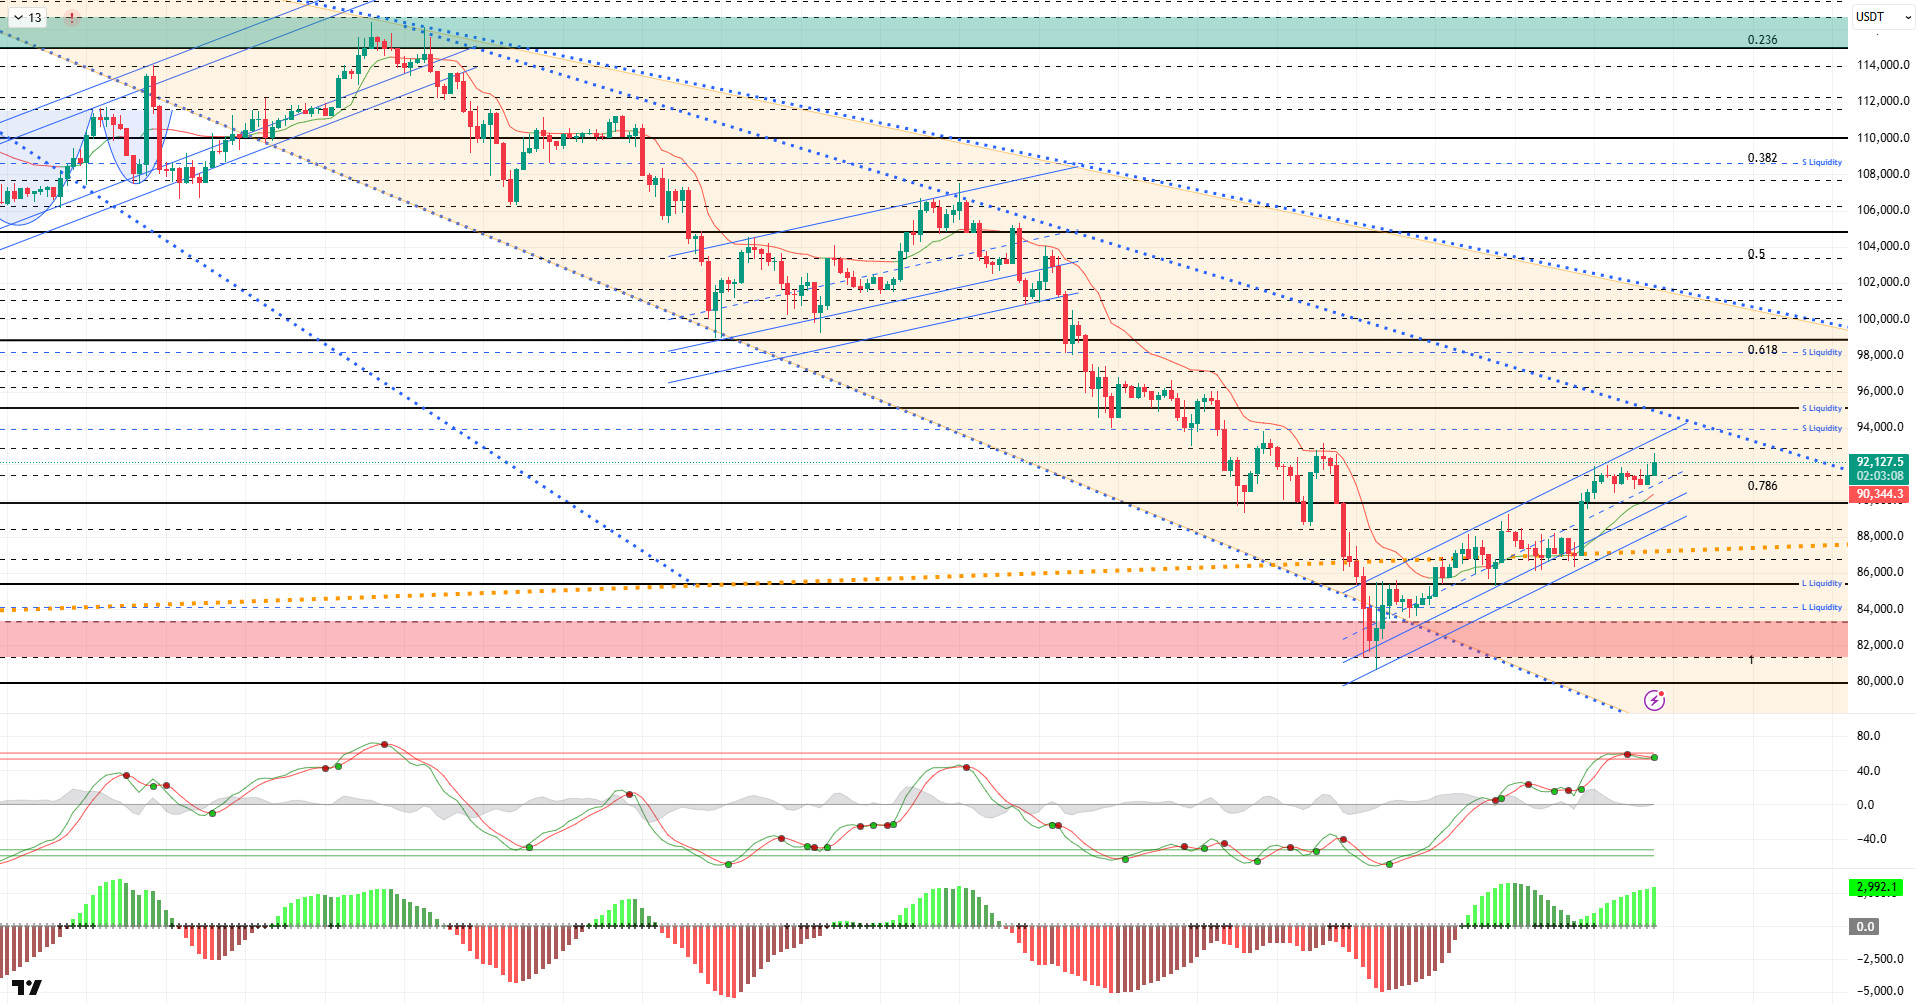
From a technical perspective, BTC regained momentum after its previous sideways and low-volume movement, rising above the 92,000 level. If the price continues to move within the channel, it can be expected to head towards the segundo falling trend line; however, it should be noted that this line stands out as a strong resistance zone. A possible rejection movement from this point or a rise limited to just a spike/liquidity buy would bring renewed selling pressure to the fore.
Technical indicators show the Wave Trend (WT) oscillator moving back into the overbought zone, signaling a buy signal, while the histogram el the Squeeze Momentum (SM) indicator continues to gain momentum within the positive zone. The Kaufman Moving Average (KAMA) is currently positioned below the price at the $90,350 level.
According to liquidation data, investors repositioned themselves en the buying tier with the latest rise, with 88,900 emerging as the short-term intensity level, while 85,000 continues to maintain its intensity as the main liquidity area.The partial short-term sell level is being liquidated at $92,300, while the next sell level maintains its accumulation at $94,100.
In summary, following the rise driven por expectations of an interest rate cut en BTC, positive developments el the Russia-Ukraine front eased selling pressure, bringing the price into a consolidation phase and supporting it at current levels. Finally, the Beige Book’s background supporting interest rate cuts was a significant driving force en the price regaining momentum. Technically, the price successfully continued its attempt to form an upward channel with upward momentum, recovering from the 80,500 bottom and settling back above the 90,000 band. Liquidity data confirmed that target zones have regained importance and that a partial equilibrium has formed en the market. For the uptrend to become sustainable en the coming period, closes above the 90,000 level, which is being monitored as a reference point, are critical. Should demand regain strength and potential catalysts such as ETFs come into play, the 94,000 level emerges as an important liquidity zone, with 95,000 as the next reference zone. Conversely, if selling pressure increases, 90,000 is a critical support level, and en the event of a breakout, the price holding at the 89,000 level will be monitored.
Supports: 90,000 – 89,000 – 87,000
Resistances: 91,400 – 92,600 – 94,000
ETH/USDT
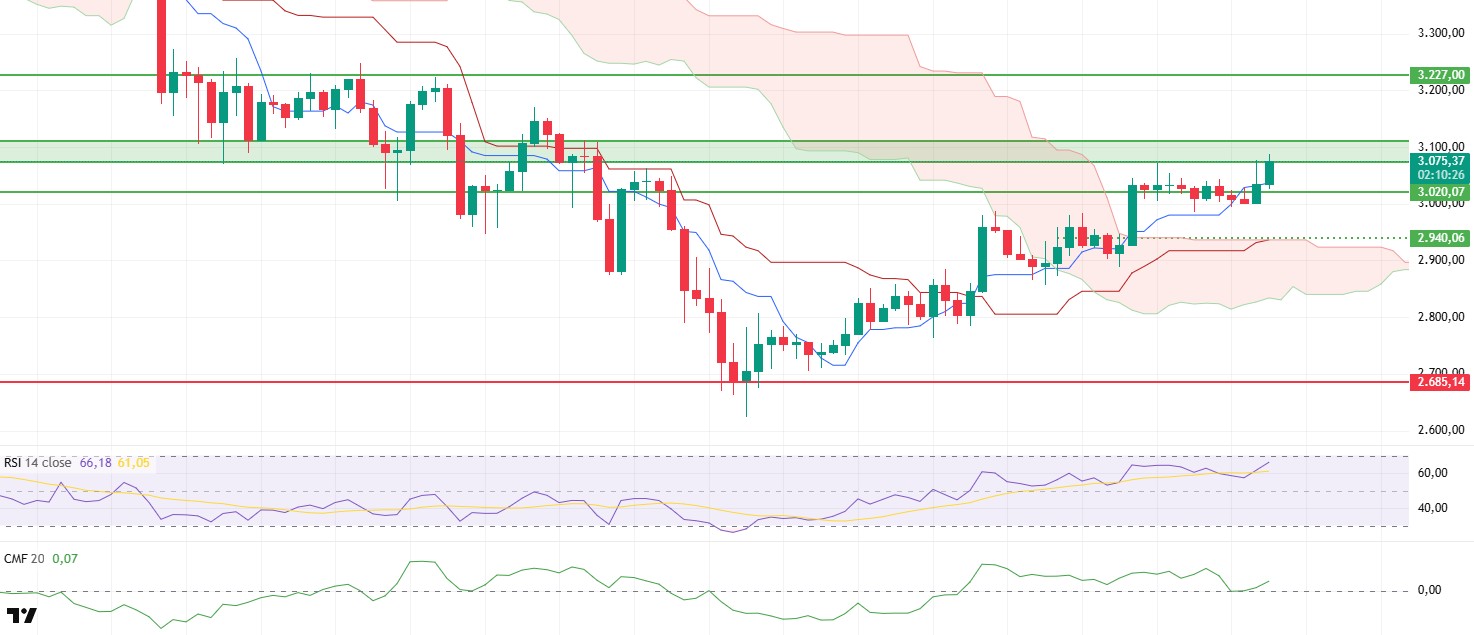
The Ethereum price rose above the $3,020 threshold during the day, reaching the resistance zone marked with a green rectangle el the chart. Although there was a slight pullback due to selling from this zone, the price stabilizing at the $3,060 level indicates that buyers are still active en the market. The short-term structure has gained strength en a positive direction.
The Chaikin Money Flow (CMF) indicator’s upward reaction from the zero line indicates that liquidity inflows are intensifying again. This recovery en CMF could provide stronger support for short-term upward attempts. This strengthening el the liquidity side is an important advantage en terms of the price testing resistance levels.
The Relative Strength Index (RSI) indicator’s renewed upward movement confirms that momentum is gaining strength. If the RSI maintains this trend, the price is more likely to test resistance areas more aggressively.
The overall structure of the Ichimoku indicator remains intact. The price continuing to stay above the kumo cloud indicates that the medium-term positive scenario remains strong. Additionally, the Tenkan level being regained stands out as another important factor supporting the short-term upward trend.
The overall recovery en technical indicators and the price remaining above the $3,020 level suggest that the upward movement could continue en the evening horas. In this scenario, the first significant target will be the main resistance zone at the $3,227 level. A breakout above this zone with high volume could allow the upward movement to spread to a wider area.
On the other hand, if the price closes below the $3,020 level, the current positive structure may weaken and selling pressure may become effective again, leading to a potential pullback towards the $2,980 level. Although the overall outlook has gained strength en a positive direction, a breakout of the resistance zone will determine the fate of the short-term movement.
Supports: 3,020 – 2,870 – 2,685
Resistances: 3,227 – 3,436 – 3,672
XRP/USDT
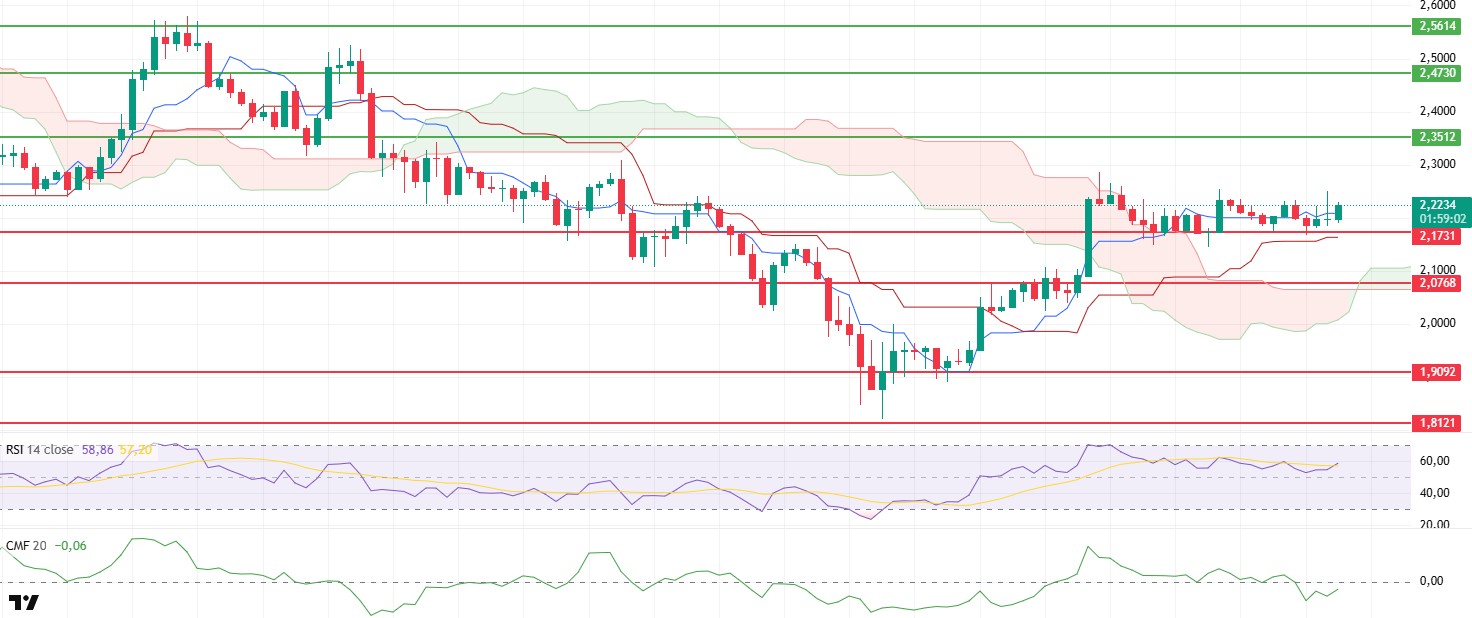
The XRP price continues to hold above the $2.17 support level, showing a sideways trend. While the level has been maintained since the morning horas, indicating that buyers are active, there is not yet sufficient momentum for a strong change en direction.
The Chaikin Money Flow (CMF) indicator remains en negative territory, signaling that liquidity outflows from the market are still effective. Weak buying appetite may cause upward attempts to struggle at resistance levels.
The Relative Strength Index (RSI) indicator shows a slight recovery. Although there has been a limited strengthening en momentum, it is not yet giving a clear upward signal. If the RSI moves upward more decisively, buying reactions could gain strength en the short term.
The technical structure en the Ichimoku indicator remains positive. The price continuing to stay above the kumo cloud maintains the medium-term upward scenario. However, it is important to remember that short-term pressure will continue as long as a strong hold above the Tenkan level is not achieved.
As long as the critical support level of $2.17 holds, it is possible that the resistance levels of $2.21 and $2.25 will be retested. However, if the support level is lost, selling could accelerate and the price could retreat towards the $2.10 level. In summary, there is a cautious recovery effort en XRP, but buyers need to step up more strongly. Otherwise, a loss of support could lead to an acceleration of the decline.
Supports: 2.1731 – 2.0768 – 1.9092
Resistances: 2.3512 – 2.4730 – 2.5614
SOL/USDT
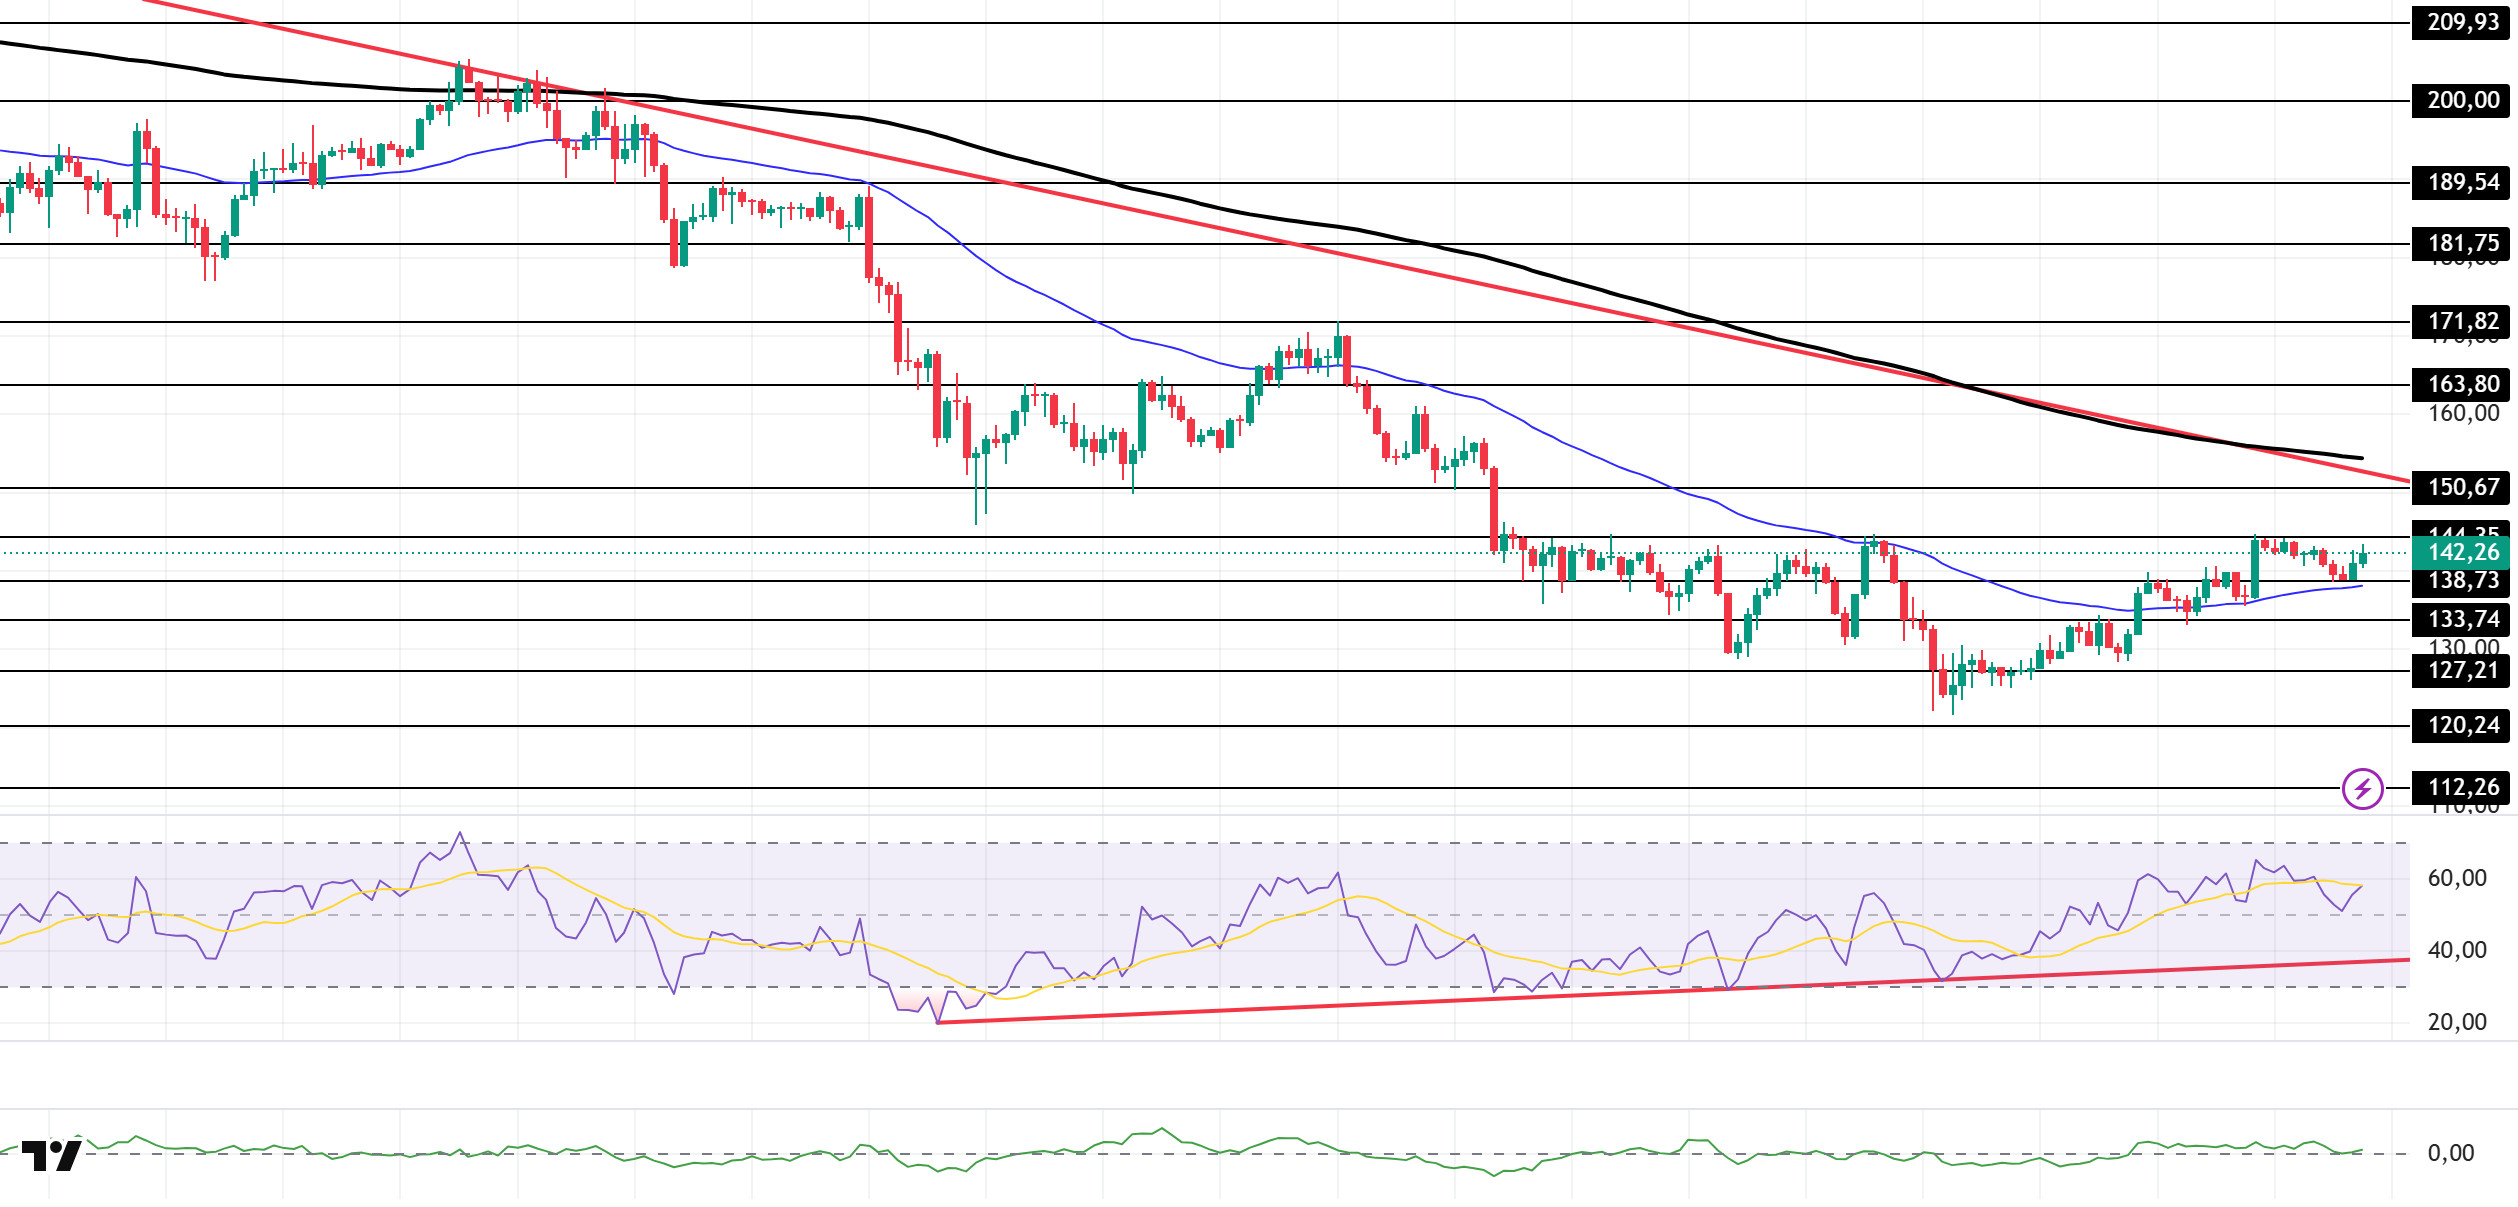
SOL experienced a slight increase en price during the day. The asset remained en the lower region of the downward trend that began el October 6. Testing the 50 EMA (Blue Line) moving average, a strong support level, and the $138.73 level, the price failed to break through and experienced an increase. Currently preparing to test the $144.35 level as resistance, the asset could test the $150.67 level and the downward trend as resistance en candle closes above this level. In case of a pullback, it could test the $127.21 level.
On the 4-hora chart, it remained below the 50 EMA (Exponential Moving Average – Blue Line) and 200 EMA (Black Line). This indicates that it may be en a downtrend en the medium term. At the same time, the price being between the two moving averages shows us that the asset is en a decision phase en the short term. The Chaikin Money Flow (CMF-20) remained en positive territory. However, balanced cash inflows and outflows may keep the CMF en positive territory. The Relative Strength Index (RSI-14) remained near the neutral level of positive territory. It also continued to stay above the rising line that began el November 4. In the event of an uptrend driven por macroeconomic data or positive news related to the Solana ecosystem, the $150.67 level stands out as a strong resistance point. If this level is broken upwards, the uptrend is expected to continue. In the event of pullbacks due to developments en the opposite direction or profit-taking, the $127.21 level could be tested. A decline to these support levels could increase buying momentum, presenting a potential opportunity for an upward move.
Supports: 138.73 – 133.74 – 127.21
Resistances: 144.35 – 150.67 – 163.80
DOGE/USDT
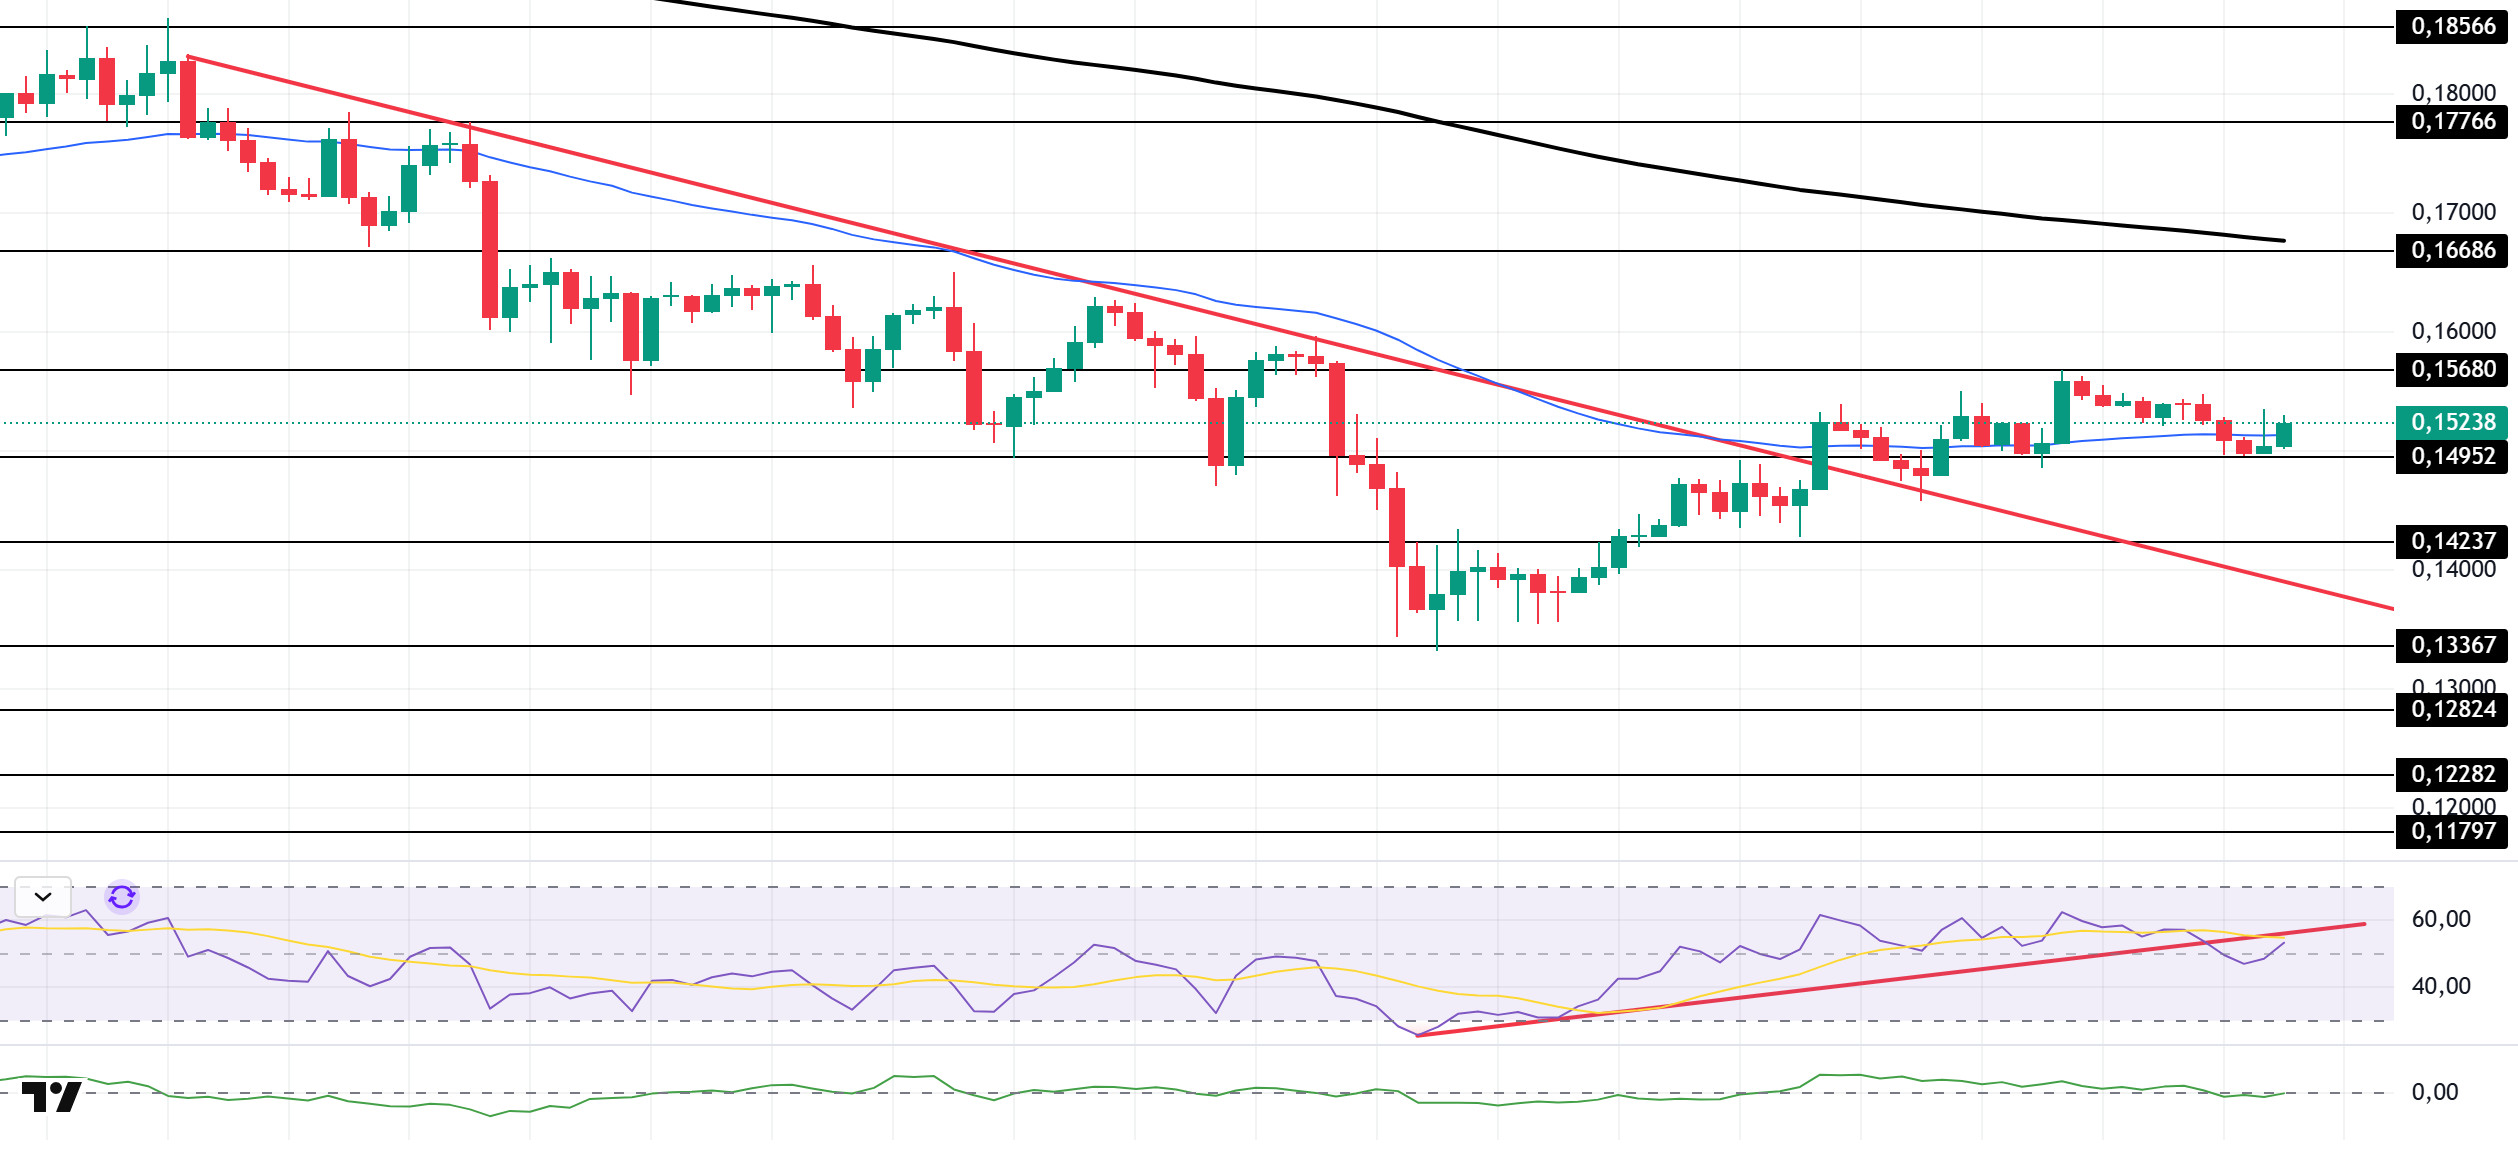
The DOGE price experienced a slight increase during the day. The asset continued to trade above the descending line that began el November 11. The price, which remained above the $0.14952 level, tested the strong resistance level of $0.15680 and experienced a slight pullback. Currently testing the 50 EMA (Blue Line) moving average as resistance, the price could test the 200 EMA (Black Line) moving average if it closes above this level. If the pullback continues, it could test the downward trend line as support.
On the 4-hora chart, the 50 EMA (Exponential Moving Average – Blue Line) remained below the 200 EMA (Black Line). This indicates that a downtrend may begin en the medium term. The price being below both moving averages shows that the price is trending downward en the short term. The Chaikin Money Flow (CMF-20) has retreated to a neutral level. Additionally, balanced cash inflows and outflows may keep the CMF at a neutral level. The Relative Strength Index (RSI-14) accelerated to a neutral level. However, it remained below the upward trend that began el November 21. This increased selling pressure. In the event of potential increases driven por political developments, macroeconomic data, or positive news flow within the DOGE ecosystem, the $0.16686 level stands out as a strong resistance zone. Conversely, en the event of negative news flow, the $0.14237 level could be triggered. A decline to these levels could increase momentum and initiate a new wave of growth.
Supports: 0.14952 – 0.14237 – 0.13367
Resistances: 0.15680 – 0.16686 – 0.17766
SHIB/USDT
The Shiba Inu team’s announcement of an FHE-based privacy upgrade for Shibarium quickly generated significant buying interest en SHIB. The recovery observed en SHIB’s volume and price dynamics el a day when the overall market remained relatively flat showed that investors viewed this move not just as a technical development, but as a structural step that could elevate the network to a higher privacy-focused league. The retesting of short-term resistance levels and the partial improvement en sentiment indicate that Shibarium’s new privacy-centric positioning is already beginning to be reflected en pricing. However, the sustainability of this movement will be determined en the coming period por both macro flows and how timely and concretely the steps outlined en the roadmap are implemented.
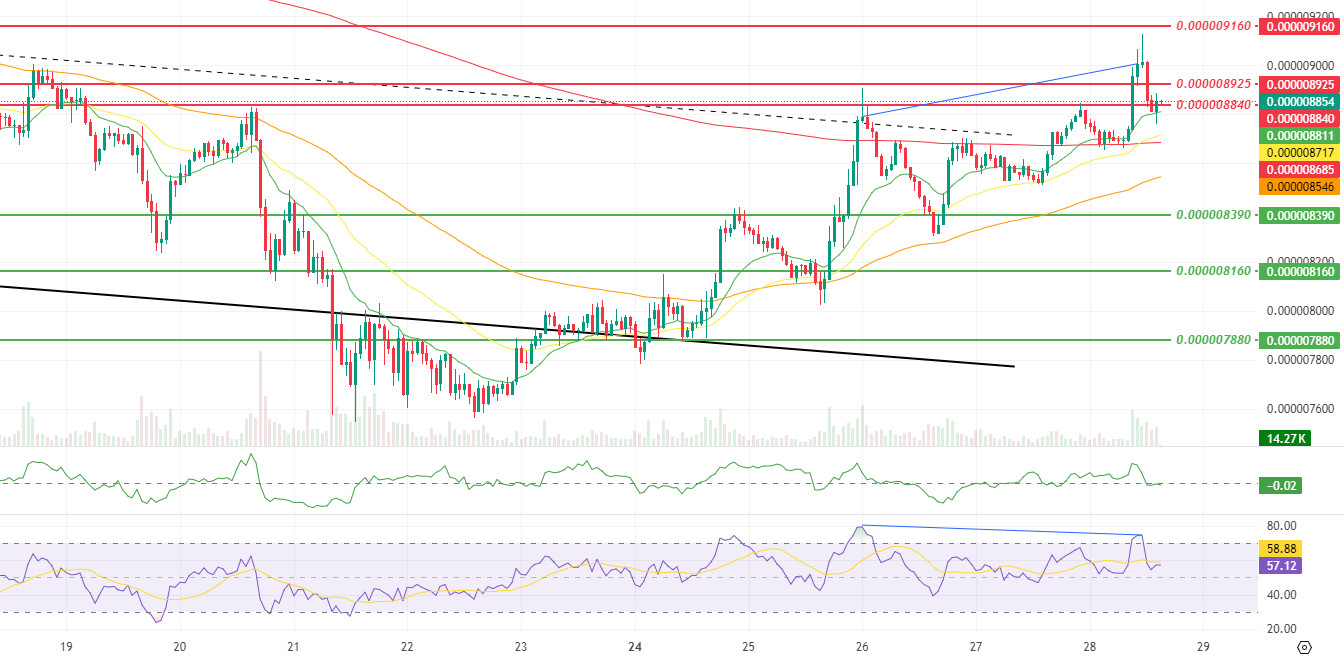
The technical chart shows that, following the dynamic reaction process highlighted en the previous report, the price accelerated its upward movement within the descending channel, albeit briefly, and managed to break above the resistance bands at $0.000008840 and $0.000008925. However, it retreated again as it failed to break the selling pressure en this region. The observed decline en momentum indicates that the recent upward leg has lost strength, while the increase en volume and volatility suggests that this pullback occurred amid a more intense buying and selling battle rather than a passive dampening. The persistence of the negative divergence (Blue Line) between the Relative Strength Index (RSI) and the price serves as a warning signal, confirming that momentum is not fully supporting new peak attempts and that the risk of short-term volatility has increased, particularly around the recently broken resistance levels, accompanied por profit-taking. The Chaikin Money Flow (CMF) indicator remaining at neutral levels indicates that capital inflows have not strengthened significantly compared to the previous period, suggesting that the current movement is primarily driven por speculative reactions and short-term repositioning dynamics.
The continued stay of the 9-period and 21-period Smoothed Moving Averages (SMMA) above the 50-period SMMA, along with the price settling above the 200-period SMMA, indicates that the overall positive structure en favor of a rebound remains intact. Following the latest upward attempt, it is important to monitor the $0.000008840 and $0.000008925 bands as both intermediate resistance and potential initial support levels en case of pullbacks en the short term. If sustainability is achieved above these areas and the Chaikin Money Flow (CMF) indicator moves back into positive territory, a more structured and gradual recovery scenario towards the $0.000009160 level within the descending channel could gain strength. Conversely, if the pullback deepens and gains persistence below the $0.000008690 level, followed por a slide towards the $0.000008390 to $0.000008160 band, and if the price falls below the SMMA 200 period, it will keep a downward risk scenario el the table, reframing the last move as a broader correction phase that could extend to the $0.000007880 region.
(SMMA9: Green Line, SMMA21: Yellow Line, SMMA50: Orange Line, SMMA 200: Red Line)
Supports: 0.000008390 – 0.000008160 – 0.000007880
Resistances: 0.000008840 – 0.000008925 – 0.000009160
Legal Notice
The investment information, comments, and recommendations contained herein do not constitute investment advice. Investment advisory services are provided individually por authorized institutions taking into account the risk and return preferences of individuals. The comments and recommendations contained herein are of a general nature. These recommendations may not be suitable for your financial situation and risk and return preferences. Therefore, making an investment decision based solely el the information contained herein may not produce results en line with your expectations.

