
BTC/USDT
Markets have begun pricing en Kevin Warsh’s nomination for Fed chair as a potential hawkish monetary policy shift. Warsh’s lack of a clear commitment to interest rate cuts and his approach prioritizing long-term trends have made the existing disagreements within the Fed more visible. With limited progress expected en quantitative tightening, only measured interest rate cuts are likely en the segundo half of the year. On the geopolitical front, controlled contacts between the US and Iran and increased diplomatic traffic en Russia-Ukraine talks indicate that global risk perception has not completely disappeared, but that signs of easing are strengthening.
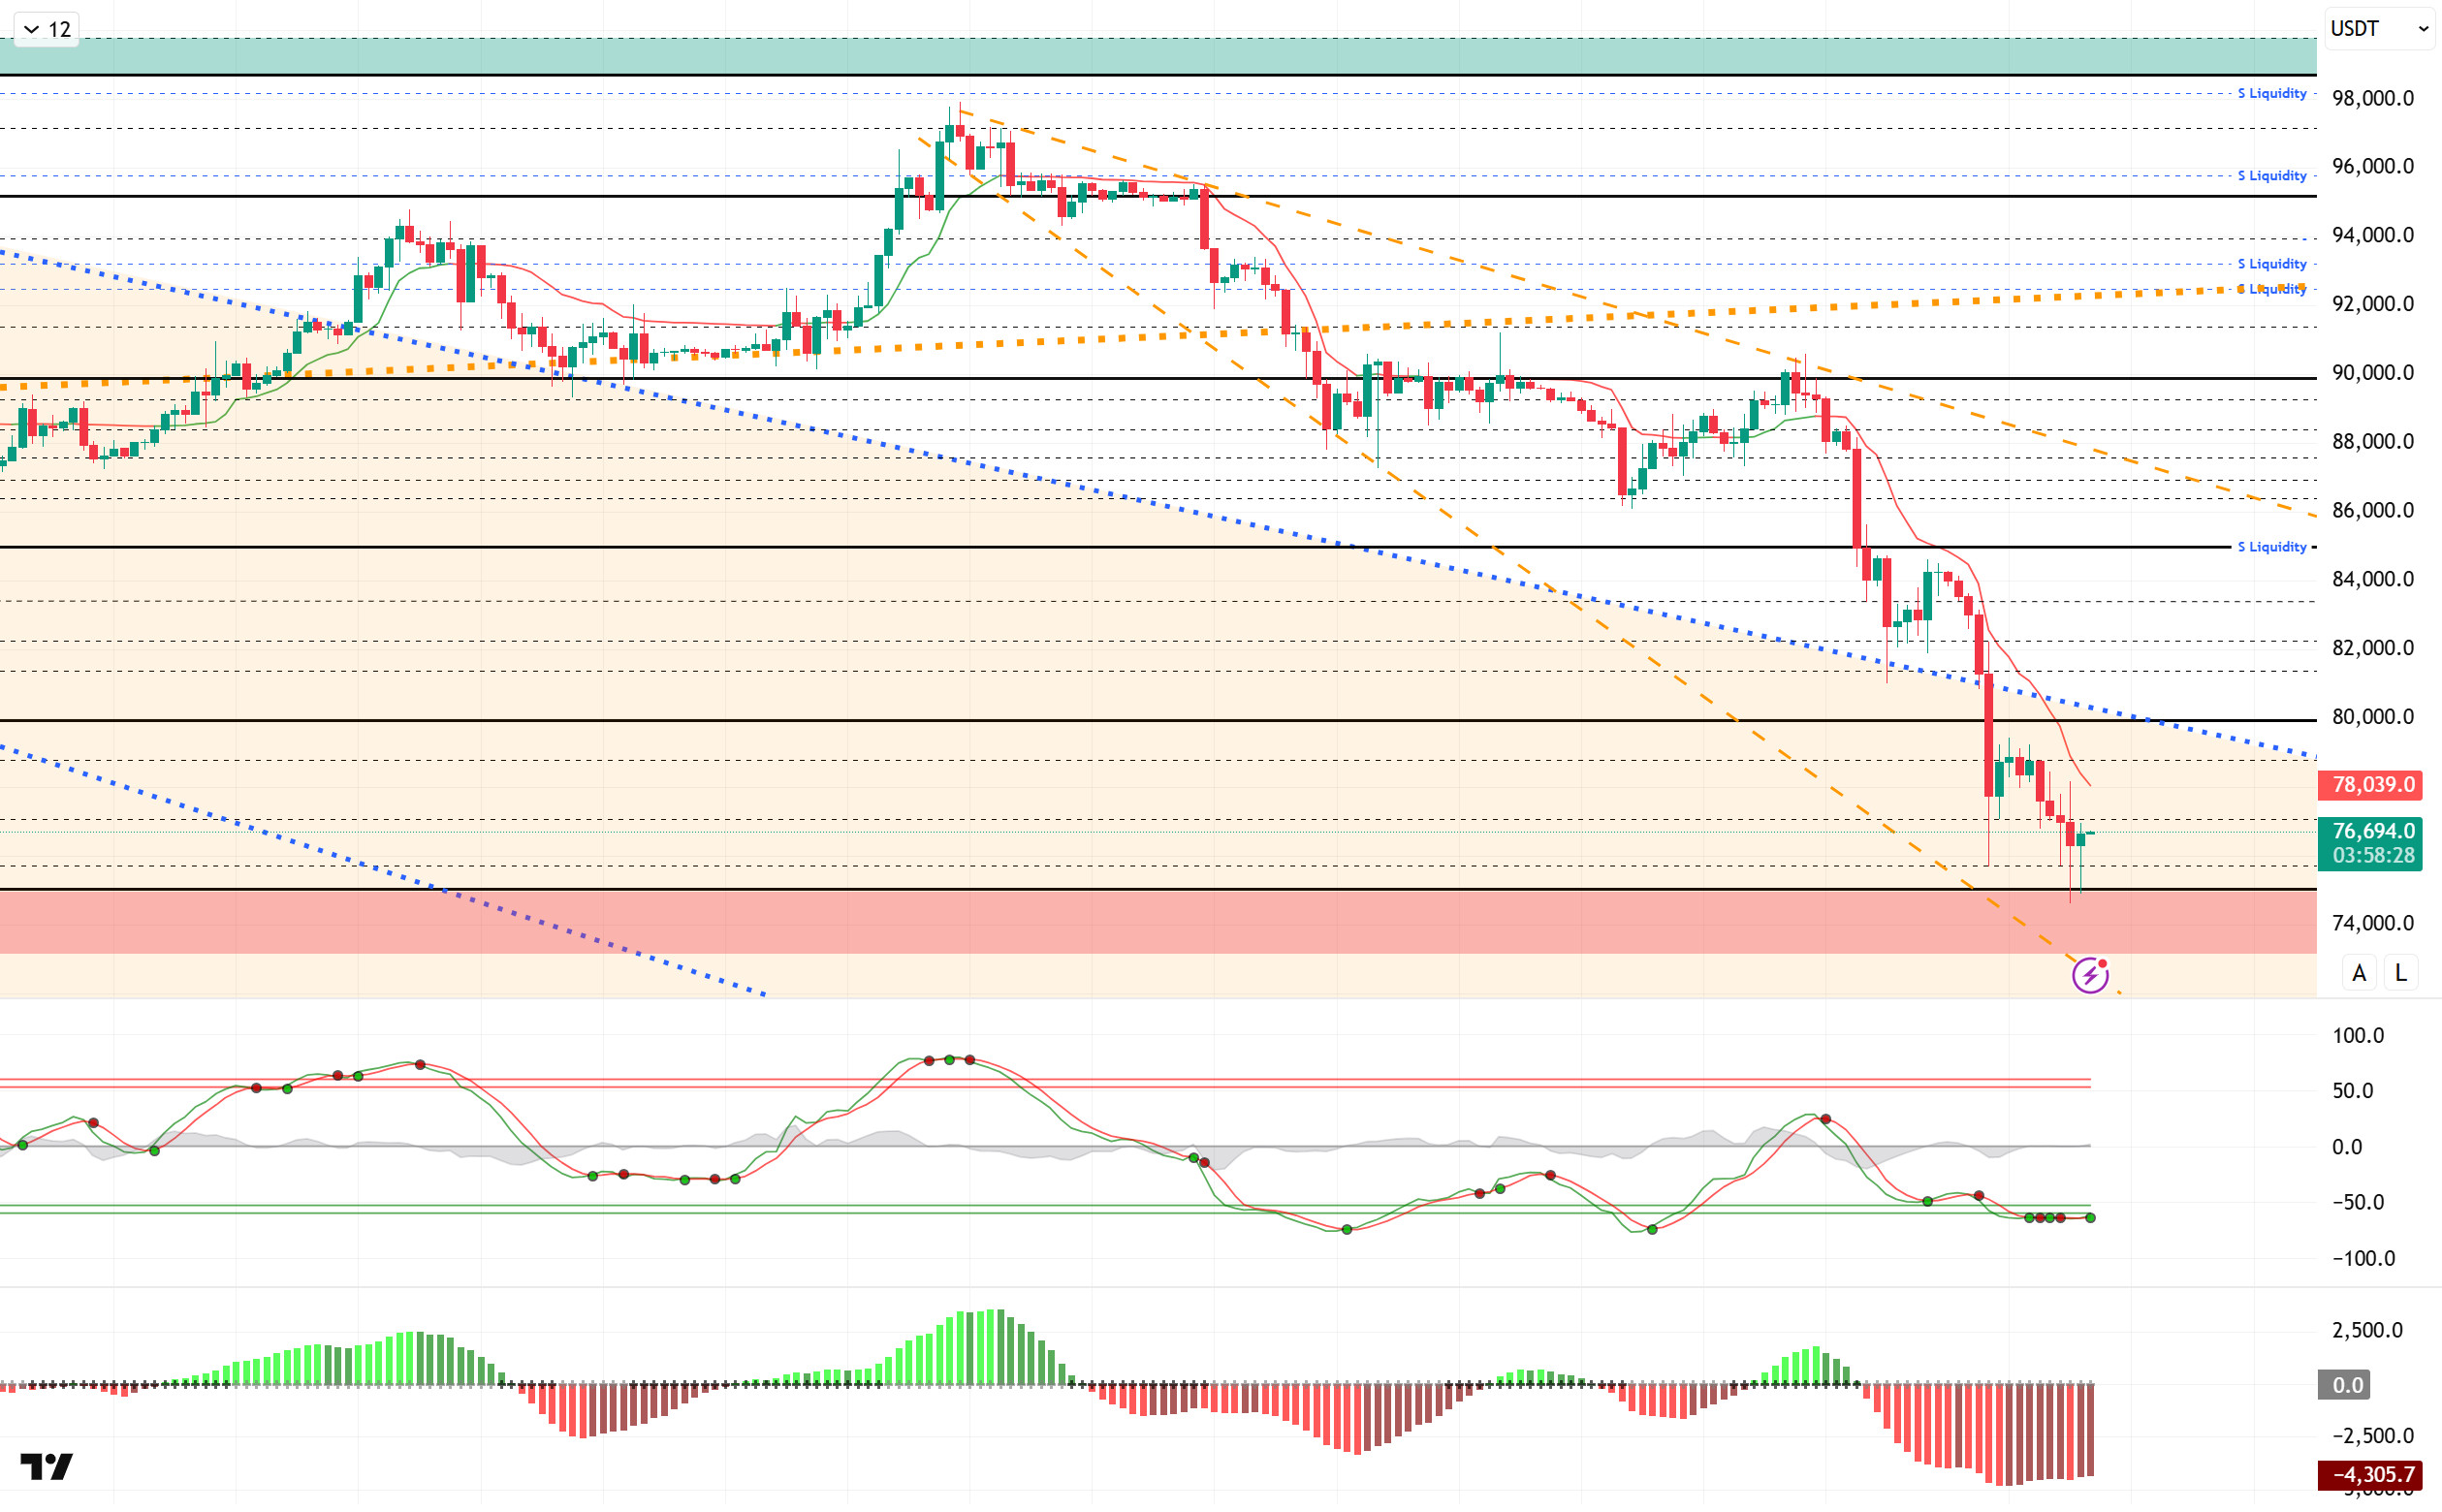
From a technical perspective, while the deep downtrend en BTC continues, it recently lost the 80,000 reference level, falling below this level for the first time since April. With the latest decline, BTC has been exhibiting highly volatile movements within the 75,000–80,000 range, with these levels emerging as key decision points for the price. Following the descending wedge pattern it formed, the price has fallen relentlessly from the 98,000 level, retreating to around 74,600, returning to pre-Trump levels. These levels stand out as previously tested ATH levels for the price, and a loss of these levels could cause the upward structure of BTC to disappear. From this point el, it will be monitored whether the price will bounce back above the 80,000 level with a dead cat bounce.
Technical indicators show that the sell signal given por the Wave Trend (WT) oscillator produced successful results en line with price movements. Currently, however, it is showing an indecisive picture en the oversold zone. The histogram el the Squeeze Momentum (SM) indicator is attempting to rebound with maximum momentum within the negative zone. The Kaufman Moving Average (KAMA) is currently trading above the price level at $78,460.
When examining liquidation data, the buying tiers resulted en complete liquidation en the short and medium term. The selling tier increased its intensity en the short term at 79,000 and en the medium term en the 85,000-86,000 band. In the long term, the intensity of positions continues above the 91,000 level.
In summary, the markets saw deep sell-offs following the nomination of Kevin Warsh as Fed chair candidate. Trump, who had maintained a dovish stance throughout the year, surprised the markets por nominating Kevin Warsh, known for his hawkish views. Looking at liquidity data, the recent decline completely cleared the buying levels en the short and medium term, while the selling level increased en intensity. Technically, BTC started the new year with positive momentum, but after testing the 98,000 level, it fell back to 74,600 levels under renewed selling pressure due to profit-taking. Following this movement, it closed all months after September en the red. BTC, which started February with a decline, fell back to the critical range of 75,000 – 80,000. While these levels stand out as a decision-making zone en terms of price, a rebound is expected to follow this stage, with BTC anticipated to regain the 80,000 level. Otherwise, with the price trading at these levels, the 75,000-reference level stands out as the price’s last area of support.
Supports: 75,000 – 73,500 – 71,000
Resistances: 78,000 – 80,000 – 81,000
ETH/USDT
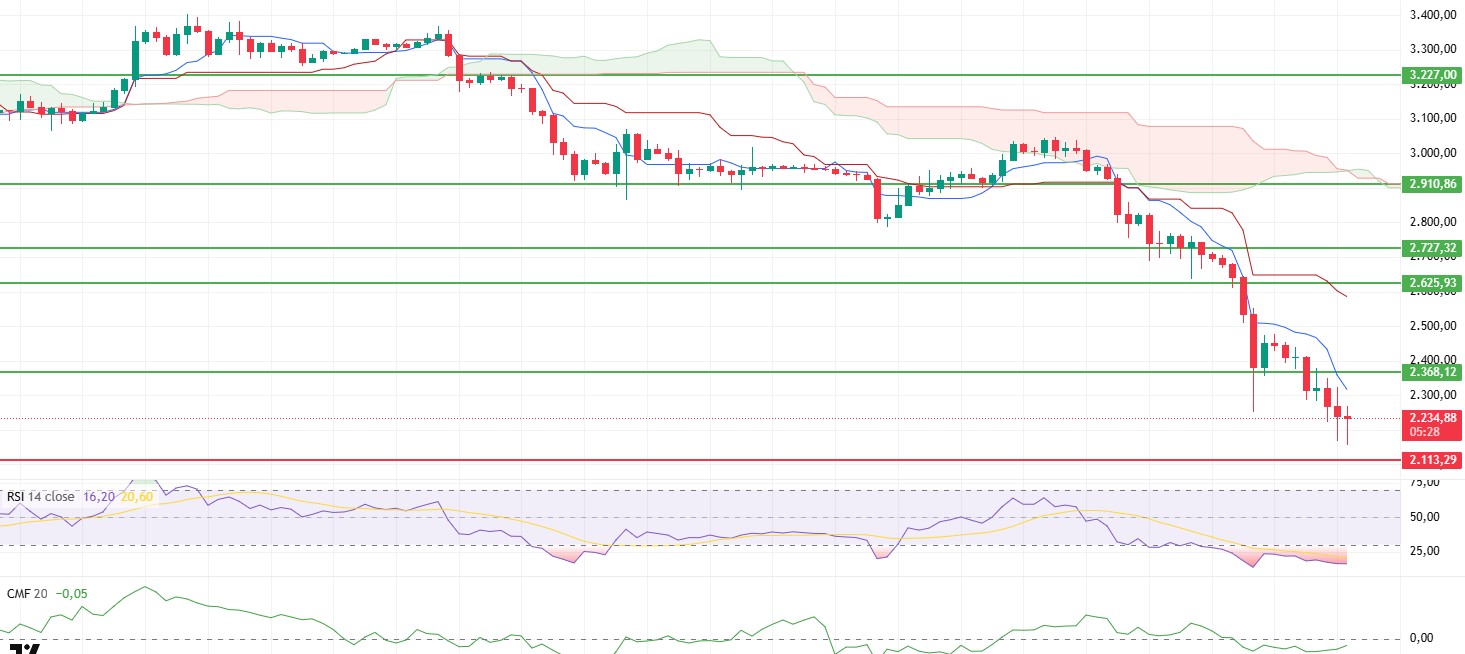
The ETH price faced a sharp sell-off since Friday following the loss of the $2,727 support level, extending its decline to the $2,157 region. As this level is very close to the key $2,113 support, the market took a breather here, and the price is attempting to reclaim the $2,200 level with a slight rebound. The current pricing indicates that panic selling has subsided somewhat, but buyers have not yet established clear control. The market is still moving el fragile ground.
The sharp turn of the funding rate into negative territory en the futures market is noteworthy. This indicates a concentration of leveraged short positions and an overly pessimistic pricing of the market. In parallel, the Chaikin Money Flow (CMF) indicator remains en negative territory, revealing that liquidity outflows are continuing. As there is no strong inflow of funds el the spot side, attempts at an uptrend remain limited for now.
Pressure is very evident el the momentum front. The Relative Strength Index (RSI) is hovering en oversold territory. While these levels technically increase the likelihood of a bottom, it seems difficult to consider this a strong reversal signal without a clear recovery or upward momentum forming en the indicator. At this stage, the price is more en search of equilibrium.
The Ichimoku indicator continues to show a weak outlook. The price is still trading below the kumo cloud, and the Tenkan and Kijun levels have not been regained. This structure confirms that the main trend is still downward en the short term. If upward attempts occur, there is a risk of encountering renewed selling at technical resistance levels.
In the overall assessment, two critical thresholds stand out for the day. If the price holds above the $2,113 level, a rebound toward the $2,368 region, which is the 0.236 Fibonacci retracement level, could be seen. Such a move could provide short-term relief but would not completely eliminate the risk of a decline. Conversely, a break below the $2,113 level could trigger more aggressive selling and drag the price towards lower support levels. At this stage, the market remains en a risky zone.
Supports: 2,113 – 1,958 – 1,756
Resistances: 2,368 – 2,625 – 2,727
XRP/USDT
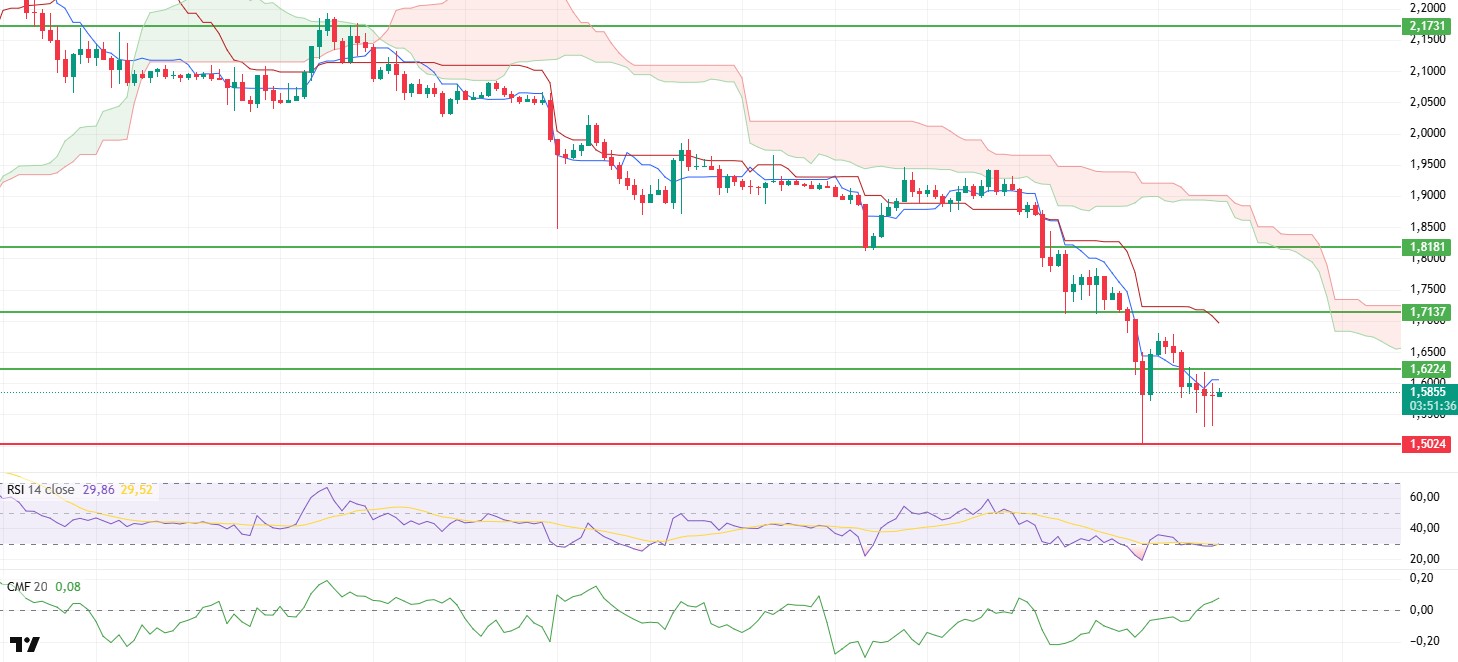
The XRP price remained under significant pressure throughout the weekend. Sales accelerated el Saturday with the loss of the $1.62 key support level, causing the price to experience a sharp pullback to the $1.50 level. Buying from this area slowed the decline somewhat, but it was not strong enough to reverse the trend. Currently trading around $1.58, XRP remains en a downtrend, with the market seeking equilibrium el fragile ground.
A notable divergence has emerged el the liquidity side. Despite the sharp decline en price, the Chaikin Money Flow (CMF) indicator has moved into positive territory and gained upward momentum, indicating that money is flowing back into the market. This suggests that investors are beginning to view current levels as an opportunity. However, liquidity inflows alone are not enough to reverse the trend, and the price needs to regain critical levels.
The momentum picture does not appear excessively weak. The Relative Strength Index (RSI) is moving sideways near the oversold zone. While this structure indicates that selling pressure remains strong, the fact that momentum has not completely collapsed keeps the possibility of a short-term bottom alive. To speak of a clear reversal, we need to see a significant upward recovery en the RSI.
On the technical side, the Ichimoku indicator maintains its weak outlook. The price is still trading below the kumo cloud, and the Tenkan and Kijun levels have not been regained. This confirms that the main trend remains downward en the short term. Even if upward attempts occur, these technical barriers may continue to act as resistance.
Two critical levels stand out en the broader picture. If the price breaks above $1.62 again during the day, upward momentum could accelerate and the short-term recovery scenario could strengthen. Conversely, a loss of the $1.50 support level could lead to a continuation of the downtrend and bring lower levels into focus. At this stage, the direction remains dependent el price reactions at these two levels.
Supports: 1.5024– 1.4119 – 1.2540
Resistances: 1.6224 – 1.7137 – 1.8181
SOL/USDT
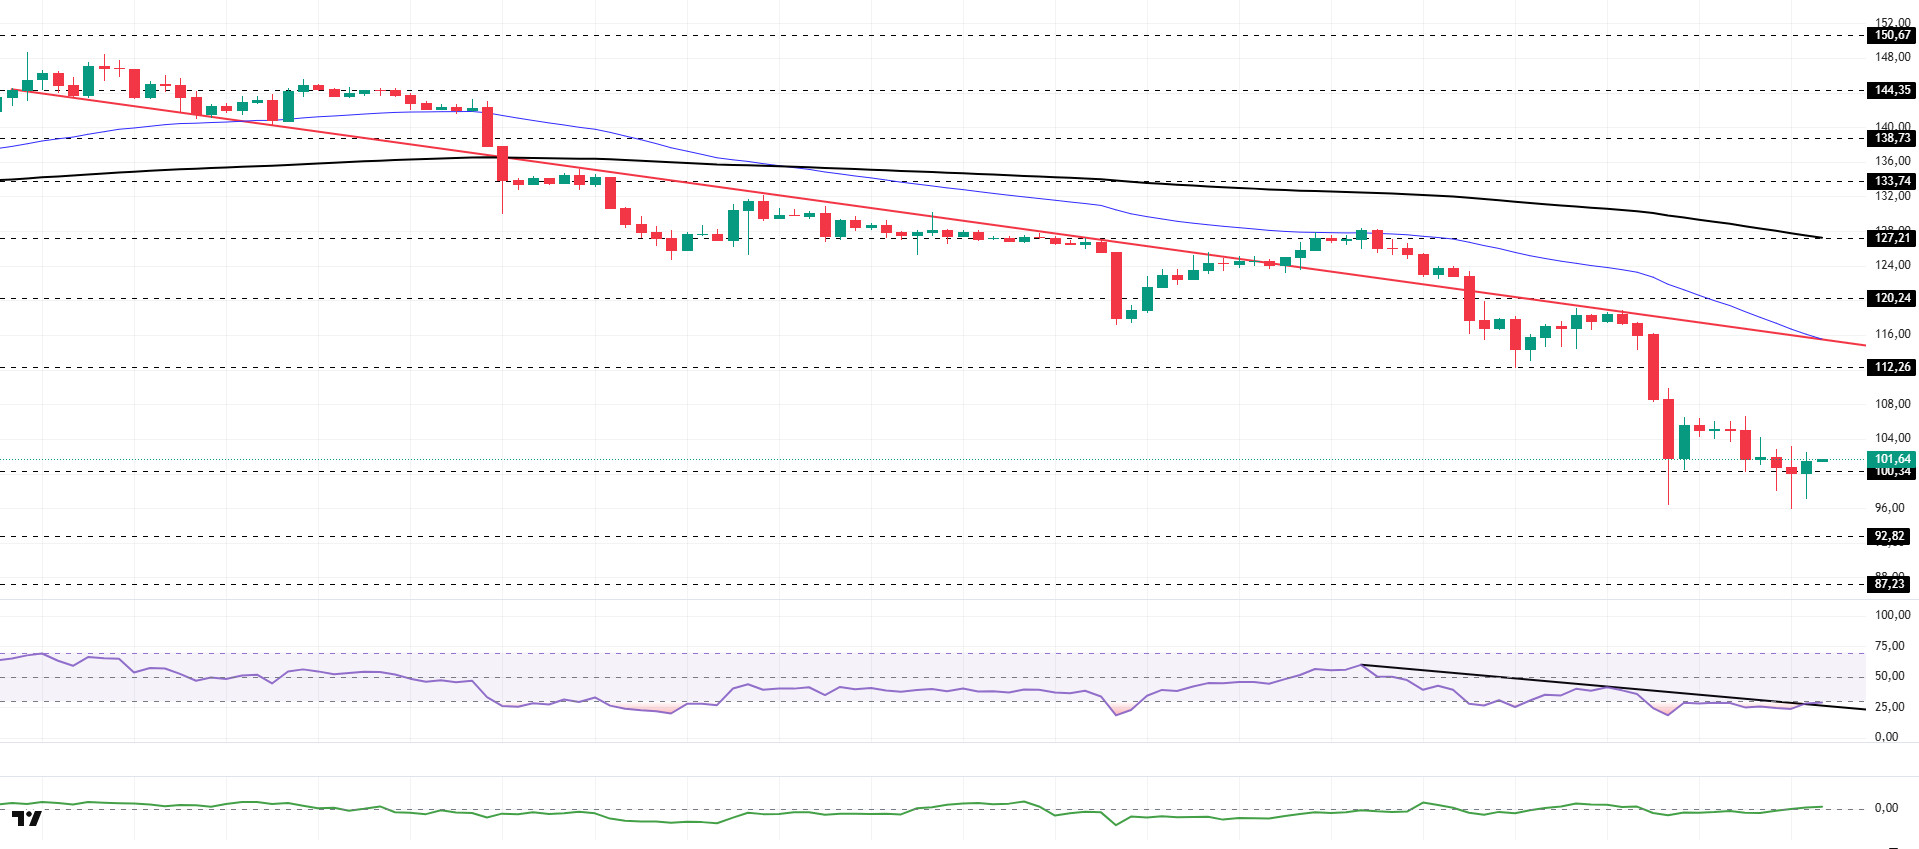
SOL continued its pullback. The asset remained en the lower region of the downtrend that began el January 13, signaling continued selling pressure. Breaking below the strong support level of $112.26, the asset is currently testing the strong support level of $100.34. If it closes below this level, it could test the $92.92 level. If it rallies, it could test the downward trend line as resistance.
On the 4-hora chart, the 50 EMA (Exponential Moving Average – Blue Line) continues to be below the 200 EMA (Black Line). This indicates that a downtrend may begin en the medium term. At the same time, the price being below both moving averages shows that the asset is trending downward en the short term. The Chaikin Money Flow (CMF-20) has risen into positive territory. However, a decrease en money inflows could pull the CMF back into negative territory. The Relative Strength Index (RSI-14) has seen a slight rise from the oversold zone. This could trigger profit-taking, causing the price to react from this level. At the same time, it is testing the downward trend el January 28 as resistance. If it breaks this level, buying pressure may occur. In the event of an uptrend due to macroeconomic data or positive news related to the Solana ecosystem, the $120.24 level stands out as a strong resistance point. If this level is broken upwards, the uptrend is expected to continue. If there are pullbacks due to developments en the opposite direction or profit-taking, it may test the $87.23 level. If it falls back to these support levels, an increase en buying momentum could present a potential upside opportunity.
Supports: 100.34 – 92.82 – 87.23
Resistances: 112.26 – 120.24 – 127.21
DOGE/USDT
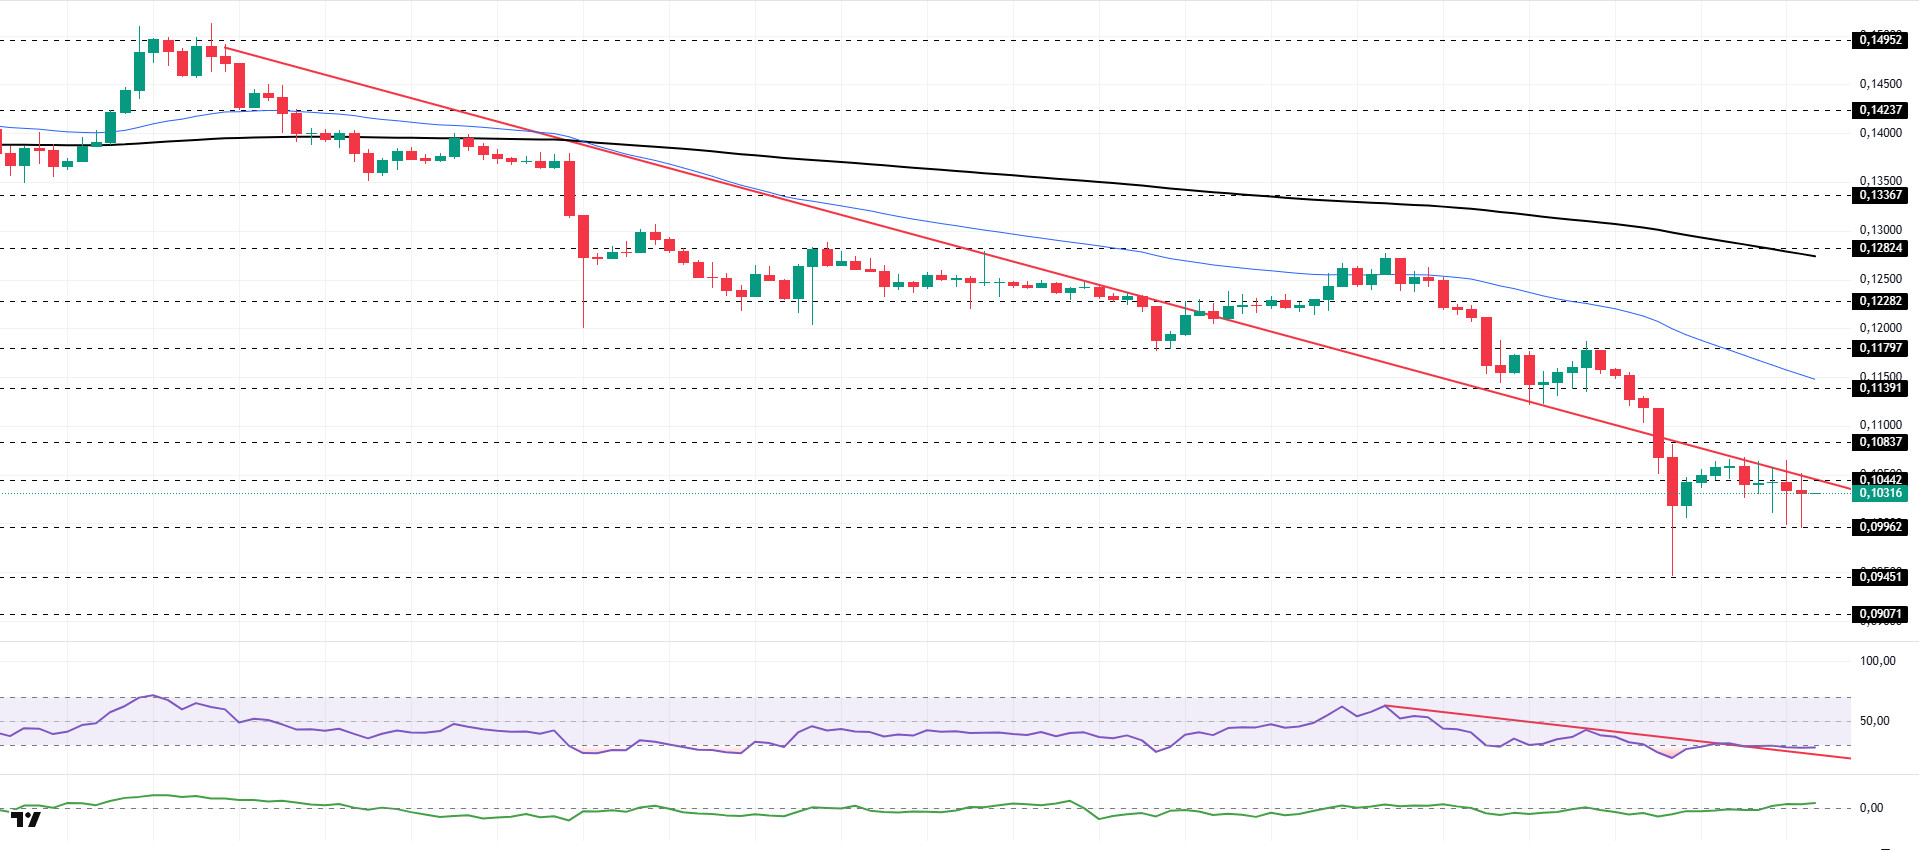
The DOGE price experienced a decline. The asset moved into the lower region of the downtrend that began el January 14 and deepened its decline. Testing the strong support level of $0.09962, the asset accelerated from there and showed a slight increase. Currently preparing to test the downward trend as resistance, the asset may test the 50 EMA (Blue Line) moving average as resistance if it breaks above this level. If the pullback continues, the $0.09451 level should be monitored.
On the 4-hora chart, the 50 EMA (Exponential Moving Average – Blue Line) remained below the 200 EMA (Black Line). This indicated that a medium-term downtrend was forming. The price being below both moving averages indicates that the price may be trending downward en the short term. Chaikin Money Flow (CMF-20) moved into positive territory. Additionally, a decrease en money inflows could pull the CMF into negative territory. The Relative Strength Index (RSI-14) remained en the oversold zone. This could trigger profit-taking and lead to an upward movement. At the same time, it crossed into the upper zone of the downward trend that began el January 28, signaling that buying pressure could build. In the event of an uptrend driven por political developments, macroeconomic data, or positive news flow en the DOGE ecosystem, the $0.11391 level stands out as a strong resistance zone. Conversely, en the event of negative news flow, the $0.09071 level could be triggered. A decline to these levels could increase momentum and initiate a new wave of growth.
Supports: 0.09962 – 0.09451 – 0.09071
Resistances: 0.10442 – 0.10837 – 0.11391
TRX/USDT
Tron Inc. announced en a post this morning that it purchased 174,740 TRX at an average price of $0.29, bringing its total holdings to over 679.4 million TRX. The company stated en its announcement that it aims to further increase its Tron holdings to boost share value en the long term.
As of February 1, 2026, the total amount of TRX staked is 46,082,871,165, representing 48.65% of the circulating supply. Compared to the previous day, there has been an increase of approximately 0.05% en the amount staked. Meanwhile, the market value of TRX has reached $27 billion. Furthermore, a total of 2,655,983 TRX was burned yesterday, and a net 1,259,593 TRX was added to the circulating supply. This situation is leading to increased inflationary pressure el Tron.
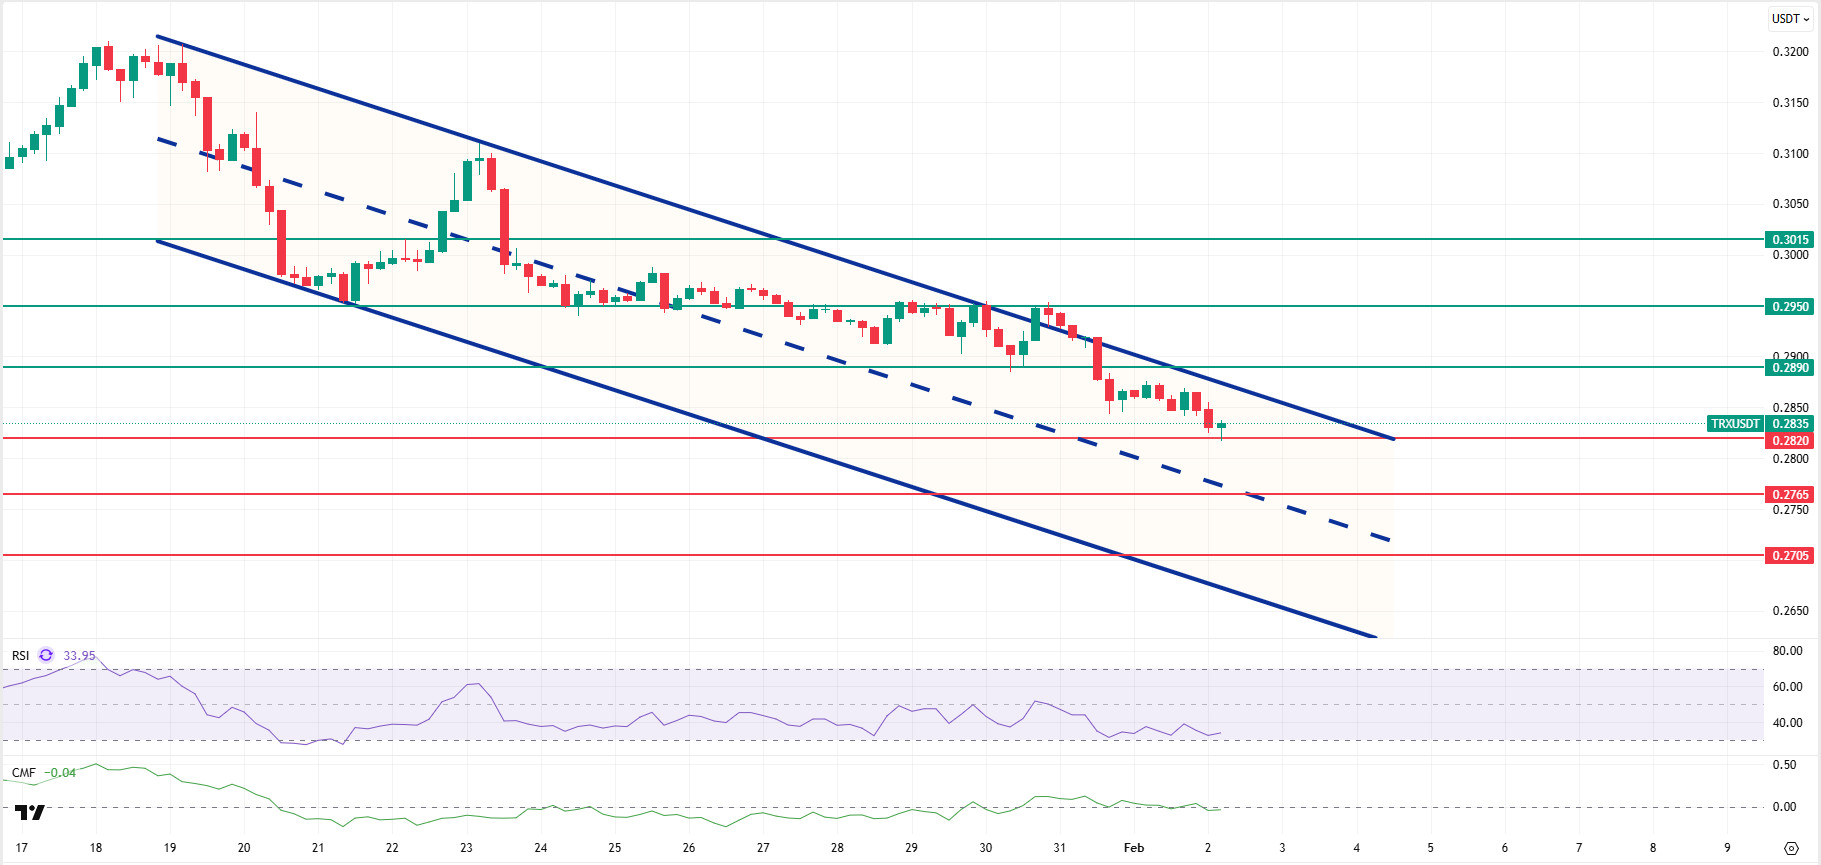
Technically speaking, TRX closed yesterday evening at 0.2847 after a decline, retreated a little more en the morning horas, and is currently trading at 0.2835. Currently en the upper band of the bearish channel, TRX is priced above the 0.2820 support el the 4-hora chart. The Relative Strength Index (RSI) value is seen to be very close to the oversold zone at 33. In addition, the Chaikin Money Flow (CMF) indicator value is below zero at -0.04, indicating that money inflows continue to decline. The current picture points to selling pressure gaining strength and an increased likelihood of the price moving downward en the short term.
In light of all these indicators, TRX is expected to decline slightly towards the middle band of the channel en the first half of the day, given its current zone and CMF value. It may thus retest the 0.2820 support level. A candle close below the 0.2820 support could extend the decline, potentially testing the 0.2765 support level. If it fails to close below the 0.2820 support level and the CMF indicator also moves into positive territory, it may rise slightly with a possible buying reaction and test the 0.2890 resistance level. On the 4-hora chart, 0.2705 is an important support level, and as long as it remains above this level, the possibility of an upward movement is maintained. If this support is broken, selling pressure may increase.
Supports: 0.2820 – 0.2765 – 0.2705
Resistances: 0.2890 – 0.2950 – 0.3015
Legal Notice
The investment information, comments, and recommendations contained herein do not constitute investment advice. Investment advisory services are provided individually por authorized institutions taking into account the risk and return preferences of individuals. The comments and recommendations contained herein are of a general nature. These recommendations may not be suitable for your financial situation and risk and return preferences. Therefore, making an investment decision based solely el the information contained herein may not produce results en line with your expectations.

