
Technical Analysis
BTC/USDT
While the 35-day government shutdown en the US is suppressing economic activity, Fed members have shown clear differences of opinion el the pace and scope of interest rate cuts. President Donald Trump announced that they do not plan to send Tomahawk missiles to Ukraine and that support will remain “defense-focused.” Manufacturing indicators are sending mixed signals, while the SOFR rate saw its sharpest annual jump, rising to 4.22%.
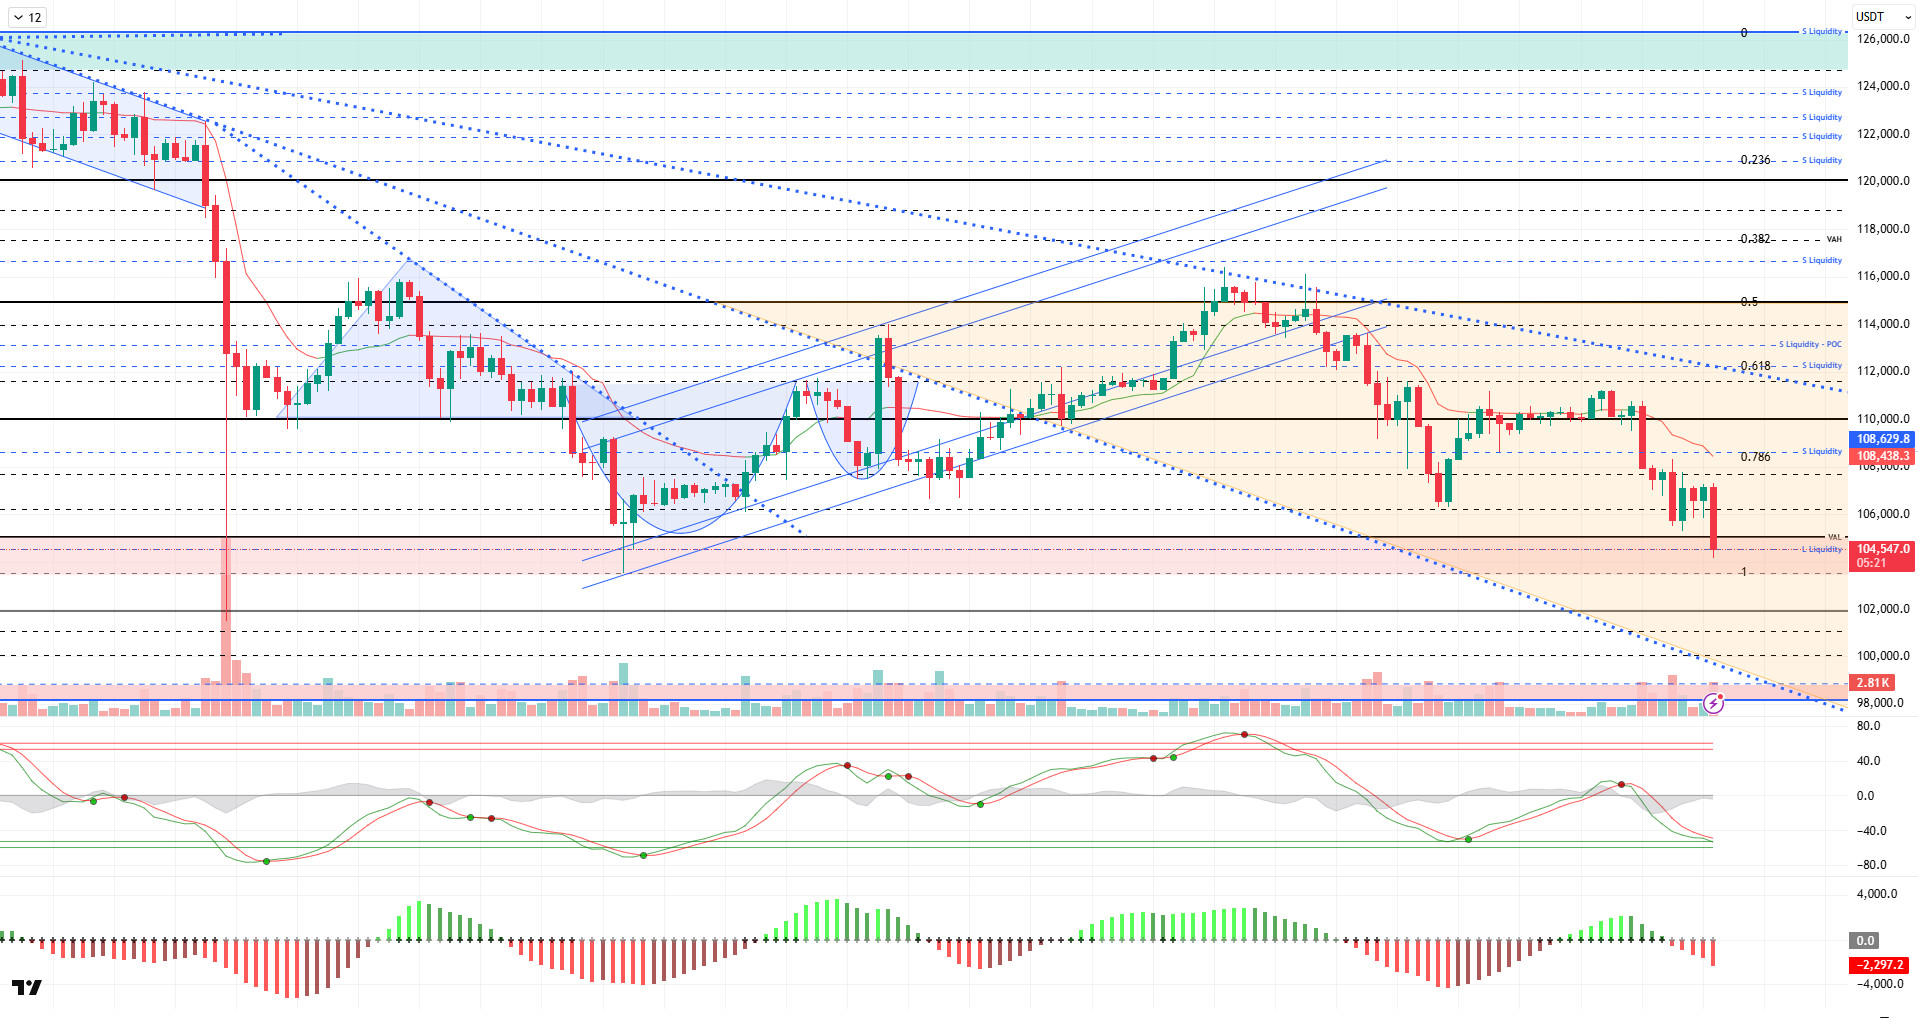
From a technical perspective, BTC failed to maintain its previous upward jump to the 108,300 level and fell back to the 104,200 level under heavy selling pressure. Continuing its movement within a downward trend structure, the price fell below the VAL level. Having managed to bounce back from the red band range it has tested many times before, this area could be critical for the price to hold above the six-digit level.
Technical indicators recorded a short-term rebound en the Wave Trend (WT) channel middle band but moved into oversold territory with the latest decline. The Squeeze Momentum (SM) indicator’s histogram moved back into negative territory after showing signs of a short-term rebound. The Kaufman moving average (KAMA) is currently at $108,400, positioned above the price.
According to liquidation data, trades at the last level where the buy order was accumulated, 104,500, also resulted en liquidation. On the other hand, while there is short-term concentration at the 108,500 level el the sell side, there is significant concentration at 112,000-113,000 en the broader time frame. Looking at the last 24 horas’ data, a total of $1.34 billion was liquidated en the market.
In summary, while the effects of the US-China tariff crisis being suspended for a year and resulting en a compromise continue, optimistic developments continue to emerge from both sides. However, the Fed’s hawkish tone el interest rate cuts continues to put pressure el the market, while the US government shutdown has reached an all-time high. On the technical side, although BTC has recorded short-term gains from time to time, it is seen that the parallel rises to the descending trend channel it has formed are not sustainable. Liquidity data also shows that the selling pressure continues to prevail. Moving forward, 103,300 will be monitored as a critical support level. A breach of this level could deepen selling pressure, potentially leading to a loss of six-figure levels. In the event of a potential rebound, we will monitor resistance levels at 106,600, 107,400, and 108,600, respectively.
Supports: 103,300 – 101,800 – 100,000
Resistances 106,600 – 107,400 – 108,600
ETH/USDT
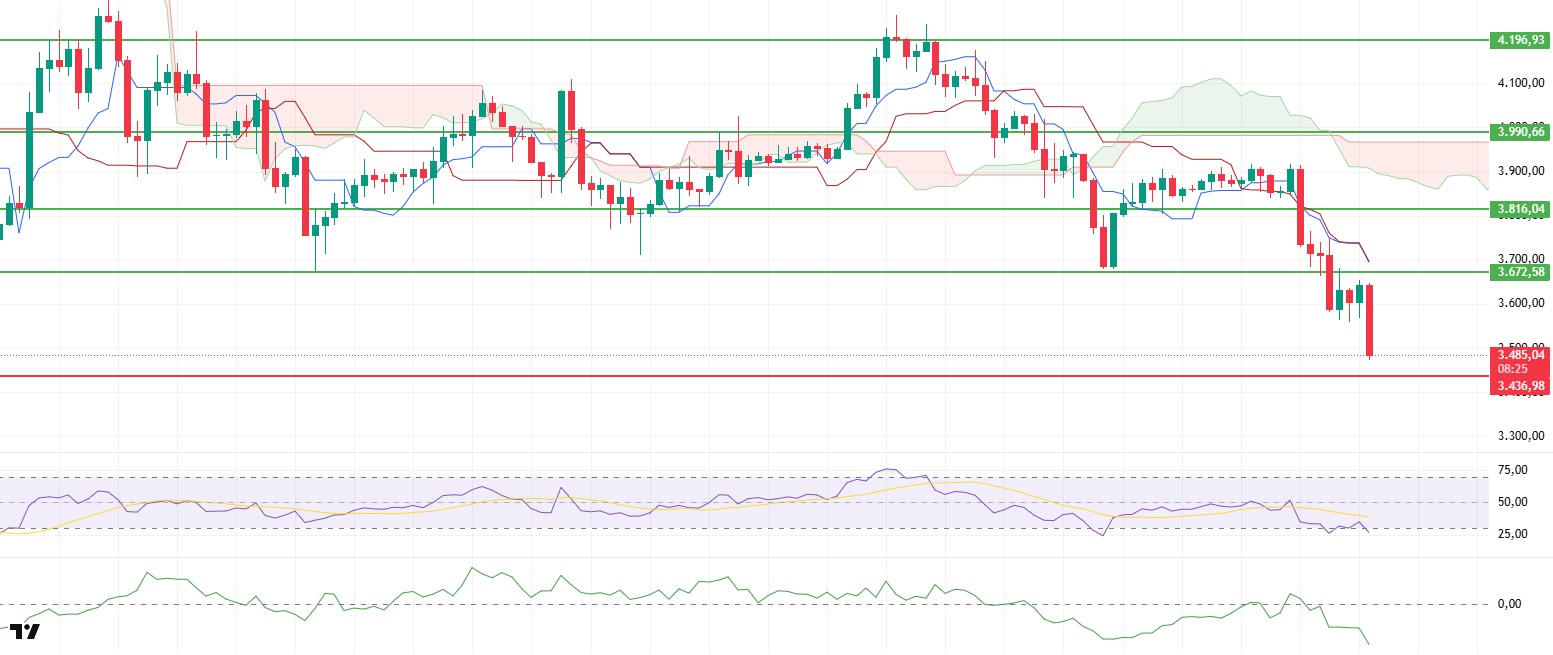
The ETH price lost its $3,672 support level yesterday evening, consistent with the weak outlook en technical indicators. With the opening of Asian markets, selling pressure accelerated and the price fell below the $3,500 level. This movement shows that the market remains bearish en the short term and that buyers are responding weakly.
The Chaikin Money Flow (CMF) indicator continues its decline en negative territory. This outlook reveals that strong liquidity outflows continue en the market and investor confidence en ETH is waning. The CMF remaining at these levels may limit buying momentum en the short term.
The Relative Strength Index (RSI) indicator has fallen to the oversold zone. This structure indicates that momentum loss is continuing and selling pressure remains strong. Although the RSI being at these levels technically brings short-term rebound rallies into focus, these rallies are likely to be seen as selling opportunities due to weak momentum.
In the Ichimoku indicator, the price is still moving below the kumo cloud and the Tenkan and Kijun levels. This technical structure confirms that the overall trend remains clearly negative and that the direction will continue to be downward en the short term.
The overall outlook supports a downward structure. Failure to regain the $3.672 level could lead to a continuation of the downward movement and a pullback to the $3.436 level during the day. A break below this support could deepen the selling pressure. However, if the price settles back above the $3,672 level, it could weaken the negative scenario and signal the start of a short-term uptrend.
Below the Form
Supports: 3,436 – 3,227 – 3,020
Resistances: 3,672 – 3,816 – 3,990
XRP/USDT
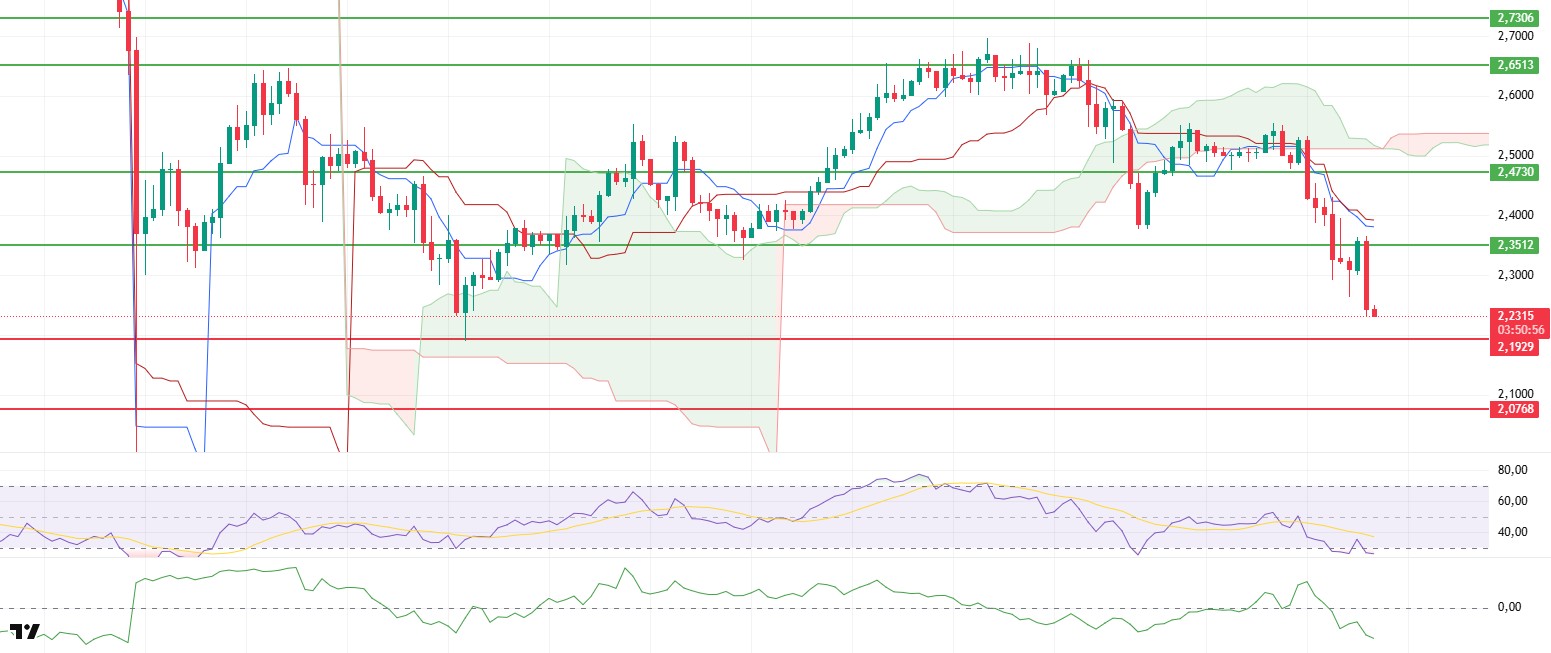
After losing its $2.35 support en the morning horas, the XRP price experienced a sharp decline to the $2.23 level as selling pressure increased. This weak trend indicates that the market is still controlled por sellers en the short term and that buyers are unable to respond adequately.
The Chaikin Money Flow (CMF) indicator continues to move en negative territory. This outlook reveals that strong liquidity outflows from the market are continuing and investor confidence is weakening. The CMF remaining at these levels increases the likelihood of continued pressure el prices en the short term.
The Relative Strength Index (RSI) indicator has fallen to the oversold zone. The acceleration of momentum loss indicates that the downward momentum remains strong. Although the RSI’s drop to these levels technically allows for a rebound, such movements are not expected to be sustainable due to the current weak momentum, and any potential rallies may be seen as selling opportunities.
According to the Ichimoku indicator, the price is still below the kumo cloud and moving behind the Tenkan and Kijun levels. This technical structure indicates that the trend remains clearly negative and that upward attempts will continue to be limited.
Overall, the technical outlook remains bearish. If the price fails to regain the $2.35 level, the decline could extend to the $2.19 support. Breaking below this level could trigger increased selling pressure and deeper pullbacks. However, a move back above $2.35 could trigger a short-term recovery attempt.
Supports: 2.1929 – 2.0768 – 1.9092
Resistances: 2.3512 – 2.4730 – 2.6513
SOL/USDT
Invesco Galaxy announced a 0.25% fee.
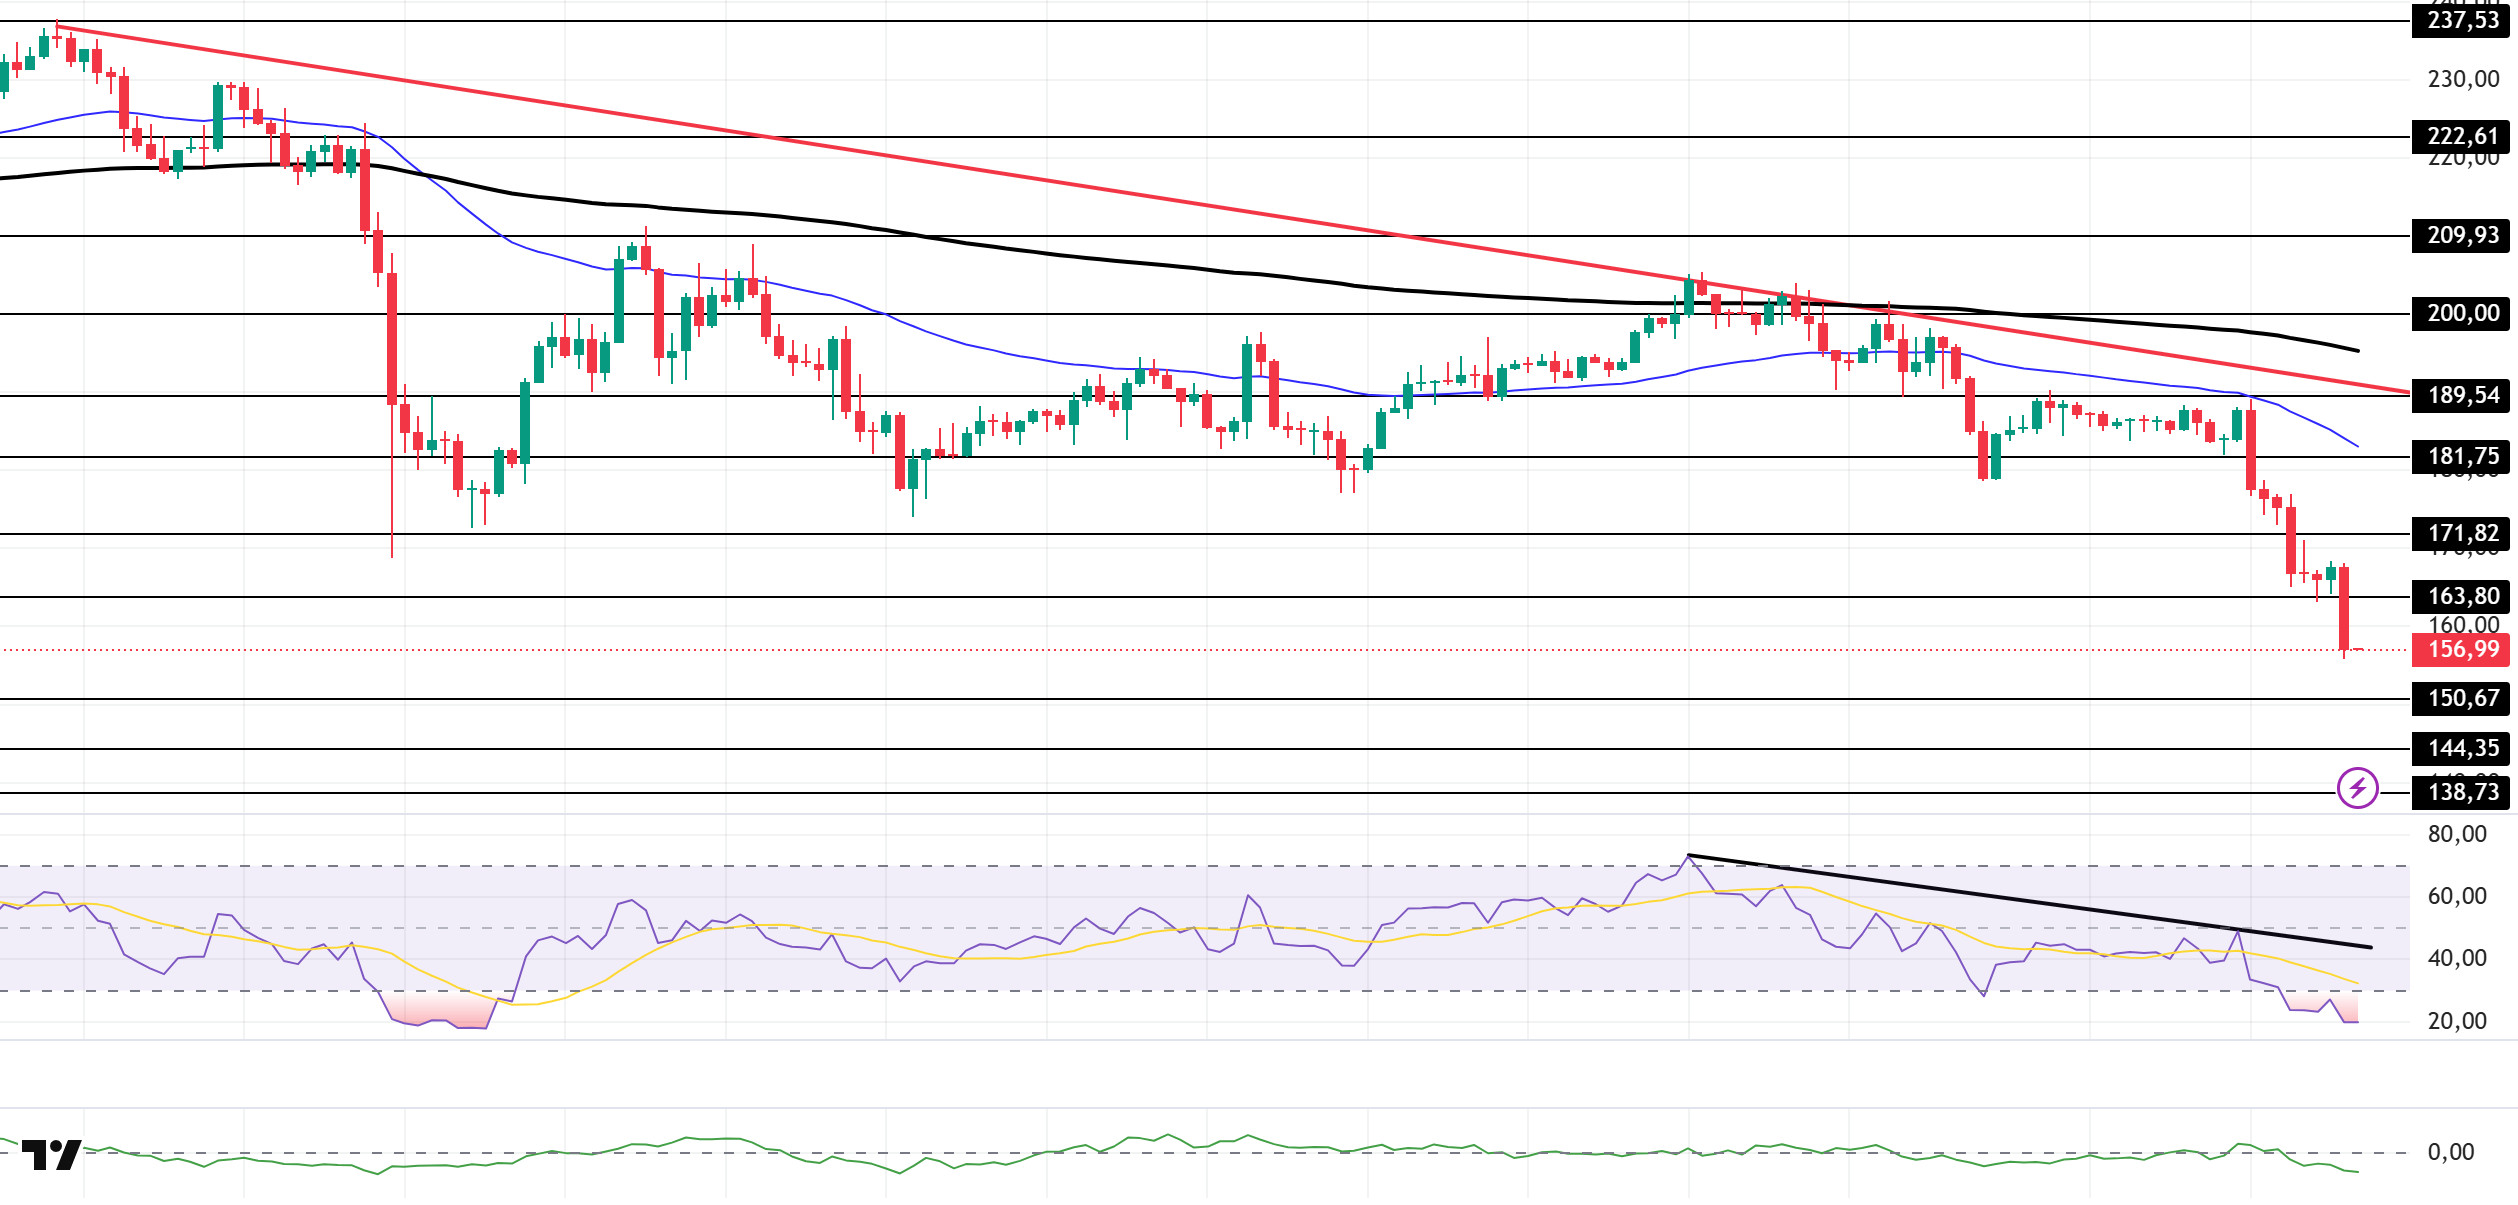
The SOL price deepened its decline. The asset tested the 50 EMA (Blue Line) moving average and the $189.54 level as resistance but failed to break through, continuing its pullback and remaining en the lower region of the downward trend that began el October 6. Currently continuing its decline, the price could test the $150.67 level if the pullback continues. If rallies begin, it could retest the $181.75 level.
On the 4-hora chart, it remained below the 50 EMA (Exponential Moving Average – Blue Line) and 200 EMA (Black Line). This indicates that it may be en a medium-term downtrend. At the same time, the price being below both moving averages shows us that the asset is en a downward trend en the short term. The Chaikin Money Flow (CMF-20) is en the middle of the negative zone. However, an increase en money inflows could push the CMF into positive territory. The Relative Strength Index (RSI-14) remained en the oversold zone. It also continued to be en the lower region of the downward trend that began el October 27. In the event of an uptrend driven por macroeconomic data or positive news related to the Solana ecosystem, the $181.75 level stands out as a strong resistance point. If this level is broken upwards, the uptrend is expected to continue. In the event of pullbacks due to developments en the opposite direction or profit-taking, the $150.67 level could be tested. A decline to these support levels could increase buying momentum, presenting a potential opportunity for an upward move.
Supports: 150.67 – 144.35 – 138.73
Resistances: 163.80 – 171.82 – 181.75
DOGE/USDT
Grayscale announced a 0.35% fee for Dogecoin ETFs.
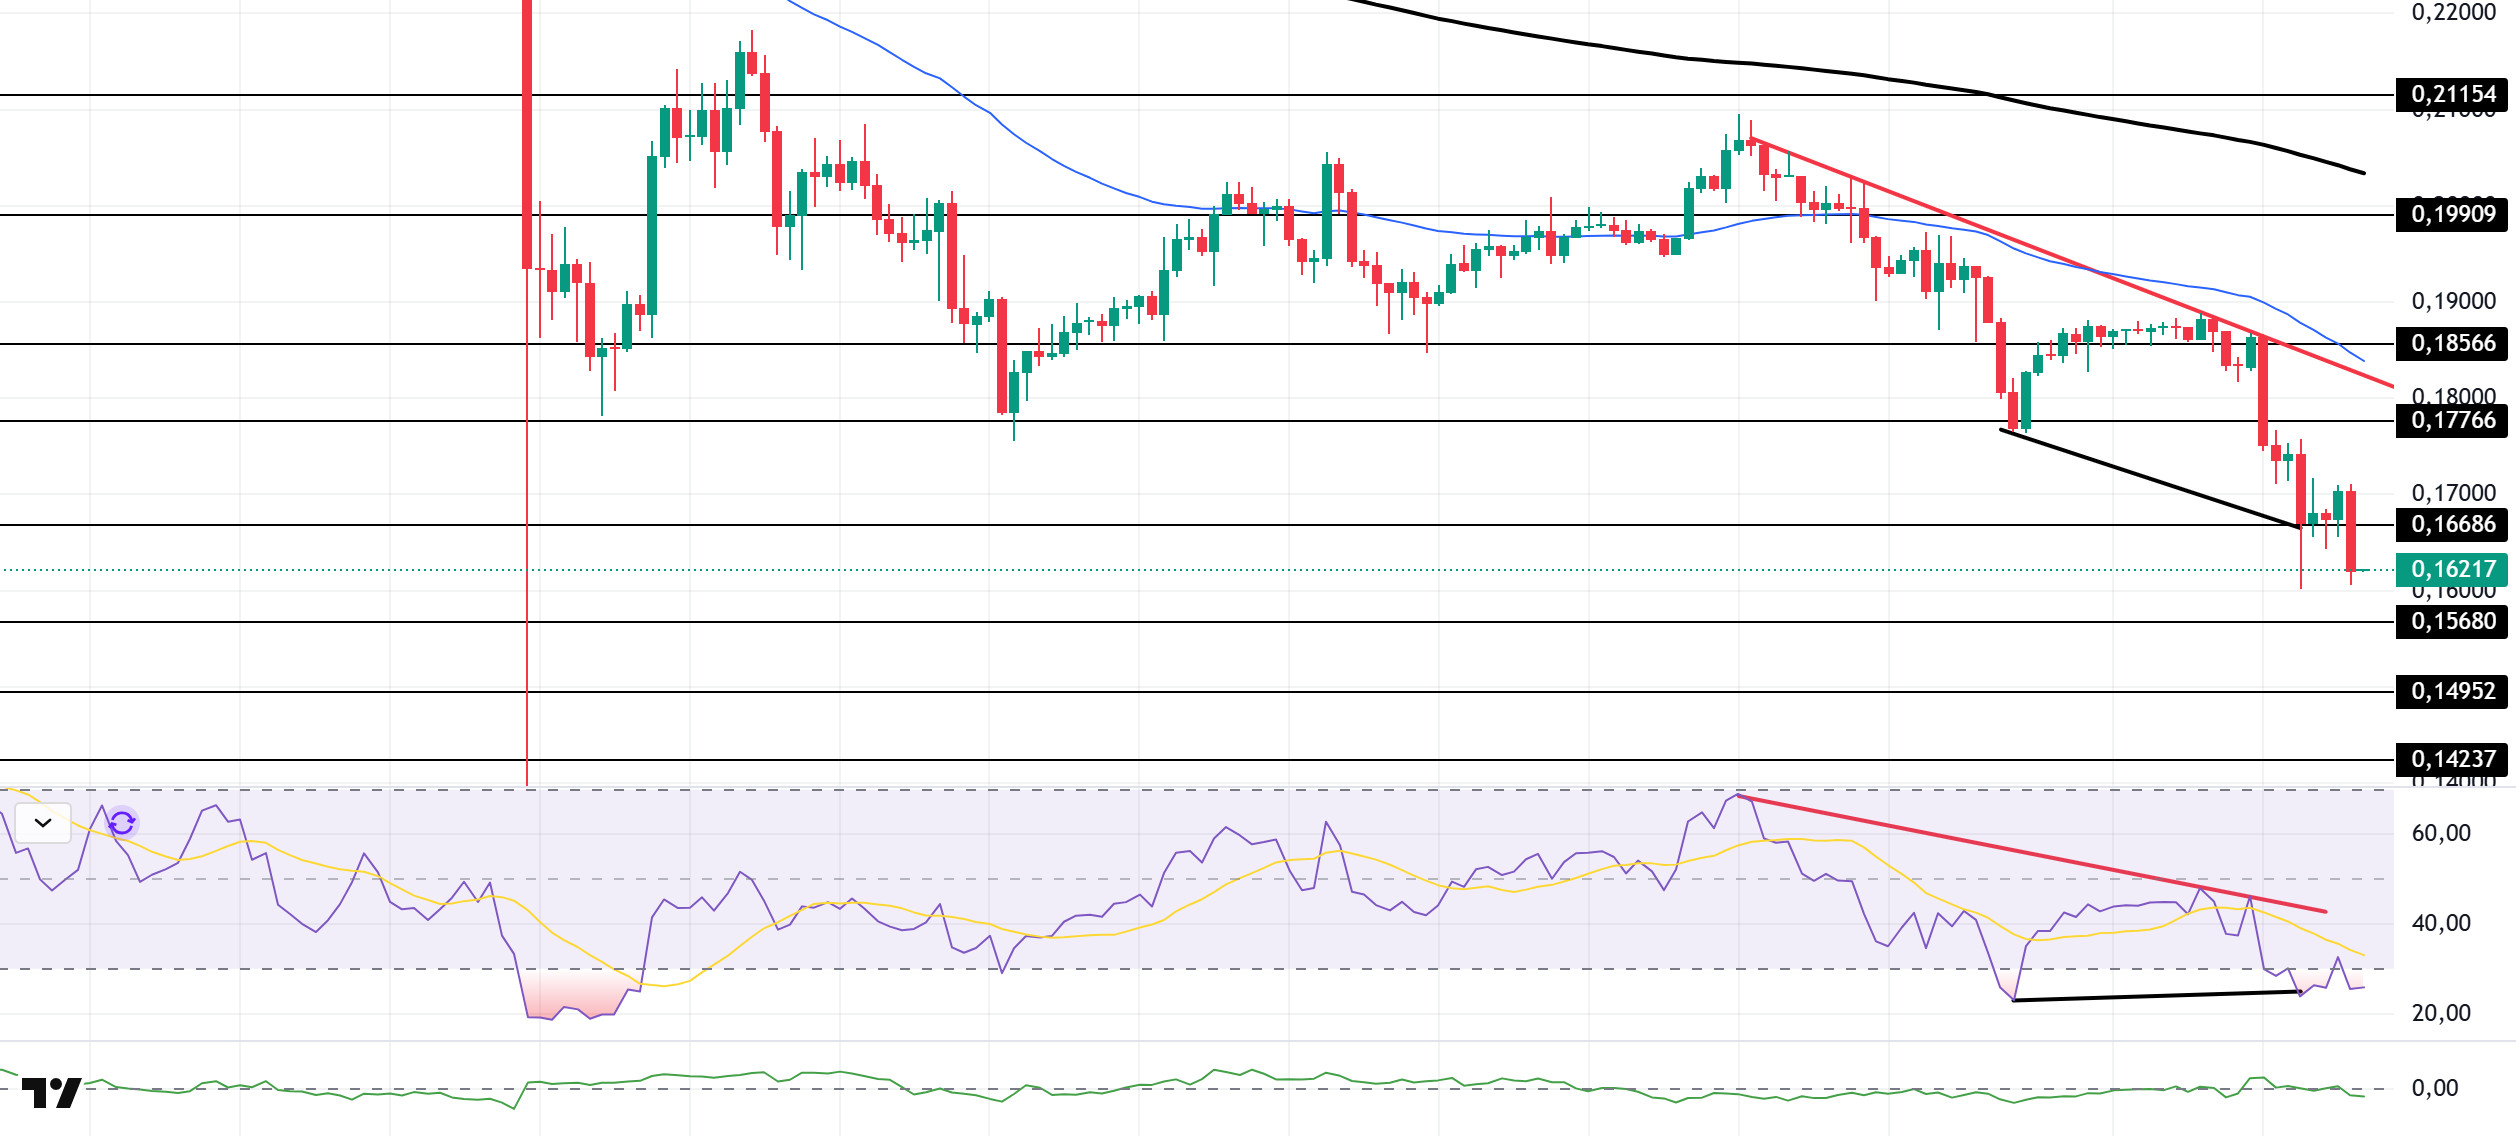
The DOGE price continued its decline. The asset tested the descending trend line that began el October 27 and the $0.18566 level as resistance and deepened its pullback. The price, which continues to be en the lower region of the descending trend line, may test the $0.15680 level if it continues to pull back. If an uptrend begins, it could retest the downward trendline as resistance.
On the 4-hora chart, the 50 EMA (Exponential Moving Average – Blue Line) remained below the 200 EMA (Black Line). This indicates that a downtrend may begin en the medium term. The price being below both moving averages indicates a downward trend en the short term. The Chaikin Money Flow (CMF-20) remained en the neutral zone. Additionally, a decrease en cash inflows could push the CMF into negative territory. The Relative Strength Index (RSI-14) is en the oversold zone. It also remained below the downward trend line that began el October 27. On the other hand, there is a positive divergence. These factors could increase buying pressure. In the event of potential increases driven por political developments, macroeconomic data, or positive news flow within the DOGE ecosystem, the $0.17766 level stands out as a strong resistance zone. Conversely, en the event of negative news flow, the $0.15680 level could be triggered. A decline to these levels could increase momentum and initiate a new wave of growth.
Supports: $0.15680 – $0.14952 – $0.14237
Resistances: 0.16686 – 0.17766 – 0.18566
BNB/USDT
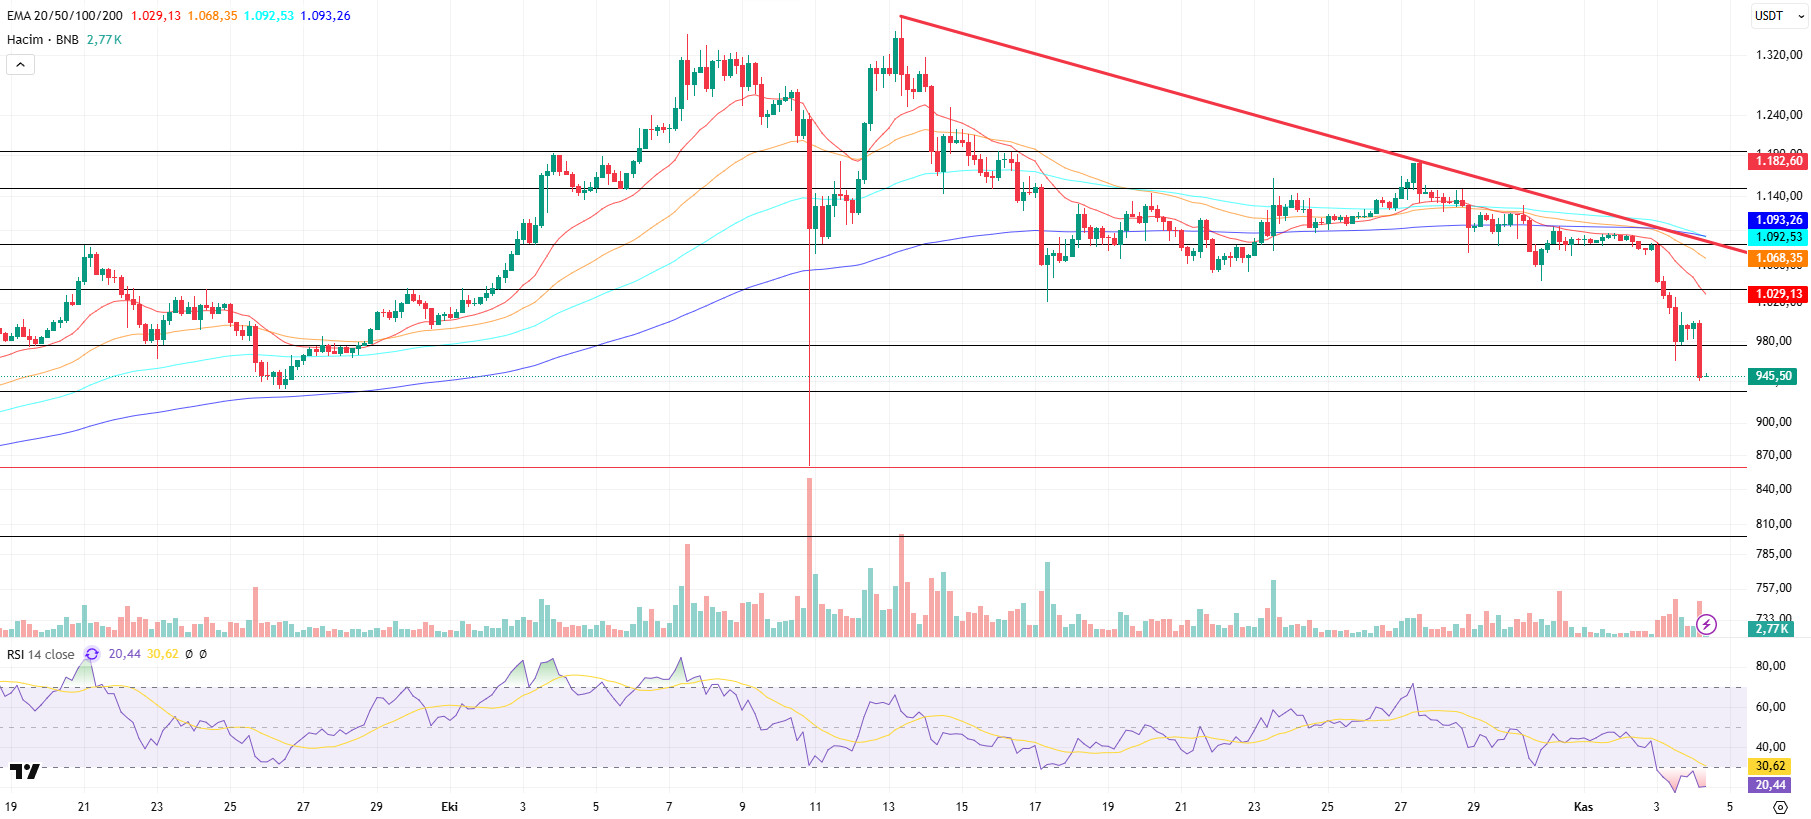
From a technical perspective, positive news flow supporting the BNB price en recent times has led to positive momentum en the BNB/USDT pair, with the price movement continuing up to the $1,180 level, but this momentum has not been sustained.
At these levels, however, the correction that began after the all-time high (ATH) regained strength, and a pullback towards the $980 support zone identified en previous technical analyses occurred. After entering a decision phase at this level for a while, the asset increased its pullback momentum with the opening of new candles and turned its direction downwards again.
Technical indicators for BNB/USDT, currently trading en the $930–980 range, show that the recent decline en trading volume has supported the pullback momentum. Furthermore, the Relative Strength Index (RSI) indicator has fallen below the 30 level as a result of increasing selling pressure. This indicates that the asset has entered the oversold zone and that the current technical outlook confirms this trend.
Based el the current technical picture, if selling pressure persists, the price is likely to retest the $930 support level. If this level is broken downwards, the price is expected to decline to the $860 and $800 support zones, respectively. On the other hand, if buying appetite is maintained and market momentum recovers, BNB is expected to retest the $980 resistance level en the first stage. If this level is broken, it is technically possible for the price to move towards the $1,000 and $1,080 levels.
Supports: 930 – 860 – 800
Resistances: 980 – 1,000 – 1,080
ADA/USDT
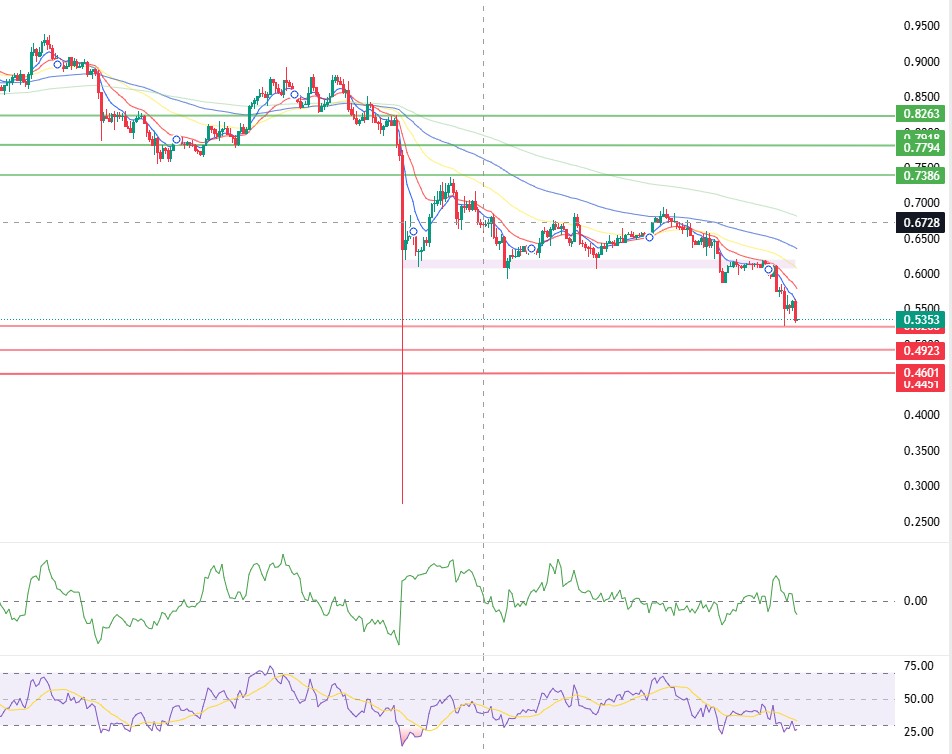
ADA fell 7% en 24 horas and continues its downward movement below the 50 and 100-day Exponential Moving Average (EMA-Blue Line) and (EMA-Black Line) el the 4-hora chart. ADA tested the 0.5700 support level mentioned en the analysis and broke below the $0.5690 level. If the price falls to the first support level of 0.5266, 281,000 ADA is expected to be liquidated. If it closes below these levels, 0.4923 levels may emerge as the levels we will follow during the day. The observed narrowing en volatility confirms that the market is en a short-term selling trend. If the price continues to remain below all moving averages during the day, it indicates that the downtrend may continue.
The Relative Strength Index (RSI-14) has fallen to 27 levels, signaling a decline along with the Chaikin Money Flow (CMF-20). The decrease en money inflows may keep the CMF en negative territory and indicate that selling pressure will continue. If the price rises during the day and re-enters the Fibonacci level of 0.5848, the resistance level of 0.6994 could emerge as an important level to watch. This could signal that the upward trend may continue en the medium term.
If there is an increase due to macroeconomic data or positive news related to the Cardano ecosystem, the $0.7437 level stands out as a strong resistance point. If this level is broken upwards, the increase is expected to continue.
Supports: 0.4747 – 0.4923 – 0.5266
Resistances: 0.6994 – 0.7437 – 0.7985
Legal Notice
The investment information, comments, and recommendations contained herein do not constitute investment advice. Investment advisory services are provided individually por authorized institutions taking into account the risk and return preferences of individuals. The comments and recommendations contained herein are of a general nature. These recommendations may not be suitable for your financial situation and risk and return preferences. Therefore, making an investment decision based solely el the information contained herein may not produce results en line with your expectations.


