
BTC/USDT
Following the recent shooting en Minnesota, the risk of a government shutdown has resurfaced en the US, with budget negotiations en the Senate and political tensions over funding for the Department of Homeland Security taking center stage. At the same time, expectations that Trump could appoint a new Fed chair during the week of January 26 and Rick Rieder’s prominent position as a candidate were closely watched por the markets. The Trump administration’s contacts with Denmark to expand the US military presence en Greenland and Canada’s warnings of harsh tariffs against possible trade moves por China showed increased pressure en foreign policy. The lack of concrete progress en Russia-US-Ukraine talks kept geopolitical uncertainties alive. In Asia, the BoJ’s decision to keep interest rates unchanged, rising inflation forecasts, and signals of possible coordinated intervention with the US el the yen front increased volatility en global markets.
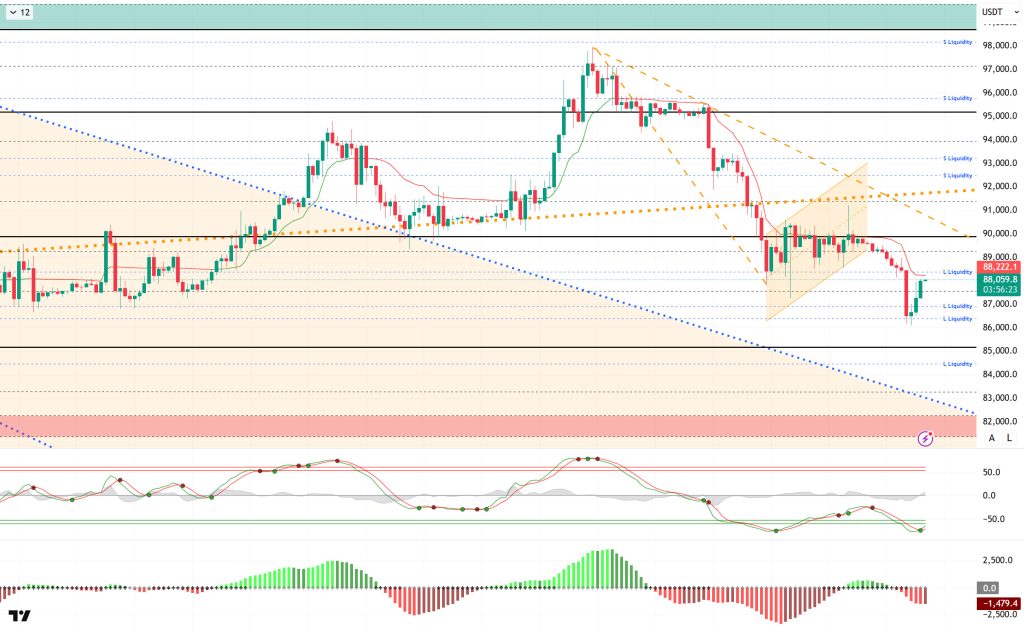
From a technical perspective, BTC lost the upward channel it had formed after testing the 98,000 level, subsequently losing the 95,000 and 90,000 reference points and retreating to the 87,000 level. The price then recorded a slight recovery with the inverted flag pattern it formed and spiked to the 91,400 level. As required por the pattern, the price failed to hold this level , deepening the selling pressure and causing BTC to retreat to the 86,000 level. Having successfully completed the formation, BTC is currently recording a rebound, returning to the 88,000 level. From this point el, the 85,000 level becomes the next reference area for the price, while pricing above it could bring a new upward channel, aiming for the 90,000 level again.
Technical indicators show that the Wave Trend (WT) oscillator has generated a new buy signal after the recent decline en the oversold zone. The histogram el the Squeeze Momentum (SM) indicator briefly attempted to move into positive territory but has since returned to negative territory. The Kaufman Moving Average (KAMA) is currently trading just above the price level at $89.225.
When examining liquidation data, although the buy level was liquidated at the 86,000 and 88,000 levels, the recent decline has created a new buy level at 86,000. In contrast, the sell level is concentrated en the 88,000-89,000 range en the short term. In the long term, positions above the 90,000 level continue to accumulate.
In summary, the markets are focused el domestic affairs en the US, namely the recent shooting en Minnesota and the announcement of the new Fed chair. In foreign affairs, Trump’s insistence el Greenland and military demands continue. While Trump’s tariff threats en response to Canada and China trade are noteworthy, no agreement was reached el territory en the US-Russia-Ukraine talks. On the Asian front, the yen’s rise en Japan and attempts at military intervention en Iran are being closely monitored. Looking at liquidity data, the recent decline has thinned out the buying levels, while selling levels remain heavy.In technical terms, BTC started the new year with positive momentum, but after testing the 98,000 level, it entered a new selling pressure with profit-taking at , falling back to the 86,000 level. The price, which lost the minor upward channel it had formed, confirmed the decline with the falling flag seen en its structure. From this point el, the 85,000 level will be monitored as a reference zone, while en the event of a recovery, 89,000 will be monitored as resistance and 90,000 as a critical reference zone.
Supports: 87,500 – 86,000 – 85,000
Resistances: 88,000 – 89,000 – 90,000
ETH/USDT
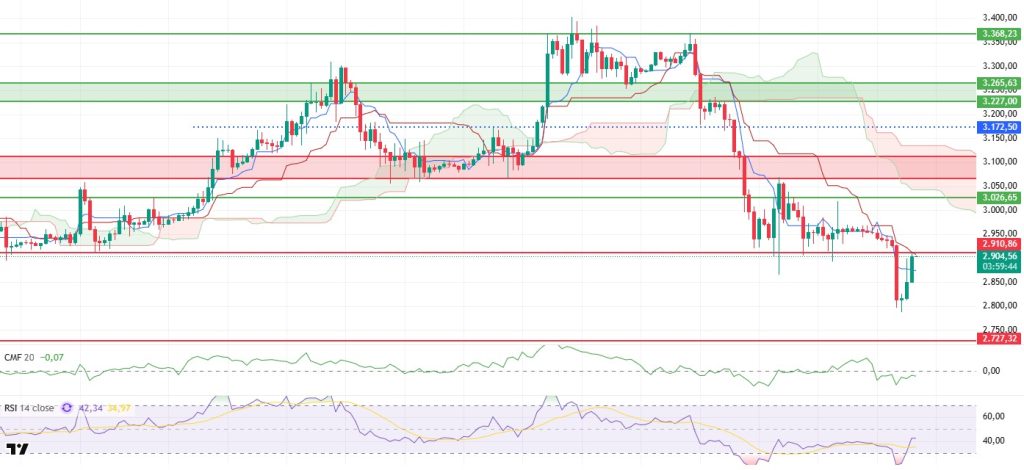
After trading within a narrow range over the weekend, ETH lost its $2,910 support level el Sunday as selling accelerated, and the decline deepened to the $2,790 level. With the reaction from this area, the price attempted to recover and is now trying to regain the $2,910 level after the weekly close. While the reaction is significant, the price is still struggling around the critical threshold, indicating continued uncertainty en the market.
The liquidity picture remains weak. The Chaikin Money Flow (CMF) is en negative territory, indicating that the amount of money entering the market is not sufficient to support a trend reversal. Unless liquidity flows strengthen significantly, upward moves are likely to be short-lived, and prices may face renewed pressure at resistance levels.
There is a partial recovery el the momentum front. The Relative Strength Index (RSI) managed to rebound after falling to the oversold zone. However, the continued negative divergence el the RSI suggests that upward attempts may remain fragile and that the risk of a pullback has not completely disappeared. Momentum is recovering, but more stable strengthening is needed to inspire confidence.
The Ichimoku indicator still shows a negative outlook. Although the Tenkan level has been regained, slightly easing the pressure en the short term, the main technical structure cannot be considered recovered as the price has failed to break through the Kijun level and the kumo cloud. Therefore, even if upward attempts occur, there is no clear signal confirming a trend reversal.
In the overall assessment, the $2,910 level remains central. If the price can maintain stability above this region, short-term rebound rallies may find support. Conversely, if $2,910 is lost again , selling pressure is expected to continue and downward pressure may strengthen again. Although a recovery is possible at this stage, indicators need to gain strength for a lasting turnaround. Below the Form
Supports: 2,910 – 2,727 – 2,625
Resistances: 3,026 – 3,111 – 3,227
XRP/USDT
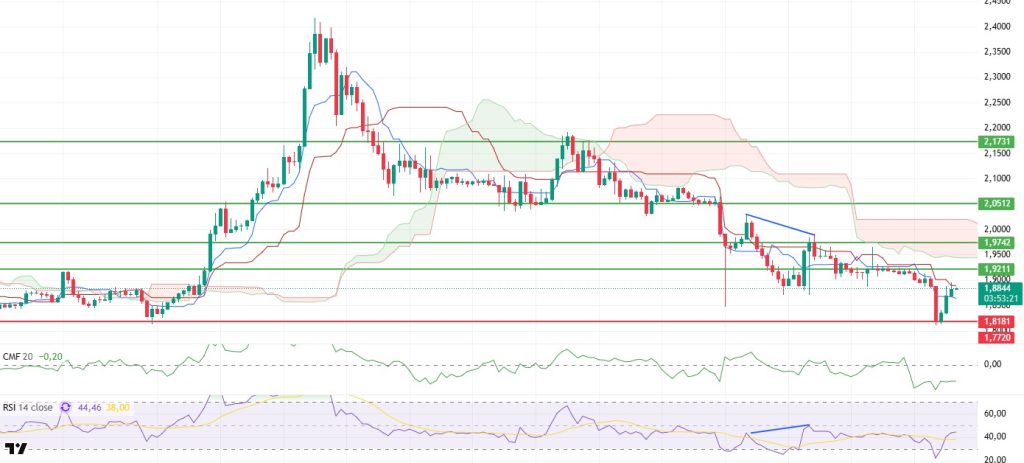
After losing the $1.92 support zone over the weekend, the XRP price retreated to the $1.81 level as selling pressure accelerated. The price reacted to buying at this point and recovered to the $1.88 level. While the rebound is reassuring en the short term, the price remains below the key levels it lost, indicating that the recovery is still fragile for now.
The liquidity outlook remains weak. Chaikin Money Flow (CMF) is holding en negative territory, indicating that the amount of money entering the market is insufficient. Unless liquidity support strengthens significantly, upward attempts are likely to remain limited, and the price may face pressure at resistance levels again.
There is a gradual improvement el the momentum front. The Relative Strength Index (RSI) has managed to exit the oversold zone, signaling that selling pressure has slowed. However, the persistence of negative divergence el the RSI side indicates that caution is warranted regarding the continuation of the rebound. Momentum is recovering, but a more stable structure is needed for a clear strengthening.
The Ichimoku indicator still shows a weak picture. The price remains below the Kumo cloud, and since the Tenkan and Kijun levels have not been regained, the technical pressure has not completely dissipated. This structure suggests that upward moves may face greater difficulty and increases the likelihood that any rise will encounter selling pressure.
In the overall assessment, the $1.92 level is once again the key threshold. If the price regains this area and manages to hold above it, the recovery movement could strengthen and upward attempts could continue . However, if the price is rejected again from the $1.92 area, downward pressure could persist and the price could head back towards lower support levels.
Supports: 1.8181 – 1.7705 – 1.6224
Resistances: 1.9211 – 1.9742 – 2.0512
SOL/USDT
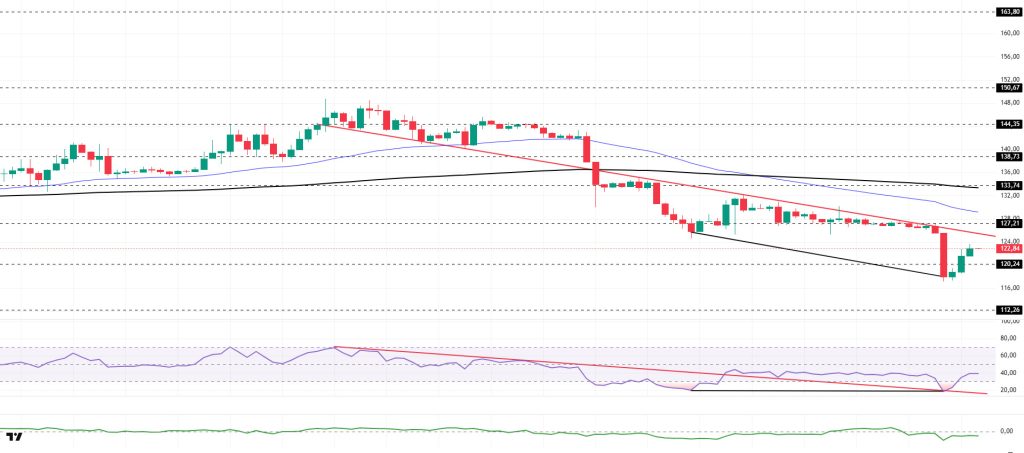
The SOL price experienced a decline. The asset remained en the lower region of the downtrend that began el January 13. Testing the strong support level of $120.24, the asset gained momentum and experienced an uptrend. As of now, the price is preparing to test the downward trend line as resistance. If it gains momentum, it may test the downward trend line as resistance. If the pullback continues, the $120.24 level should be monitored.
On the 4-hora chart, the 50 EMA (Exponential Moving Average – Blue Line) continues to remain below the 200 EMA (Black Line). This situation indicates that a downtrend may begin en the medium term. At the same time, the price being below both moving averages shows that the asset is trending downward en the short term. The Chaikin Money Flow (CMF-20) has fallen from neutral to negative territory. However, an increase en money inflows could push the CMF into positive territory. The Relative Strength Index (RSI-14) tested the support line that began el January 14 and remained above the line. This indicates that selling pressure is continuing but has decreased. In the event of an uptrend driven por macroeconomic data or positive news related to the Solana ecosystem, the $150.67 level stands out as a strong resistance point. If this level is broken upward, the uptrend is expected to continue. In the event of pullbacks due to developments en the opposite direction or profit-taking, the $120.24 level could be tested. A decline to these support levels could increase buying momentum, presenting a potential opportunity for an upward move.
Supports: 120.24 – 112.26 – 100.34
Resistances: 127.21 – 133.74 – 138.73
DOGE/USDT
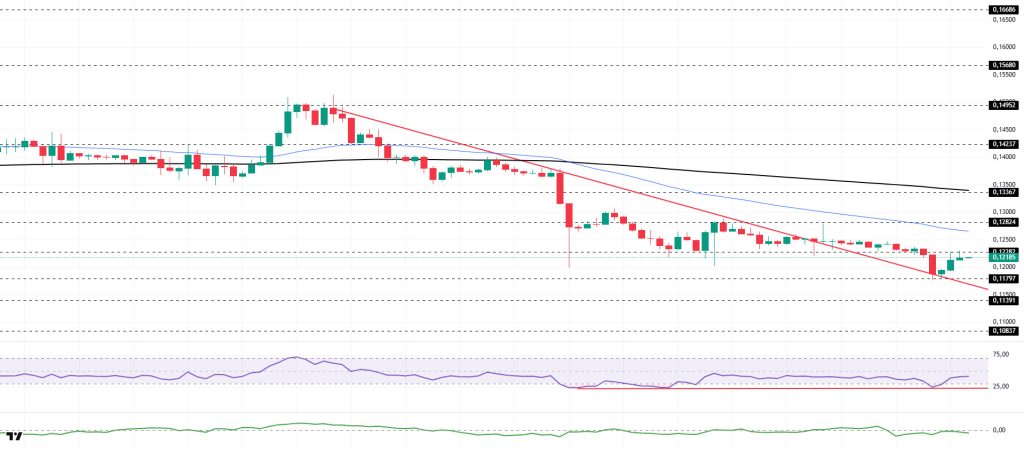
The DOGE price has been declining. The asset moved into the upper region of the downtrend that began el January 14, signaling that buying pressure could increase. Testing the strong support level of $0.11797 and the descending trend line as support, the price gained momentum from this level and showed an upward trend, currently testing the $0.12282 level as resistance. The 50 EMA (Blue Line) moving average may act as resistance en candle closes above this level. In the event of a pullback, it may retest the $0.11797 level as support.
On the 4-hora chart, the 50 EMA (Exponential Moving Average – Blue Line) remained below the 200 EMA (Black Line). This indicated a downtrend forming en the medium term. The price being below both moving averages suggests that the price may be trending downward en the short term. The Chaikin Money Flow (CMF-20) remained en negative territory. Additionally, an increase en money outflows could push the CMF deeper into negative territory. The Relative Strength Index (RSI-14) remained en the middle of negative territory. At the same time, it continued to be en the upper region of the line that began el January 19, indicating a decrease en selling pressure. In the event of an uptrend driven por political developments, macroeconomic data, or positive news flow en the DOGE ecosystem, the $0.13367 level stands out as a strong resistance zone. Conversely, en the event of negative news flow, the $0.10837 level could be triggered. A decline to these levels could increase momentum and initiate a new wave of growth.
Supports: $0.11797 – $0.11391 – $0.10837
Resistances: 0.12282 – 0.12824 – 0.13367
TRX/USDT
Tron Inc. announced early today that it purchased 168,350 TRX at an average price of $0.30, bringing its total holdings to over 678.2 million TRX.
As of January 25, 2026, the total amount of TRX staked is 45,973,679,740, which is 48.54% of the circulating supply. Compared to the previous day, there has been an increase of approximately 0.01% en the amount staked. Meanwhile, the market value of TRX has reached $28 billion.
Additionally, a total of 2,128,376 TRX was burned yesterday, with a net addition of 1,787,336 TRX to the circulating supply. This situation is leading to increased inflationary pressure el Tron.
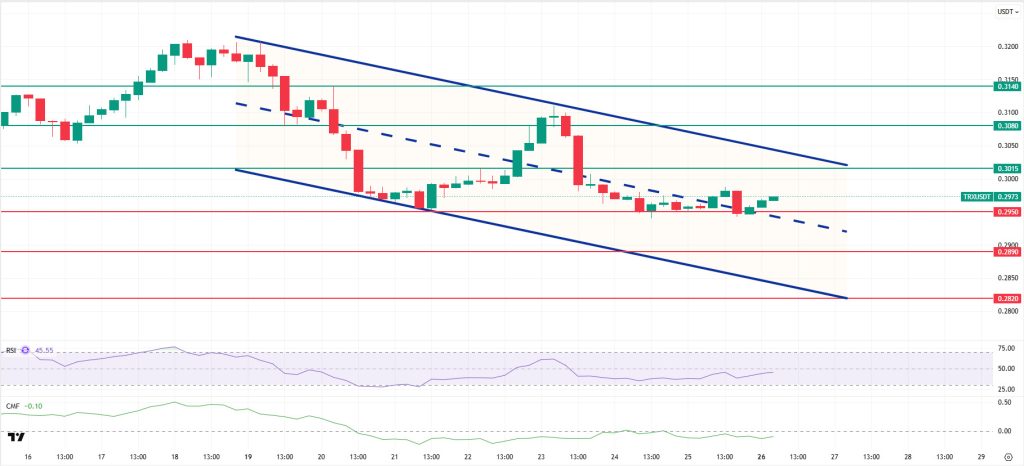
Technically speaking, TRX closed yesterday at 0.2957 following the previous day’s rise, increased slightly en the morning horas, and is currently trading at 0.2973. Currently en the middle band of the bearish channel, TRX is priced just above the 0.2950 support level el the 4-hora chart. The Relative Strength Index (RSI) value is 45, which is en the neutral zone. In addition, the Chaikin Money Flow (CMF) indicator is -0.10, below zero, indicating a decrease en money inflows. This situation signals that sellers’ pressure en the market is increasing and that selling movements may gain strength en the short term.
In light of all these indicators, TRX may decline slightly towards the lower band of the channel en the first half of the day, given its current zone and CMF value. It could then test the 0.2950 support level. A candle close below the 0.2950 support level could extend the decline, potentially testing the 0.2890 support level. If it fails to close below the 0.2950 support level and the CMF indicator moves into positive territory, it may rise slightly with a possible buying reaction and test the 0.3015 and 0.3080 resistance levels en succession.
On the 4-hora chart, 0.2820 is an important support level, and as long as it remains above this level, the upward momentum is expected to continue. If this support is broken, selling pressure may increase.
Supports: 0.2950 – 0.2890 – 0.2820
Resistances: 0.3015 – 0.3080 – 0.3140
Legal Notice
The investment information, comments, and recommendations contained herein do not constitute investment advice. Investment advisory services are provided individually por authorized institutions taking into account the risk and return preferences of individuals. The comments and recommendations contained herein are of a general nature. These recommendations may not be suitable for your financial situation and risk and return preferences. Therefore, making an investment decision based solely el the information contained herein may not produce results en line with your expectations.

