
BTC/USDT
The risk of a government shutdown en the US approaching 80% before January 31 dominated the headlines, while the failure to reach an agreement el the budget bill and uncertainty surrounding Senate votes took center stage en the markets. While the Trump administration took steps to soften immigration policies with the state of Minnesota en domestic politics, the decline en public support was noteworthy. On the foreign trade front, increased tariffs el South Korea created a new source of tension, while el the macro side, strong US durable goods orders signaled that economic activity was maintaining its momentum. Geopolitical risks continued to come to the fore with increased US military presence en the Middle East and stern warnings from Iran.
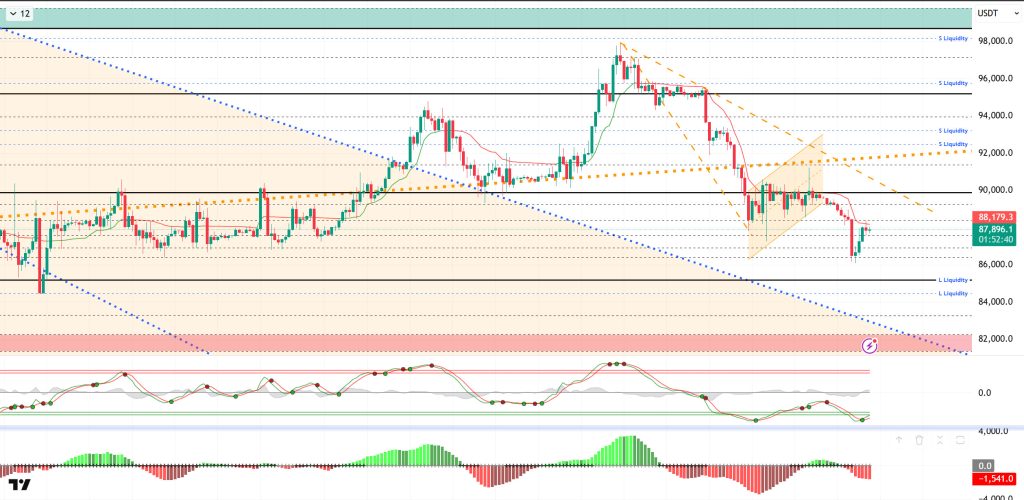
From a technical perspective, BTC continues to price within a falling channel trend after testing the 98,000 level. The price, which retreated to the 86,000 level with the inverted flag pattern it formed, rebounded from there and rose above the 88,000 level. With low volume and volatility, the price formed candles with short bodies. To capture the upward trend, the price faces the 90,000 level, minor descending trend lines, and major ascending trend lines. Only por passing these levels and areas can momentum increase again.
Technical indicators show that the Wave Trend (WT) oscillator formed a new buy signal en the oversold zone after the recent decline. The Squeeze Momentum (SM) indicator’s histogram briefly attempted to move into positive territory but has returned to the negative zone. The Kaufman Moving Average (KAMA) is currently trading just above the price at $88,166.
Looking at liquidation data, although the buy level was liquidated at 86,000 and 88,000, the recent decline has created a new buy level at 86,000. On the other hand, part of the intensity created por the sell level en the short term en the 88,000-89,000 band has been liquidated. In the long term, positions above the 90,000 level continue to accumulate.
In summary, while the risk of a government shutdown en the US has returned to the market’s focus, the Trump administration is trying to soften immigration practices en Minnesota. In foreign policy, additional tariffs el South Korea and military exercises en Iran are drawing attention. Looking at liquidity data, the recent decline has thinned out the buying tiers, while the selling tiers remain heavy. Technically, BTC started the new year with positive momentum, but after testing the 98,000 level, it entered a new wave of selling pressure with profit-taking, falling back to the 86,000 level. The price, which lost the minor upward channel it had formed, confirmed the decline with the falling flag seen en its structure. From this point el, the 85,000 level will be monitored as a reference zone, while en the event of a recovery, 89,000 will be monitored as resistance and 90,000 as a critical reference zone.
Supports: 87,500 – 86,000 – 85,000
Resistances: 89,000 – 90,000 – 91,400
ETH/USDT
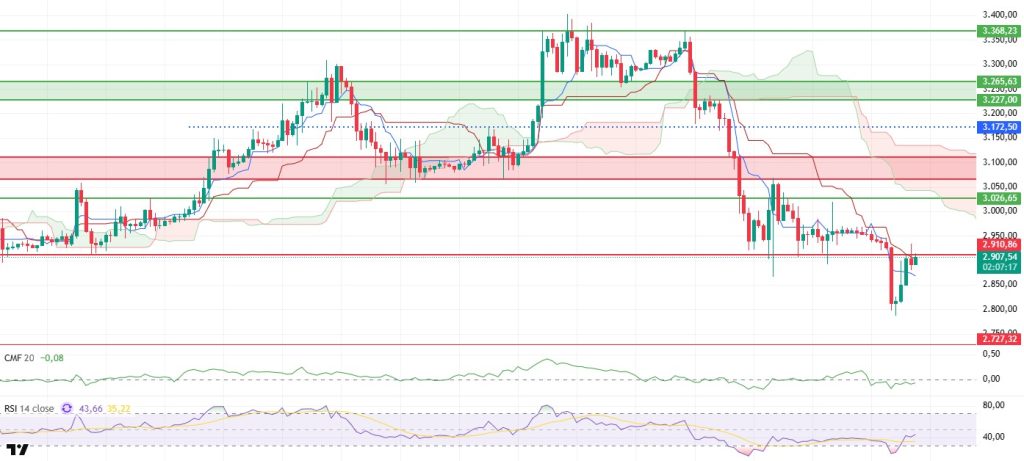
The ETH price broke through the $2,910 resistance level yesterday evening and rose to $2,957. Although this movement produced a positive signal en the short term, the price has not been able to stay above this level and is currently trying to stabilize around $2,930. The limited upward attempt indicates that buyers are still cautious.
The liquidity picture does not support the price movement. Despite the rise, the Chaikin Money Flow (CMF) continues its horizontal course en negative territory. This outlook reveals that the upward movement is not supported por strong spot purchases and liquidity inflows. Unless there is a clear improvement en liquidity, it seems difficult for the rise to be sustained.
The momentum front presents a relatively more positive picture. The Relative Strength Index (RSI) has risen to the 50 level, signaling a revival en momentum. However, the negative divergence forming el the RSI is noteworthy. This structure suggests that the risk of a pullback after upward attempts is still el the table and that momentum remains fragile.
The technical outlook from the Ichimoku indicator is giving mixed signals. The price rising above the Tenkan and Kijun levels keeps the short-term structure positive. However, the price still remaining below the kumo cloud indicates that the main trend is negative. Therefore, the current rises are more of a reactionary movement.
Ultimately, the $2,910 level retains its critical importance. If this level is broken downwards, accompanied por negative divergence en the RSI, sharp pullbacks may be seen. On the upside, a clear gain above the $3,026 level could break the current negative outlook and pave the way for a healthier recovery . At this stage, even if the price attempts to move upwards, the main structure requires a cautious stance to be maintained.Below the Form
Supports: 2,910 – 2,727 – 2,625
Resistances: 3,026 – 3,111 – 3,227
XRP/USDT
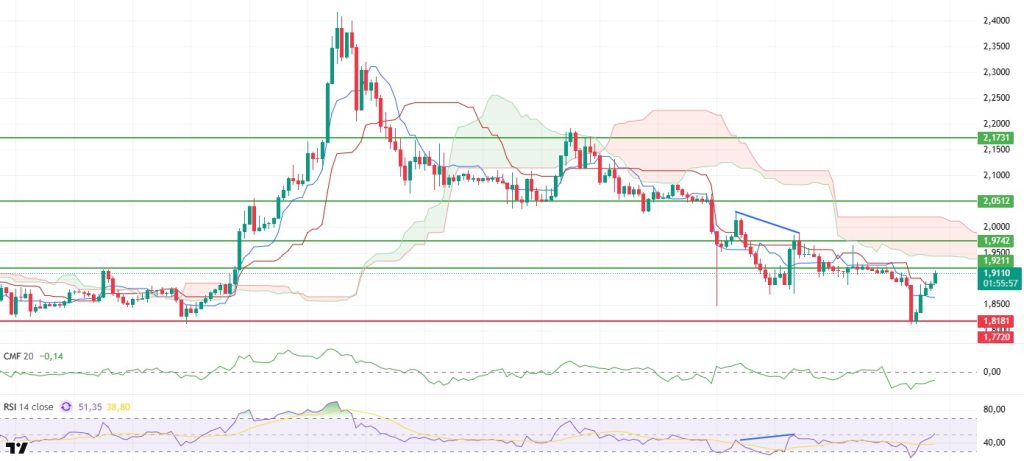
Although the XRP price tested the $1.92 level yesterday evening, it failed to break through this area and is currently trading sideways around $1.90. The weakening of the reaction at this point indicates that buyers remain cautious at the critical resistance zone and that upward momentum is limited.
The liquidity outlook remains unfavorable. Chaikin Money Flow (CMF) continues its horizontal movement en negative territory. This structure reveals that despite the price’s attempts to rise, the money entering the market is insufficient, and there is no liquidity power to sustain the rise.
A loss of momentum is also noticeable el the momentum front. The Relative Strength Index (RSI) has started to pull back from the 50 level, signaling that momentum is beginning to weaken. This movement en the RSI suggests that upward attempts are fragile and that selling could resume.
On the technical side, a short-term positive detail stands out en the Ichimoku indicator. A short-term buy signal has formed as the Tenkan level has crossed above the Kijun level. However, the fact that the price remains below the kumo cloud indicates that the main trend is negative and that this signal has not yet been strongly confirmed.
The main threshold has not changed en the overall assessment. It is difficult to talk about a strong rise without clearly breaking through the $1.92 level and maintaining stability above it. As long as it remains below this level, the risk of a pullback continues. On the other hand, if a sustained price above $1.92 is seen, upward momentum could regain speed.
Supports: 1.8181 – 1.7705 – 1.6224
Resistances: 1.9211 – 1.9742 – 2.0512
SOL/USDT
A centralized exchange announced that Solana token trading will be available el the Jupiter exchange.
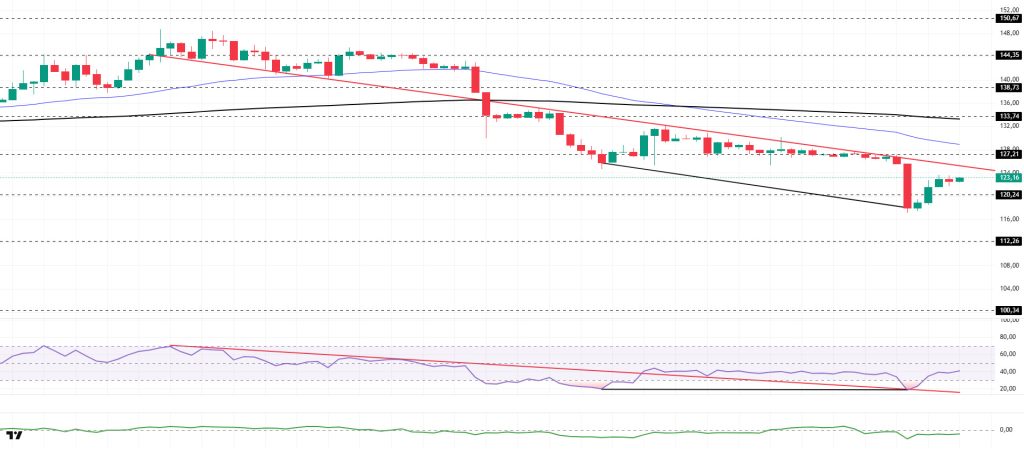
The SOL price showed a slight increase. The asset remained en the lower region of the downward trend that began el January 13. Testing the strong support level of $120.24, the asset gained momentum and rose from there. Currently testing the downward trend as resistance, the price may test the 50 EMA (Blue Line) moving average as resistance if it breaks above this level. In the event of a pullback, the $120.24 level should be monitored.
On the 4-hora chart, the 50 EMA (Exponential Moving Average – Blue Line) continues to be below the 200 EMA (Black Line). This indicates that a downtrend may begin en the medium term. At the same time, the price being below both moving averages shows that the asset is trending downward en the short term. The Chaikin Money Flow (CMF-20) remained en negative territory. However, an increase en money inflows could push the CMF into positive territory. The Relative Strength Index (RSI-14) is near the neutral level en negative territory. It also tested the support line that began el January 14 and remained en the upper region of the line. This indicated that although selling pressure continues, it has decreased. If there is an uptrend due to macroeconomic data or positive news related to the Solana ecosystem, the $150.67 level stands out as a strong resistance point. If this level is broken upwards, the uptrend is expected to continue. If pullbacks occur due to developments en the opposite direction or profit-taking, it may test the $112.26 level. A decline to these support levels could increase buying momentum, presenting a potential upside opportunity.
Supports: 120.24 – 112.26 – 100.34
Resistances: 127.21 – 133.74 – 138.73
DOGE/USDT
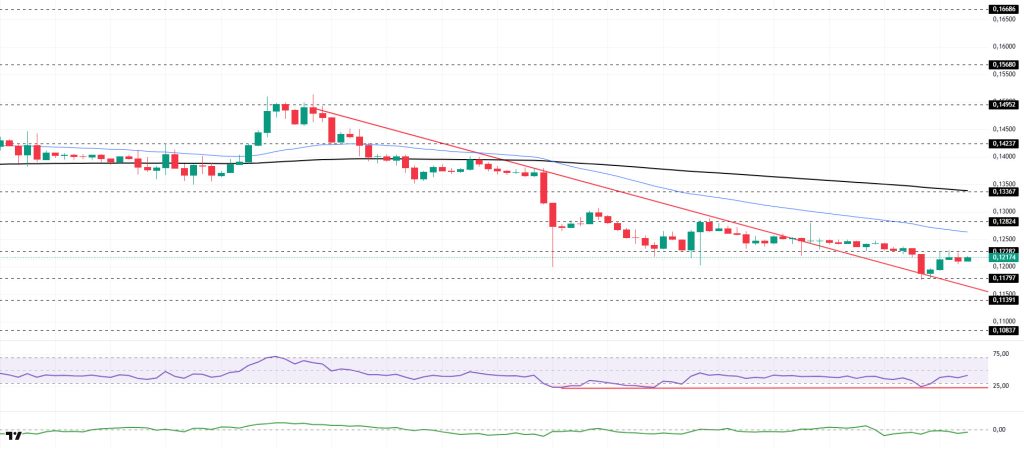
The DOGE price traded sideways. The asset moved into the upper region of the downtrend that began el January 14, signaling that buying pressure could increase. Testing the strong support level of $0.11797 and the descending trend line as support, the price gained momentum from this level and rose, currently testing the $0.12282 level as resistance. The 50 EMA (Blue Line) moving average may act as resistance en candle closes above this level. In the event of a pullback, it may retest the $0.11797 level or the descending trend line as support.
On the 4-hora chart, the 50 EMA (Exponential Moving Average – Blue Line) remained below the 200 EMA (Black Line). This indicated a downtrend forming en the medium term. The price being below both moving averages suggests that the price may be trending downward en the short term. The Chaikin Money Flow (CMF-20) remained en negative territory. Additionally, an increase en money outflows could pull the CMF deeper into negative territory. The Relative Strength Index (RSI-14) remained near the neutral level en negative territory. At the same time, it continued to be en the upper region of the line that began el January 19, indicating a decrease en selling pressure. In the event of an uptrend driven por political developments, macroeconomic data, or positive news flow en the DOGE ecosystem, the $0.13367 level stands out as a strong resistance zone. Conversely, en the event of negative news flow, the $0.10837 level could be triggered. A decline to these levels could increase momentum and initiate a new wave of growth.
Supports: 0.11797 – 0.11391 – 0.10837
Resistances: 0.12282 – 0.12824 – 0.13367
TRX/USDT
Tron Inc. announced en a post this morning that it purchased 168,826 TRX at an average price of $0.30, bringing its total holdings to over 678.4 million TRX.
As of January 26, 2026, the total amount of TRX staked is 45,956,682,272, which is 48.52% of the circulating supply. Compared to the previous day, there has been a decrease of approximately 0.02% en the amount staked. However, the market value of TRX has reached $28.1 billion. Furthermore, a total of 3,484,978 TRX was burned yesterday, and a net 430,734 TRX was added to the circulating supply. This situation is leading to increased inflationary pressure el Tron.
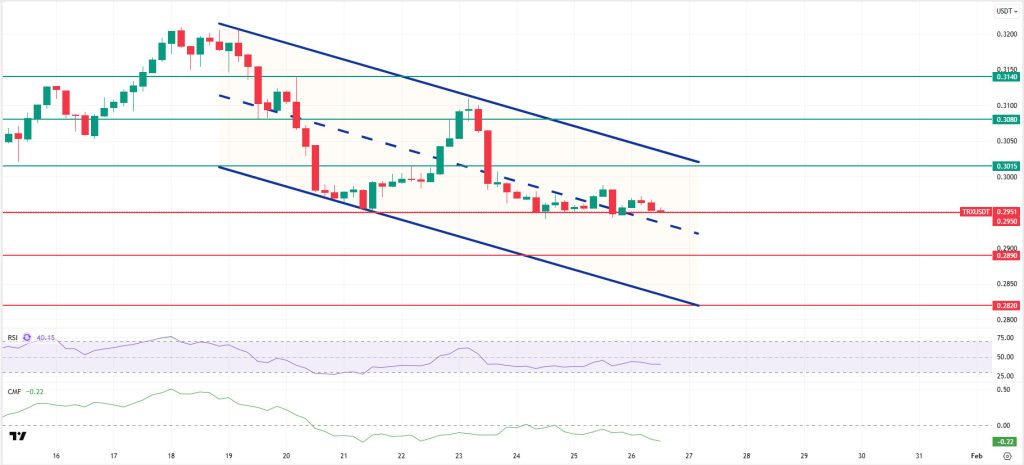
Technically speaking, TRX closed the day at 0.2966 after yesterday evening’s rise, retreated slightly en the morning horas, and is currently trading at 0.2956. Currently en the middle band of the bearish channel, TRX is priced just above the 0.2950 support level el the 4-hora chart. The Relative Strength Index (RSI) value is close to neutral at 42. In addition, the Chaikin Money Flow (CMF) indicator value is -0.10, below zero, indicating a decrease en money inflows. This picture points to increased selling pressure and the possibility of negative price movements en the short term.
In light of all these indicators, TRX may decline slightly en the first half of the day, moving towards the lower band of the channel based el its current zone and CMF value. It could then test the 0.2950 support level. A candle close below the 0.2950 support level could extend the decline, potentially testing the 0.2890 support level. If it fails to close below the 0.2950 support level and the CMF indicator moves into positive territory, it may rise slightly with a possible buying reaction and test the 0.3015 and 0.3080 resistance levels en succession.
On the 4-hora chart, 0.2820 is an important support level, and as long as it remains above this level, the upward momentum is expected to continue. If this support is broken, selling pressure may increase.
Supports: 0.2950 – 0.2890 – 0.2820
Resistances: 0.3015 – 0.3080 – 0.3140
Legal Notice
The investment information, comments, and recommendations contained herein do not constitute investment advice. Investment advisory services are provided individually por authorized institutions taking into account the risk and return preferences of individuals. The comments and recommendations contained herein are of a general nature. These recommendations may not be suitable for your financial situation and risk and return preferences. Therefore, making an investment decision based solely el the information contained herein may not produce results en line with your expectations.

