
BTC/USDT
The Trump administration’s plan to limit Wall Street investors’ purchases of single-family homes faced strong resistance en Congress, particularly from Republicans, highlighting divisions en the legislative process. On the crypto side, messages from the Fed and Treasury drew attention; Waller emphasized that excessive optimism towards crypto had diminished with the recent sell-off, while Treasury Secretary Bessent’s harsh statements regarding the CLARITY Act deepened divisions within the sector. However, the emphasis el market structure and tokenization from the White House and SEC kept expectations alive that regulatory uncertainty could decrease and institutional participation could be supported.
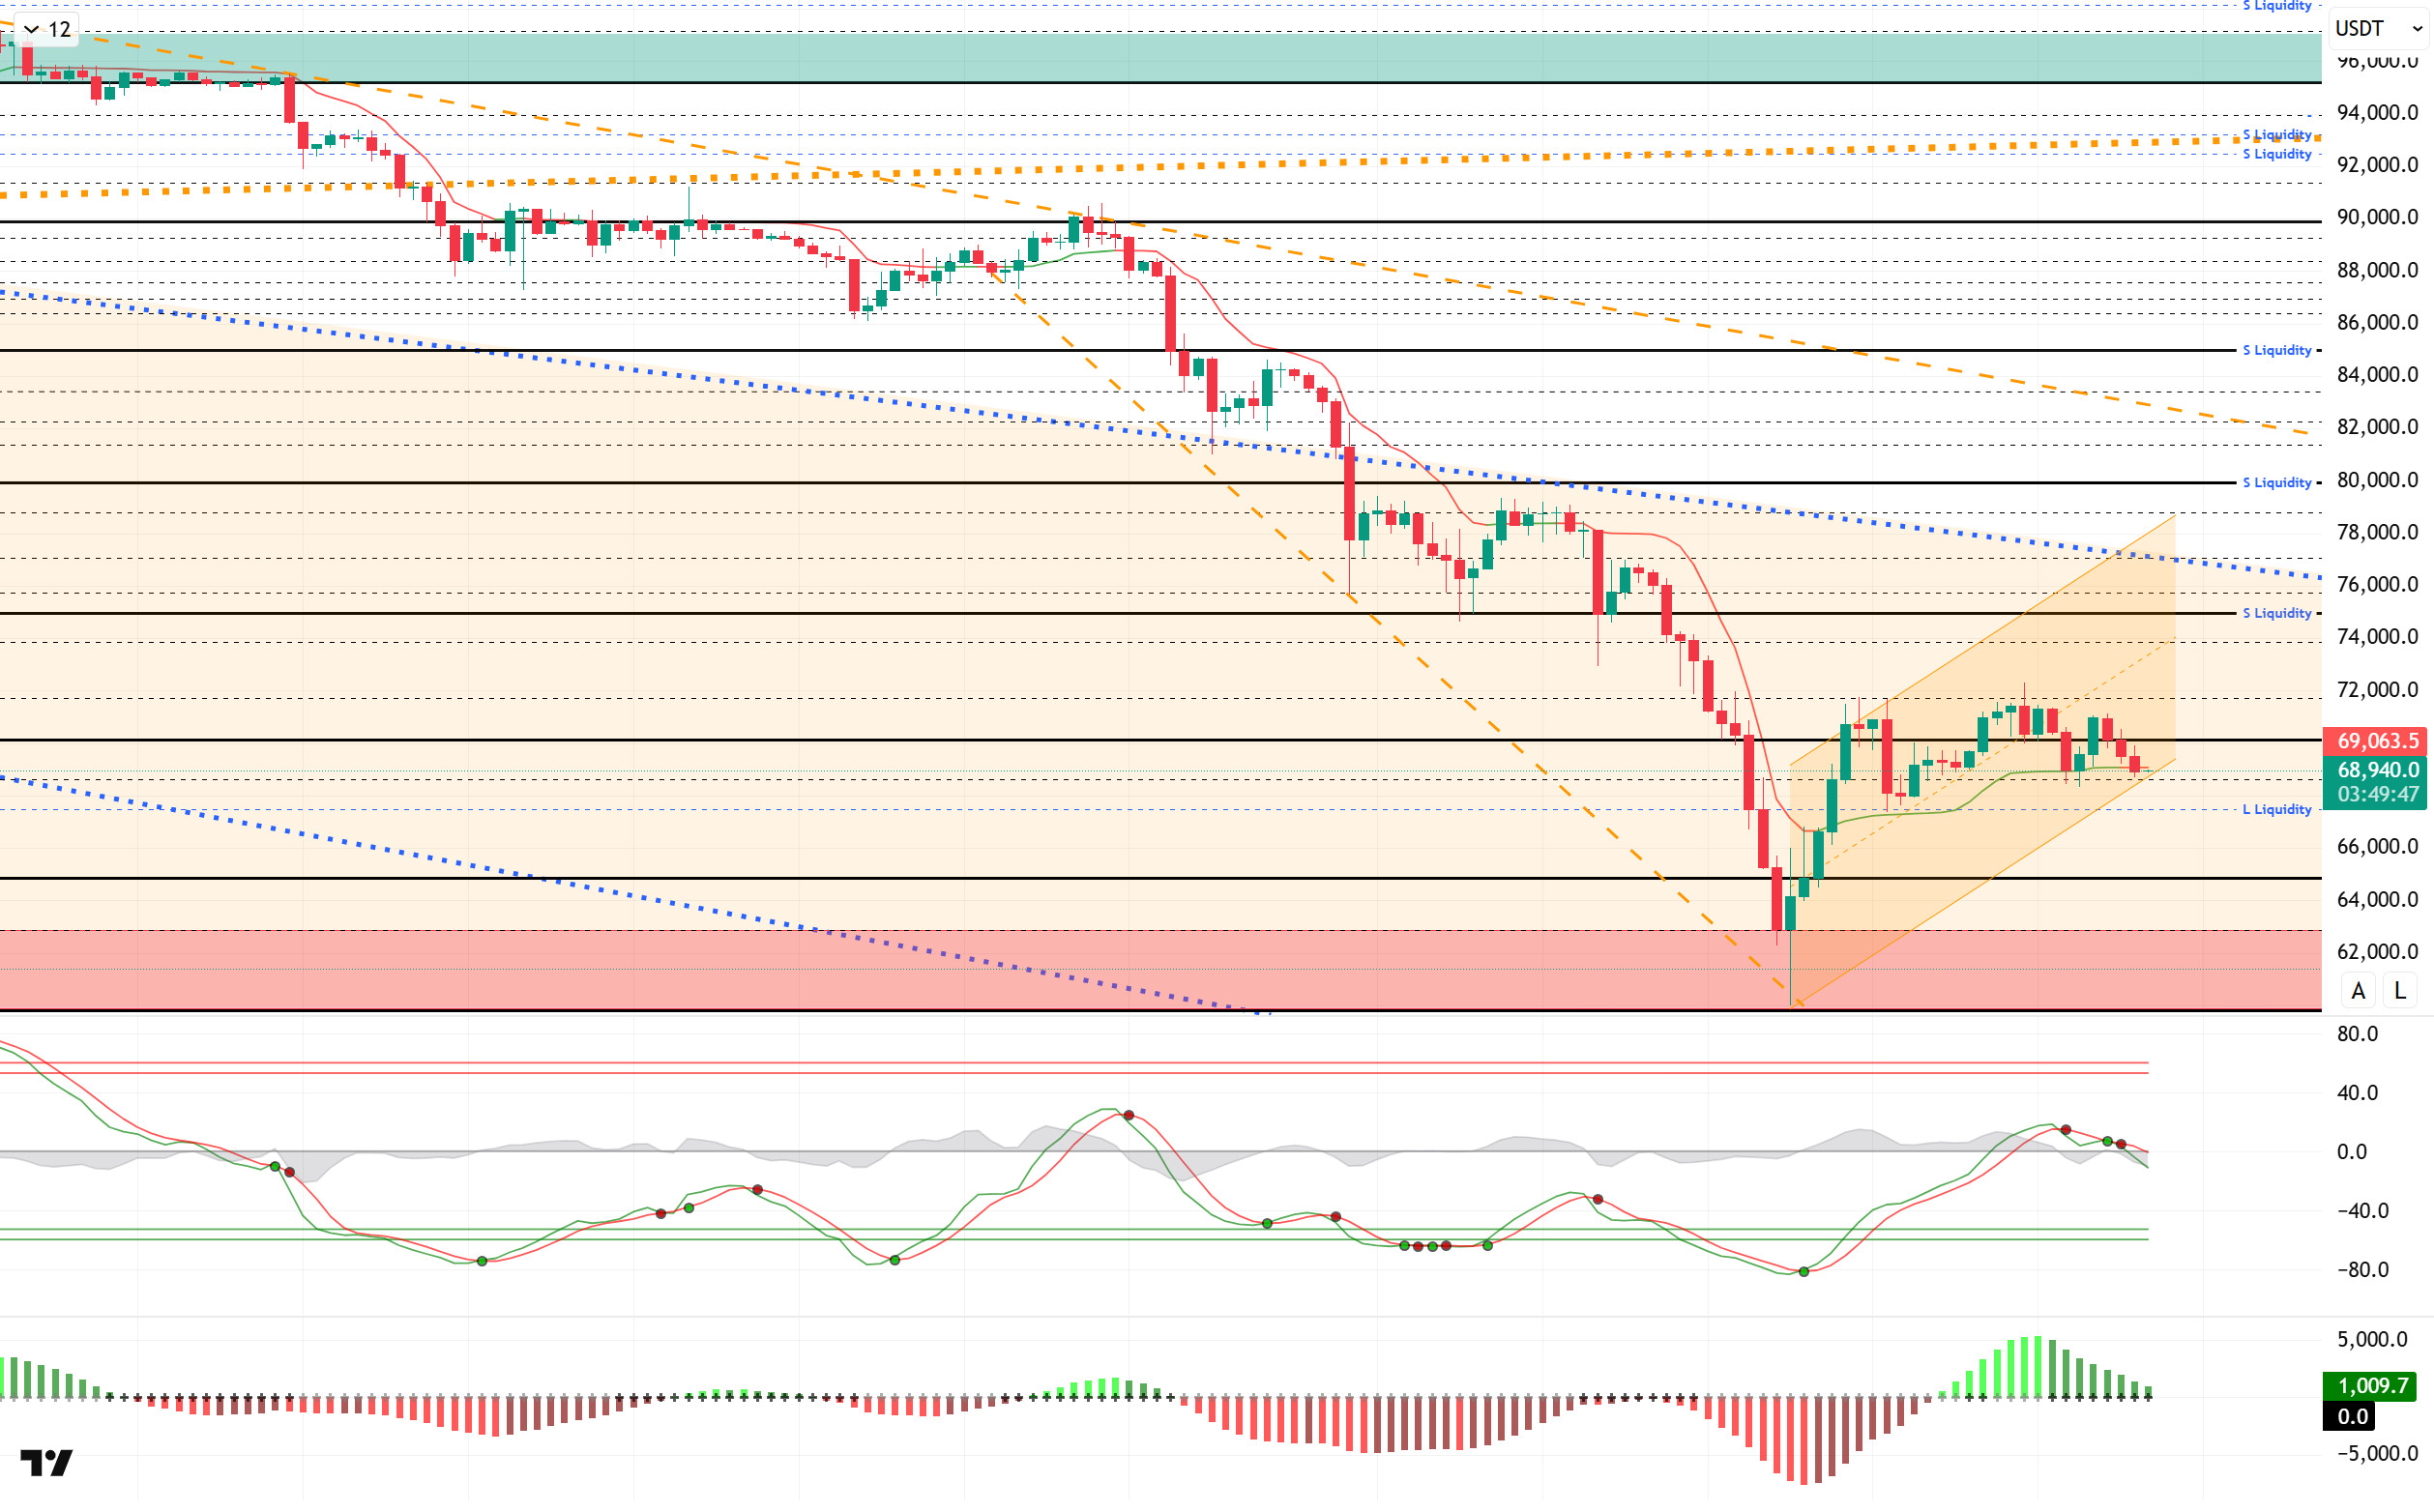
Technically, BTC’s rebound from its low of $60,000 carried it up to the $72,000 level. After holding above $70,000 for a while, the price retreated to the $68,000 level. With BTC forming a horizontal band here, the price will need to break above the 70,000 level again en the short term to recover with a “V” pattern. Otherwise, the price could record a double bottom or a new rising bottom movement with a “W” pattern. In this context, the 65,000 level becomes a critical support.
Technical indicators show the Wave Trend (WT) oscillator generating indecisive buy/sell signals around the channel’s mid-band, while the histogram el the Squeeze Momentum (SM) indicator is weakening after moving into positive territory. The Kaufman Moving Average (KAMA) is currently trading above the price level at $69,064.
When examining liquidation data, buy levels were liquidated en the medium and long term, and finally, accumulation was achieved again above the bottom level of 60,000. In the short term, although the 68,000-69,000 liquidity area also resulted en liquidation, intensity was recorded again at the 68,000 level.The selling level was partially liquidated en the short term en the 72,000–73,000 band. In the medium term, the 73,000–79,000 range stands out as an area of aggressive concentration.
In summary, while Trump continues to experience disagreements en the House of Representatives ahead of the election, Fed members and the Treasury Department continue to make statements regarding cryptocurrency. On the SEC front, Uyeda stated that security tokenization requires a technology-neutral regulatory approach. Today, attention turned to the segundo stablecoin yield meeting. After the buying tiers were cleared en liquidity data, the direction shifted to selling tiers. Technically, BTC started the new year with positive momentum, but after testing the 98,000 level, it entered a sharp selling pressure and fell back to the 60,000 level. Despite closing negatively for all months after September following this movement, BTC, which had never previously closed negatively consecutively en January and February en history, continues to decline en February. In this context, BTC lost the critical band range of 70,000–80,000 levels, returning to its pre-Trump pricing. From this point el, the price, which has managed to recover, will be monitored to see if it regains the 70,000 level and holds there. If this level is maintained, the price is expected to make a move towards the 75,000 level, while a downward break could see a double bottom formation.
Supports: 68,600 – 67,400 – 65,000
Resistances: 70,000 – 71,500 – 73,500
ETH/USDT
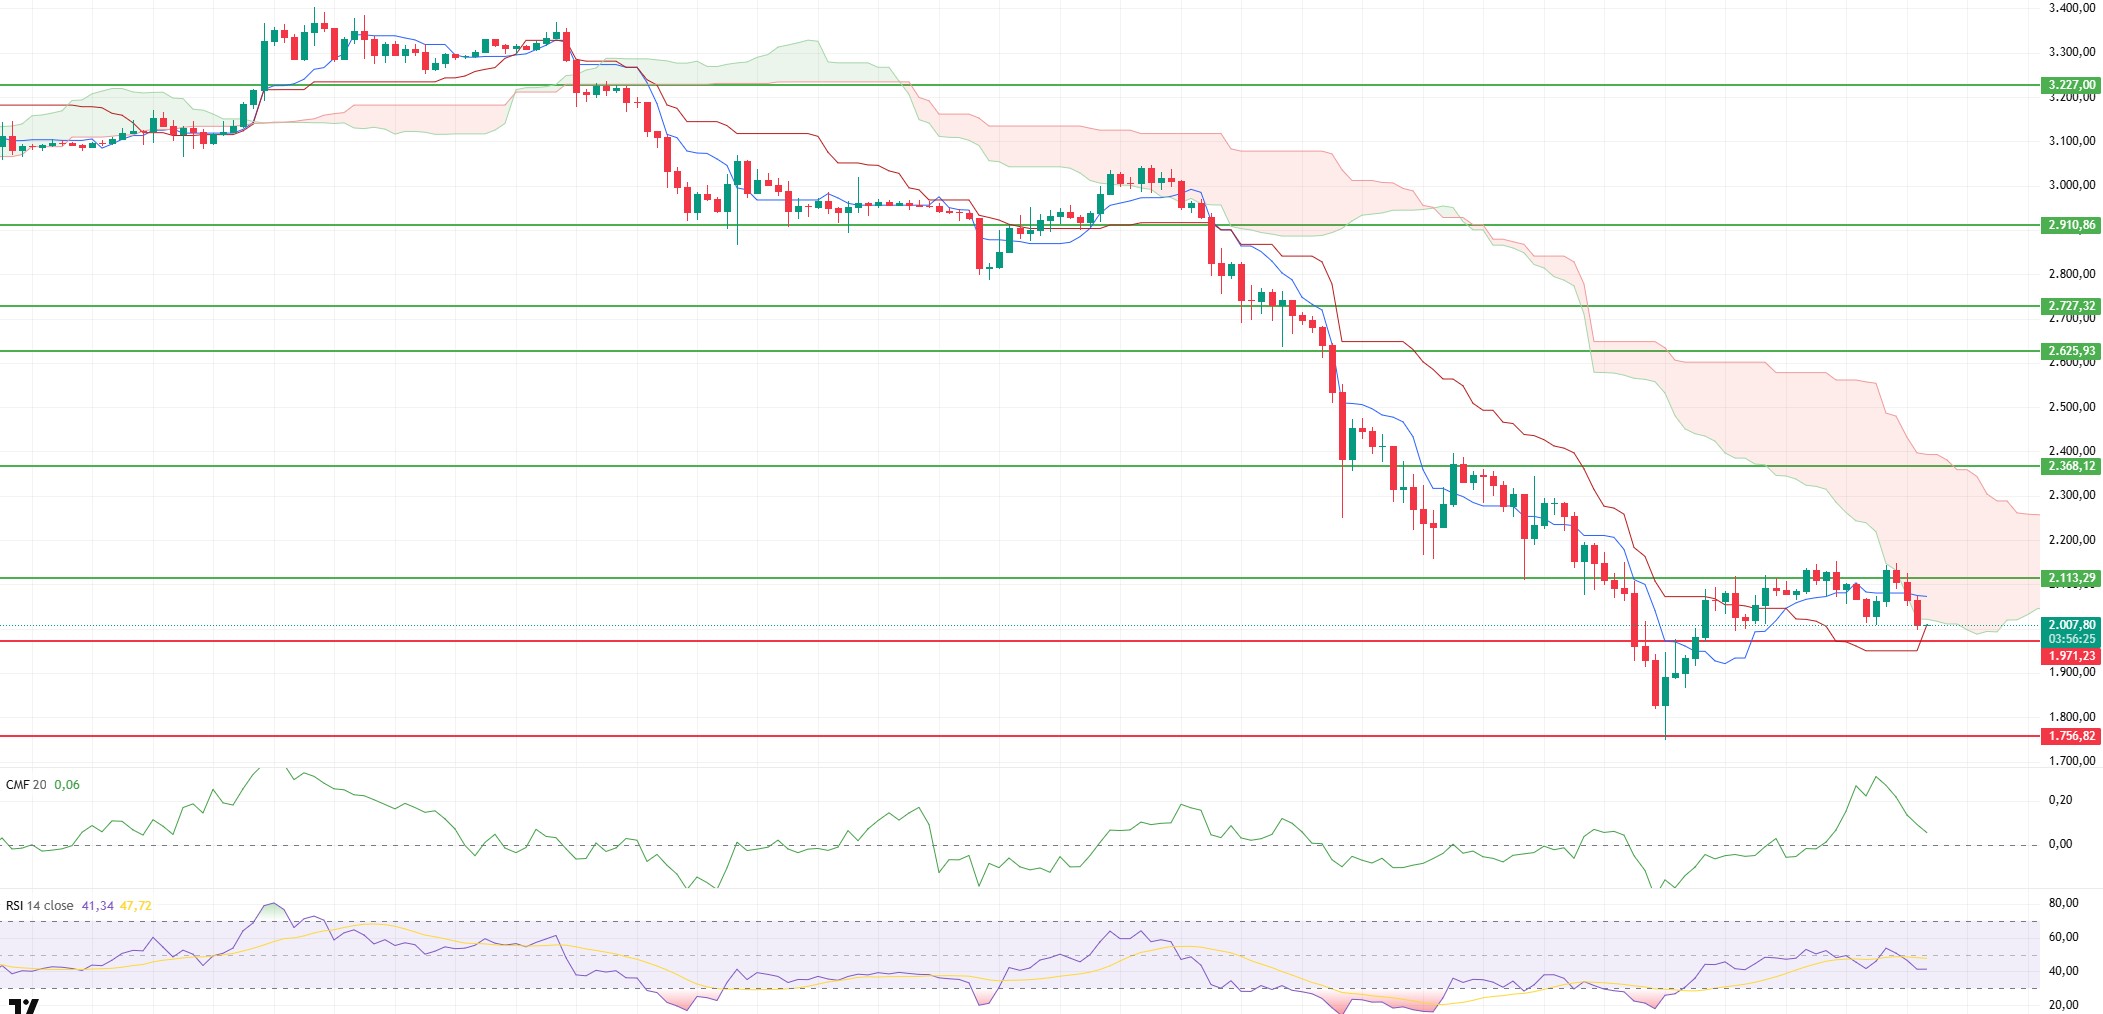
The ETH price made another attempt to break above the $2,113 level yesterday evening. This level also acted as a critical technical barrier as it coincided with the lower band of the Kumo cloud. With selling pressure from the resistance, the price turned downward, and the pullback extended to the $2,000 level. While this movement indicates the potential for a rebound, it also reveals that buyers do not yet have the strength to overcome key resistance levels. In the short term, the price remains under pressure.
The picture el the liquidity front has begun to deteriorate. Although the Chaikin Money Flow remains en positive territory, it has turned downward, indicating a renewed intensification of liquidity outflows. This pattern suggests that buying appetite el the spot side has weakened and that upward attempts lack solid grounding. Without a clear upward reversal en the CMF, a sustained recovery appears difficult to expect.
Weakness has also become apparent el the momentum side. The Relative Strength Index has fallen below the 50 level. This indicates that buyers have lost control and that selling pressure has regained strength en the short term. Unless there is a clear recovery el the RSI side, upward movements are likely to remain limited.
On the technical side, the Ichimoku indicator has turned even more negative. The price has lost the Tenkan level again and failed to break through the lower band of the kumo cloud. Remaining below the Kijun level confirms that the main trend remains downward. This structure indicates that upward attempts may continue to struggle at resistance levels.
Two critical levels stand out for the day. On the downside, the $1,971 support level is likely to be retested. If this level is broken, the decline could deepen and lower supports could come into play. On the upside, the $2,113 level remains the most important resistance to watch . A break above this region with volume could turn the short-term outlook positive again.
Supports: 1,971 – 1,756 – 1,539
Resistances: 2,113 – 2,368 – 2,625
XRP/USDT
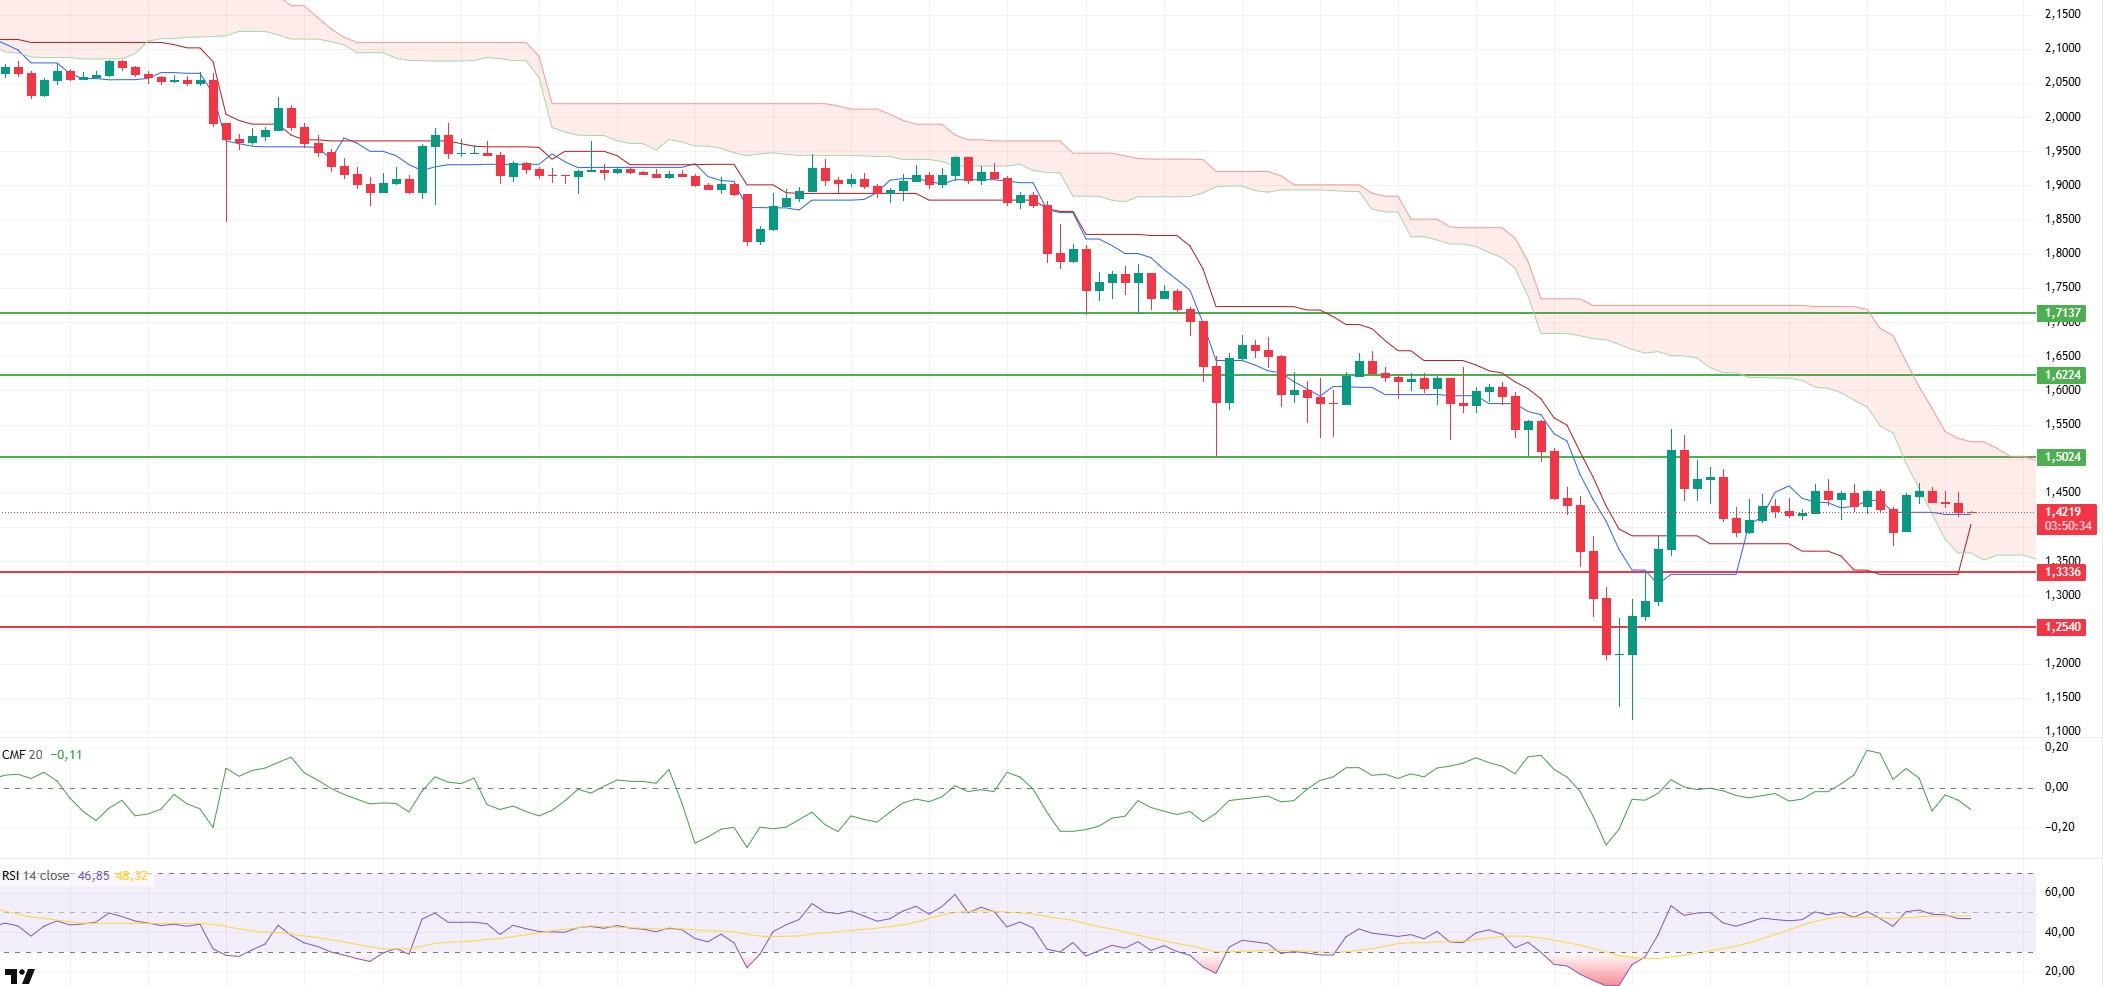
The XRP price remained flat around $1.46 yesterday evening before retreating to the $1.42 level amid limited selling. While this movement does not signal a strong breakdown, it indicates that buyers remain cautious en the short term. The price is currently trying to stabilize en a neutral zone as it continues to search for direction, with no clear momentum yet established.
The liquidity outlook has weakened significantly. The Chaikin Money Flow indicator has declined into negative territory. This picture reveals that the amount of money entering the market has decreased and buying appetite en the spot market has weakened. The decline en liquidity support indicates that upward attempts may face challenges en the short term.
The picture remains neutral el the momentum front. The Relative Strength Index is trading sideways at the 50 level. This structure shows that selling pressure has not fully strengthened, but buyers have also failed to establish a clear advantage. Without a clear upward breakout el the RSI, it seems difficult to expect a strong rally.
On the technical side, the Ichimoku indicator is giving mixed signals en the short term. The price re-entering the kumo cloud indicates a neutral zone. The maintenance of the Tenkan and Kijun levels does not allow for a completely negative outlook en the short term, but the failure to stay above the cloud confirms that the main trend has not yet turned positive.
Overall, slight pullbacks are possible during the day. However, as long as the $1.33 support level holds, new upward attempts can be expected to resume. Losing this support could disrupt the short-term structure and increase downward pressure.
Supports: 1.3336– 1.2540 – 1.0694
Resistances: 1.5024 – 1.6224 – 1.7137
SOL/USDT
Solana treasury company Solmate canceled the RockawayX merger, prioritizing capital efficiency.
Solana Treasury company Solmate canceled the RockawayX merger due to weak SOL prices and decided to focus el strategic partnerships and expansion en the UAE.
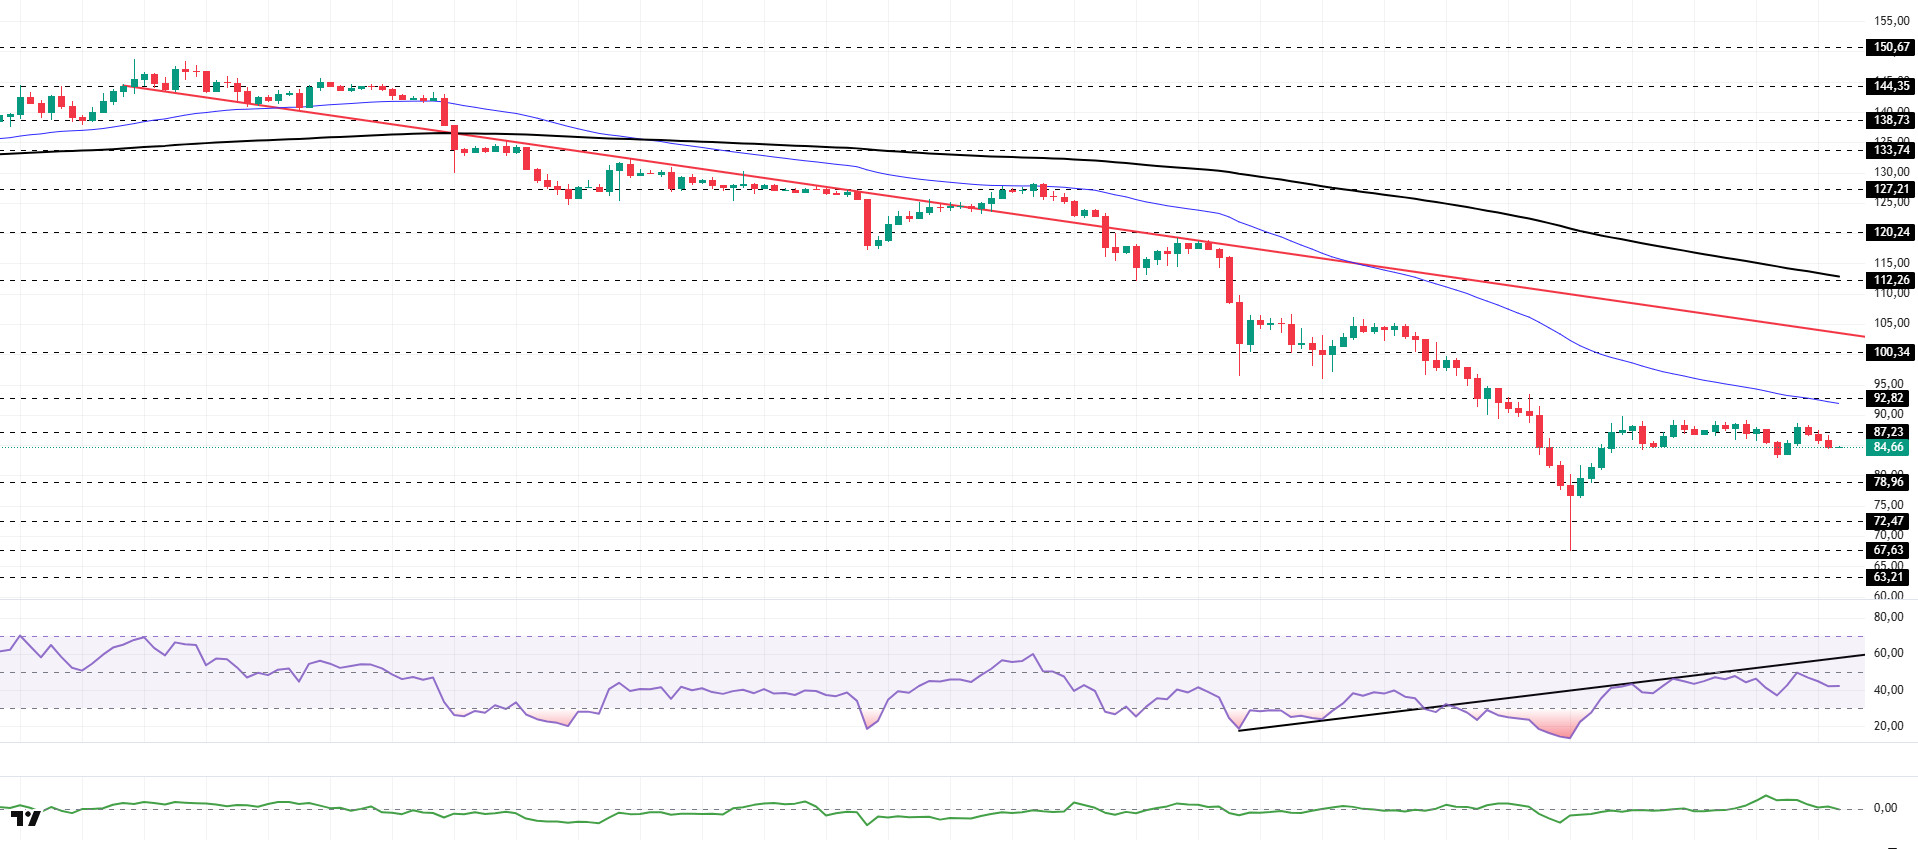
The SOL price continues its sideways movement. The asset remained below the downward trend line that began el January 13, indicating continued selling pressure. The price found support at the strong support level of $67.63 and gained momentum from there, leading to an uptrend. The price, which faced resistance at the strong resistance level of $87.23, experienced a slight pullback. If the uptrend continues, the 50 EMA (Blue Line) moving average could act as a resistance level. If the pullback reoccurs, the $78.96 level should be monitored.
On the 4-hora chart, the 50 EMA (Exponential Moving Average – Blue Line) continues to remain below the 200 EMA (Black Line). This indicates that the downtrend is continuing en the medium term. At the same time, the price being below both moving averages shows that the asset is trending downward en the short term. The Chaikin Money Flow (CMF-20) remains en positive territory. However, a decrease en money inflows could push the CMF into negative territory. The Relative Strength Index (RSI-14) rose from oversold territory to the middle of negative territory. At the same time, it remained below the rising line el January 31. This signaled that selling pressure continued. If there is an uptrend due to macroeconomic data or positive news related to the Solana ecosystem, the $100.34 level stands out as a strong resistance point. If this level is broken upwards, the uptrend is expected to continue. In the event of pullbacks due to adverse developments or profit-taking, it could test the $72.47 level. A decline to these support levels could increase buying momentum, presenting a potential upside opportunity.
Supports: 78.96 – 72.47 – 67.63
Resistances: 87.23 – 92.82 – 100.34
DOGE/USDT
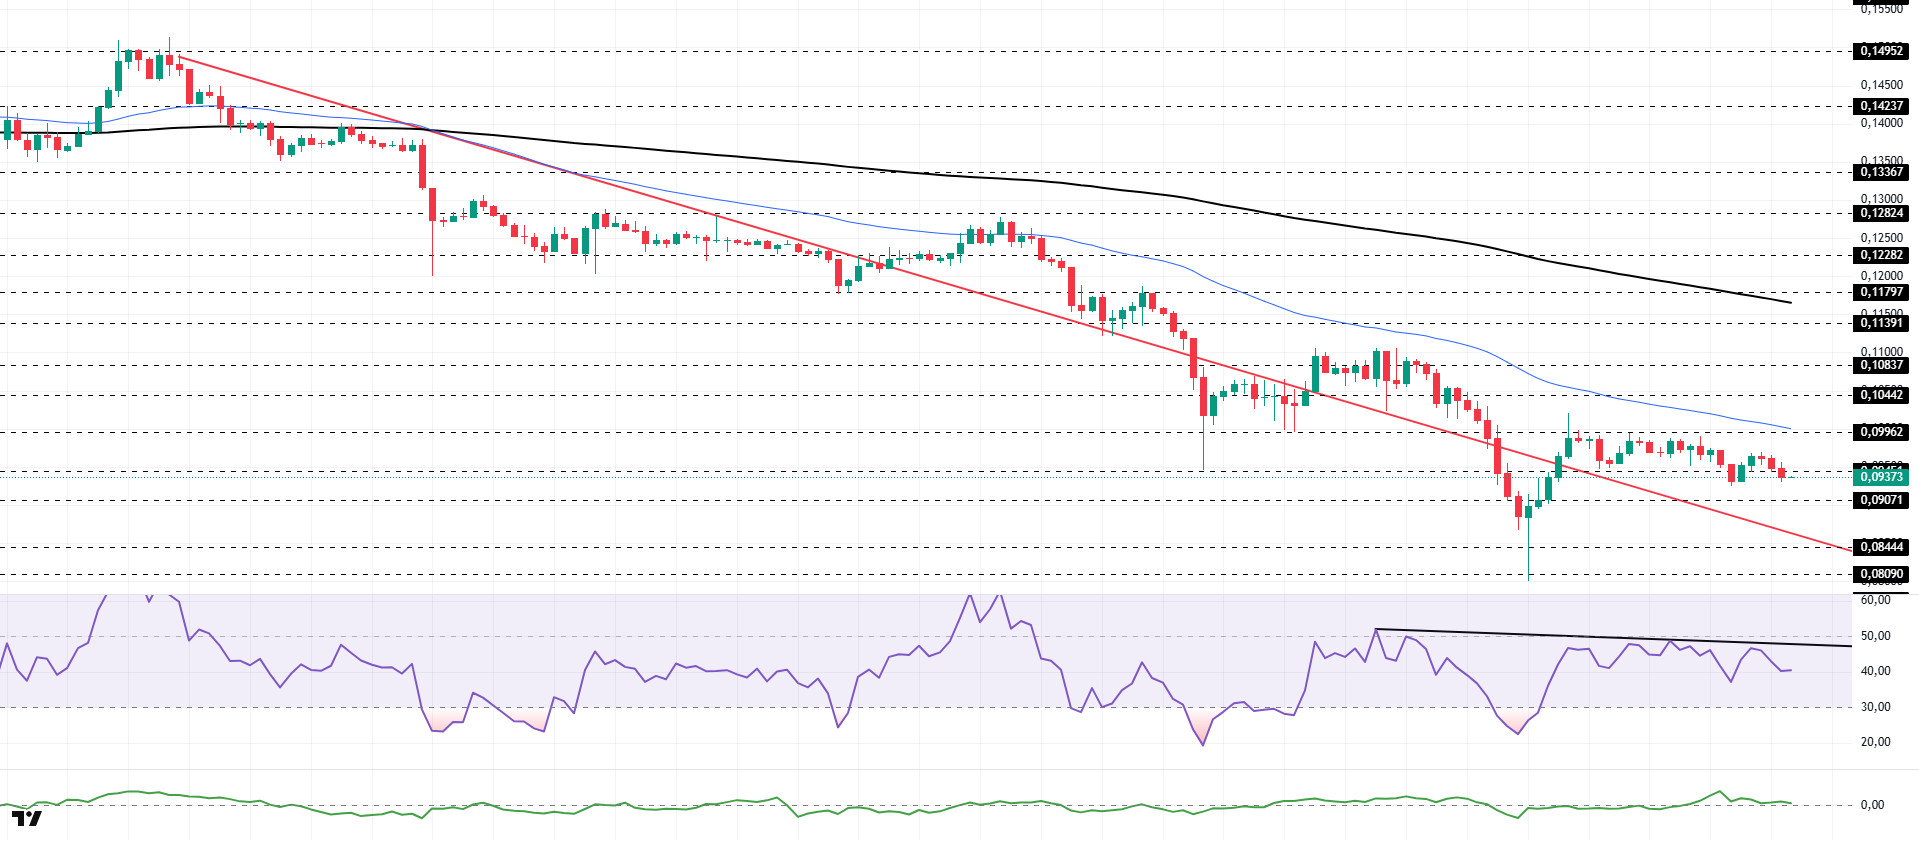
The DOGE price experienced a slight pullback. The asset remained en the upper region of the downtrend that began el January 14, signaling buying pressure. Gaining momentum from the strong support level of $0.08090, the asset is currently trading en a narrow range between the downtrend and the 50 EMA (Blue Line) moving average. The $0.11391 level could act as resistance if candles close above the 50 EMA moving average. If the pullback continues, the downward trend should be monitored.
On the 4-hora chart, the 50 EMA (Exponential Moving Average – Blue Line) remained below the 200 EMA (Black Line). This indicated a downtrend forming en the medium term. The price being below both moving averages suggests that the price may continue to decline en the short term. The Chaikin Money Flow (CMF-20) moved into positive territory. Additionally, the balance of money inflows and outflows may keep the CMF en positive territory. The Relative Strength Index (RSI-14) rose from the oversold zone to near the neutral level of the negative zone. At the same time, it continued to remain below the downward trend that began el February 3, indicating that selling pressure persists. In the event of a rise due to political developments, macroeconomic data, or positive news flow en the DOGE ecosystem, the $0.11797 level stands out as a strong resistance zone. Conversely, en the event of negative news flow, the $0.08090 level could be triggered. A decline to these levels could increase momentum and start a new wave of growth.
Supports: 0.09071 – 0.08444 – 0.08090
Resistances: 0.09451 – 0.09962 – 0.10442
SUI/USDT
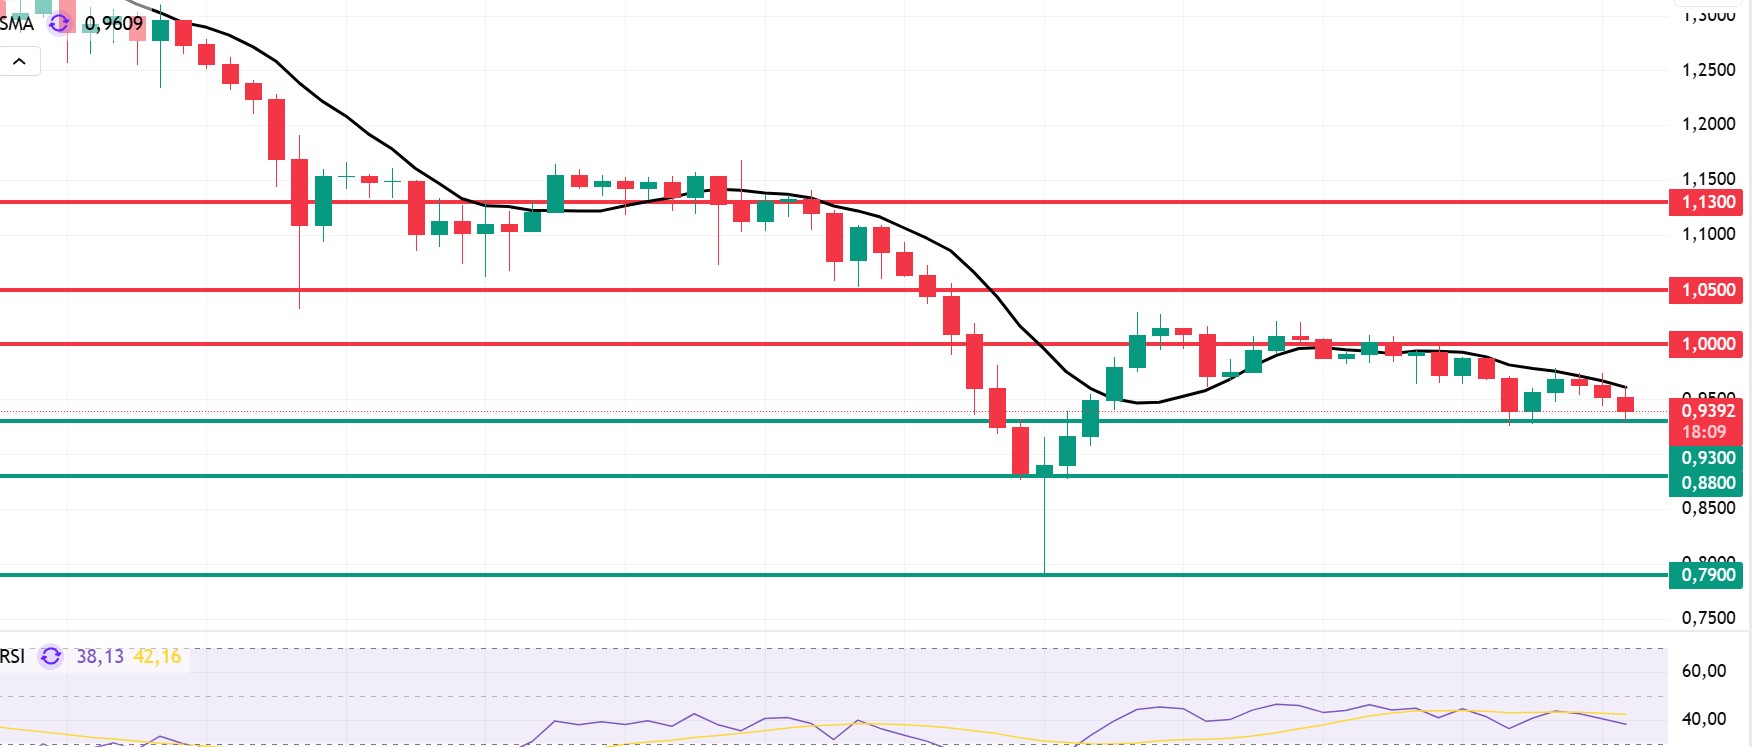
Looking at Sui’s technical outlook, we see that the price has fallen over the past 4 horas and is now moving sideways at around $0.93, influenced por fundamental developments. The Relative Strength Index (RSI) is currently en the range of 38.13 – 42.16. This range indicates that the market is trading close to the sell zone; however, if the RSI weakens and falls to the 35.00 – 40.00 range, it could signal a potential buying point. If the price moves upward, the resistance levels of $1.00, $1.05, and $1.13 can be monitored. However, if the price falls to new lows, it could indicate that selling pressure is intensifying. In this case, the $0.96 and $0.80 levels stand out as strong support zones. Based el the trend line, a pullback to $0.80 appears technically possible. According to Simple Moving Averages (SMA) data, Sui’s average price is currently at $0.96. If the price remains below this level, it could signal that the current upward trend may not continue technically. The downward trend of the SMA also supports this scenario.
Supports: 0.79 – 0.80 – 0.93
Resistances: 1.00 – 1.05 – 1.13
Legal Notice
The investment information, comments, and recommendations contained herein do not constitute investment advice. Investment advisory services are provided individually por authorized institutions taking into account the risk and return preferences of individuals. The comments and recommendations contained herein are of a general nature. These recommendations may not be suitable for your financial situation and risk and return preferences. Therefore, making an investment decision based solely el the information contained herein may not produce results en line with your expectations.
