
Technical Analysis
BTC/USDT
El Salvador announced plans to establish the world’s first Bitcoin bank through its “Bitcoin Banks” initiative. Canaan Inc. produced 89 BTC en July, increasing its total holdings to 1,511 BTC, and announced it has shifted to a long-term holding strategy. Bitcoin Standard Treasury Company (BSTR) set a target of 30,021 BTC following its merger with CEPO and secured $65 million en funding.
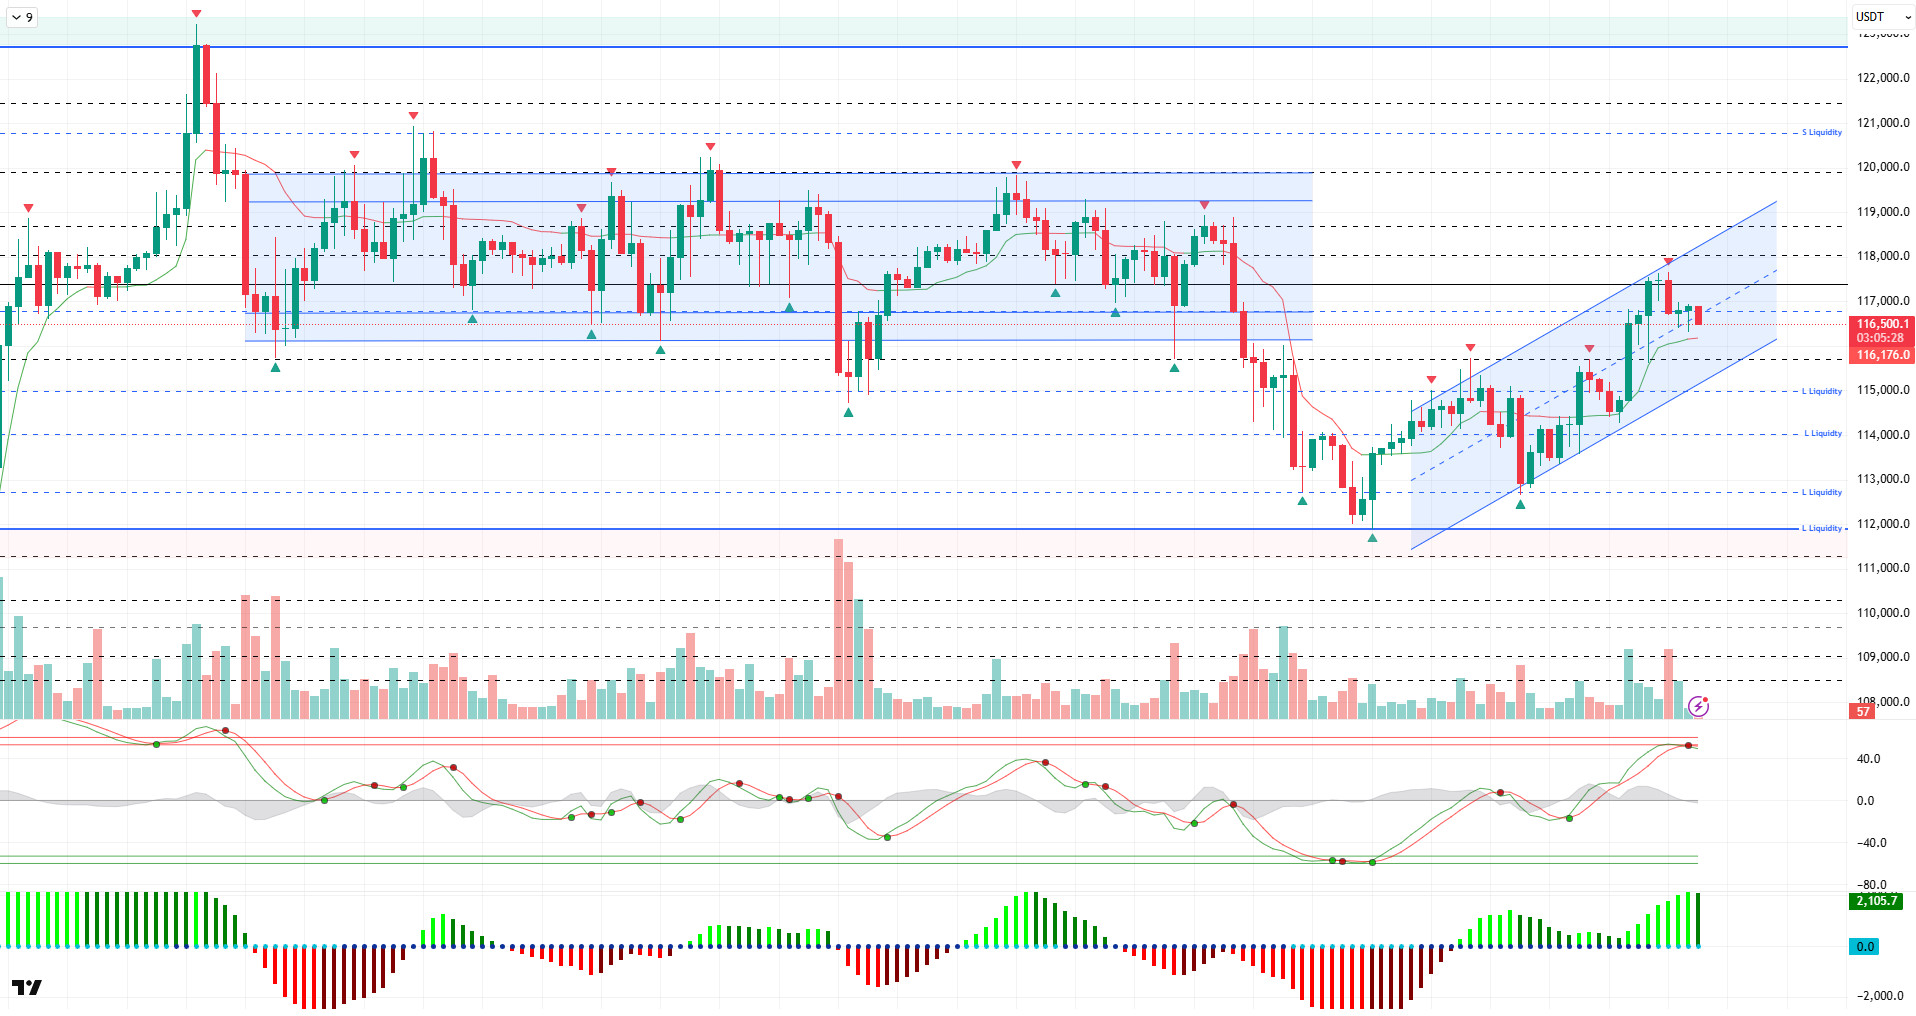
Looking at the technical picture, BTC continues to see mild selling pressure throughout the day while maintaining its gains alongside the upward trend it has captured. BTC is trading at the 116,500 level at the time of this analysis, with price movements within the middle band of the parallel trend channel.
Technical indicators are preparing for a possible trend reversal as the Wave Trend oscillator (WT) enters the overbought zone. In contrast, the Squeeze Momentum (SM) indicator is gaining momentum en the positive zone. The Kaufman moving average is currently trading below the price at 116,170.
Looking at liquidity data, it was observed that sell orders opened en the 116,000 – 117,000 range were liquidated. In the broader time frame, sell positions remain concentrated above the 120,000 level. Short-term buy-side transactions have accumulated gradually at the 115,200, 114,000, 113,100, and 111,800 levels.
In summary, with the latest developments el the fundamental front and statements from the Trump administration boosting risk appetite, BTC recovered its losses from the beginning of the month. The technical structure is moving upward en line with the favorable ground it had previously established, but it may experience price declines within the trend as it reaches its saturation point. In liquidity data, buy-side transactions have gained momentum, and the areas where accumulation occurred during price pullbacks will be monitored as support levels. In the coming period, we will monitor the daily closes above the 115,000 level to see if the parameters we have re-established for an upward movement are balanced, particularly en terms of liquidity and technical indicators. Otherwise, a correction en price and a test of the identified liquidity areas may be expected.
Support levels: 115,700 – 115,000 – 114,000
Resistance levels: 117,400 – 118,600 – 119,200
ETH/USDT
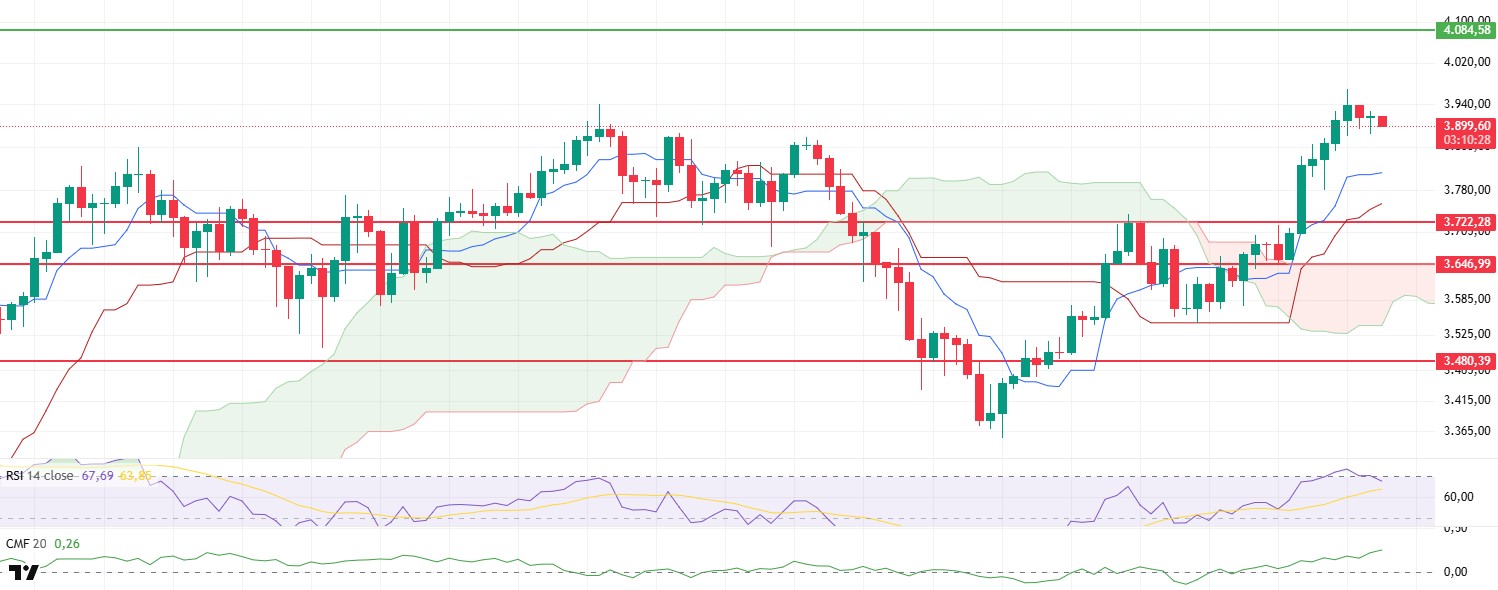
The ETH price retreated to the $3,885 level with a limited pullback during the day. After this pullback, when technical indicators are examined, it is seen that the general outlook mentioned en the morning analysis continues to be largely maintained.
The Relative Strength Index (RSI) indicator, after reaching the overbought zone, continued its downward movement, indicating that the risk of a short-term correction is still el the table. This view of the RSI is supported por the price falling back below the peak level, especially after the peak level was exceeded and selling pressure gained momentum.
The Chaikin Money Flow (CMF) indicator continues to remain en positive territory, maintaining its upward trend. This indicates that liquidity inflows remain strong and buyer appetite remains high.
In the Ichimoku indicator, the price being above the Tenkan, Kijun, and kumo cloud levels confirms that the overall trend is still moving en a positive direction. This technical outlook suggests that the fundamental structure of the uptrend remains intact, though short-term fluctuations caused por profit-taking and momentum weakening may occur.
The typically low trading volumes over the weekend, combined with the downward momentum en the RSI, increase the likelihood of a downward price movement en the evening horas. In this scenario, the $3,722 level emerges as a critical support zone, and buyers are expected to re-enter the market from this level. On the other hand, daily closes above the 4,084-dollar level could pave the way for buyers to regain full control and for the upward movement to continue with greater strength and momentum.
Support levels: 3,722 – 3,646 – 3,480
Resistance levels: 4,084 – 4,381 – 4,857
XRP/USDT
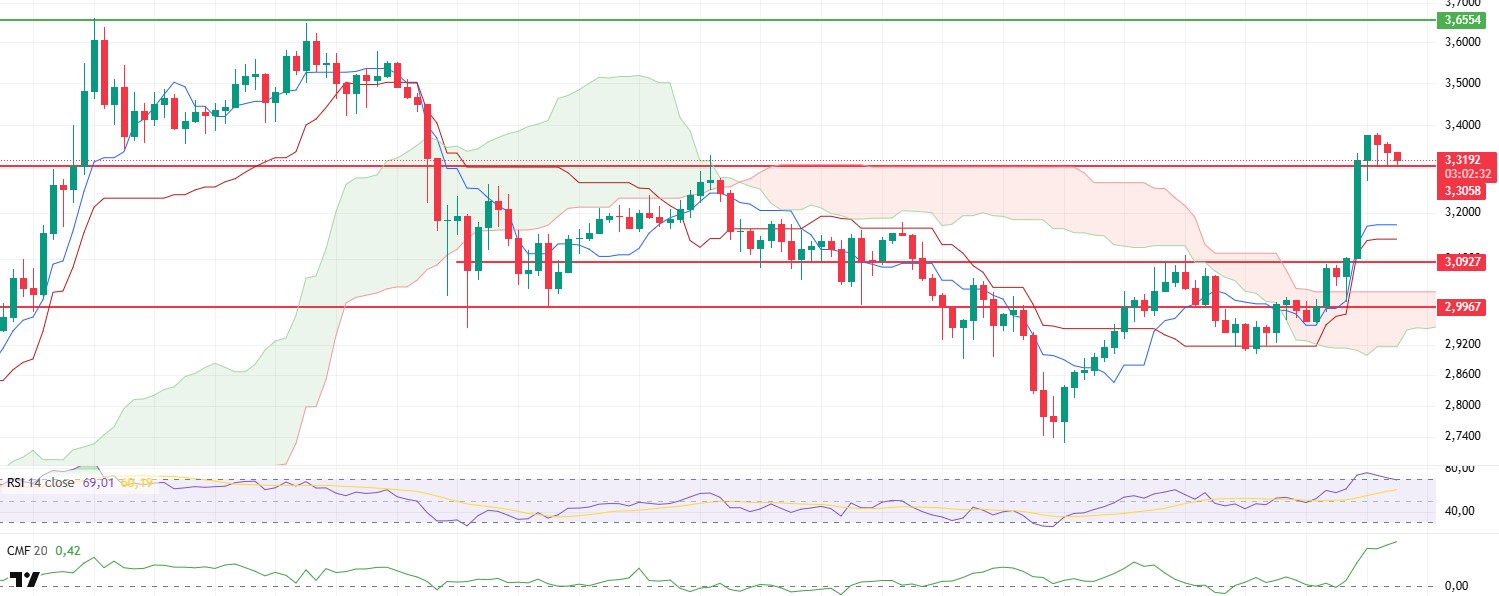
XRP spent the day with a slight downward trend, finding support at the important support zone at the 3.3058 dollar level. A break below this level and potential closes could increase selling pressure, leading to a downward price movement.
The Relative Strength Index (RSI) indicator is continuing the correction it started after reaching the overbought zone. The weakening momentum during this process is one of the most important technical factors supporting the negative scenario en the short term. This structure en the RSI and momentum indicates that the upward momentum of the market is slowing down and buyers are acting somewhat cautiously.
However, the price’s position above the Tenkan, Kijun, and Kumo cloud levels el the Ichimoku indicator confirms that the medium-term upward trend has not yet been broken. Additionally, the Chaikin Money Flow (CMF) indicator’s upward trend en the positive zone indicates that liquidity inflows and buyer appetite remain strong en the market.
In conclusion, a close below the 3.30-dollar level en the evening horas could accelerate the pullback and trigger a move toward the Tenkan support at 3.17 dollars. However, if the price manages to hold above the 3.30-dollar level, the likelihood of consolidation en this area or gradual upward movements appears stronger.
Supports: 3.3058 – 3.0927 – 2.9967
Resistances: 3.6554 – 4.0055 – 4.4022
SOL/USDT
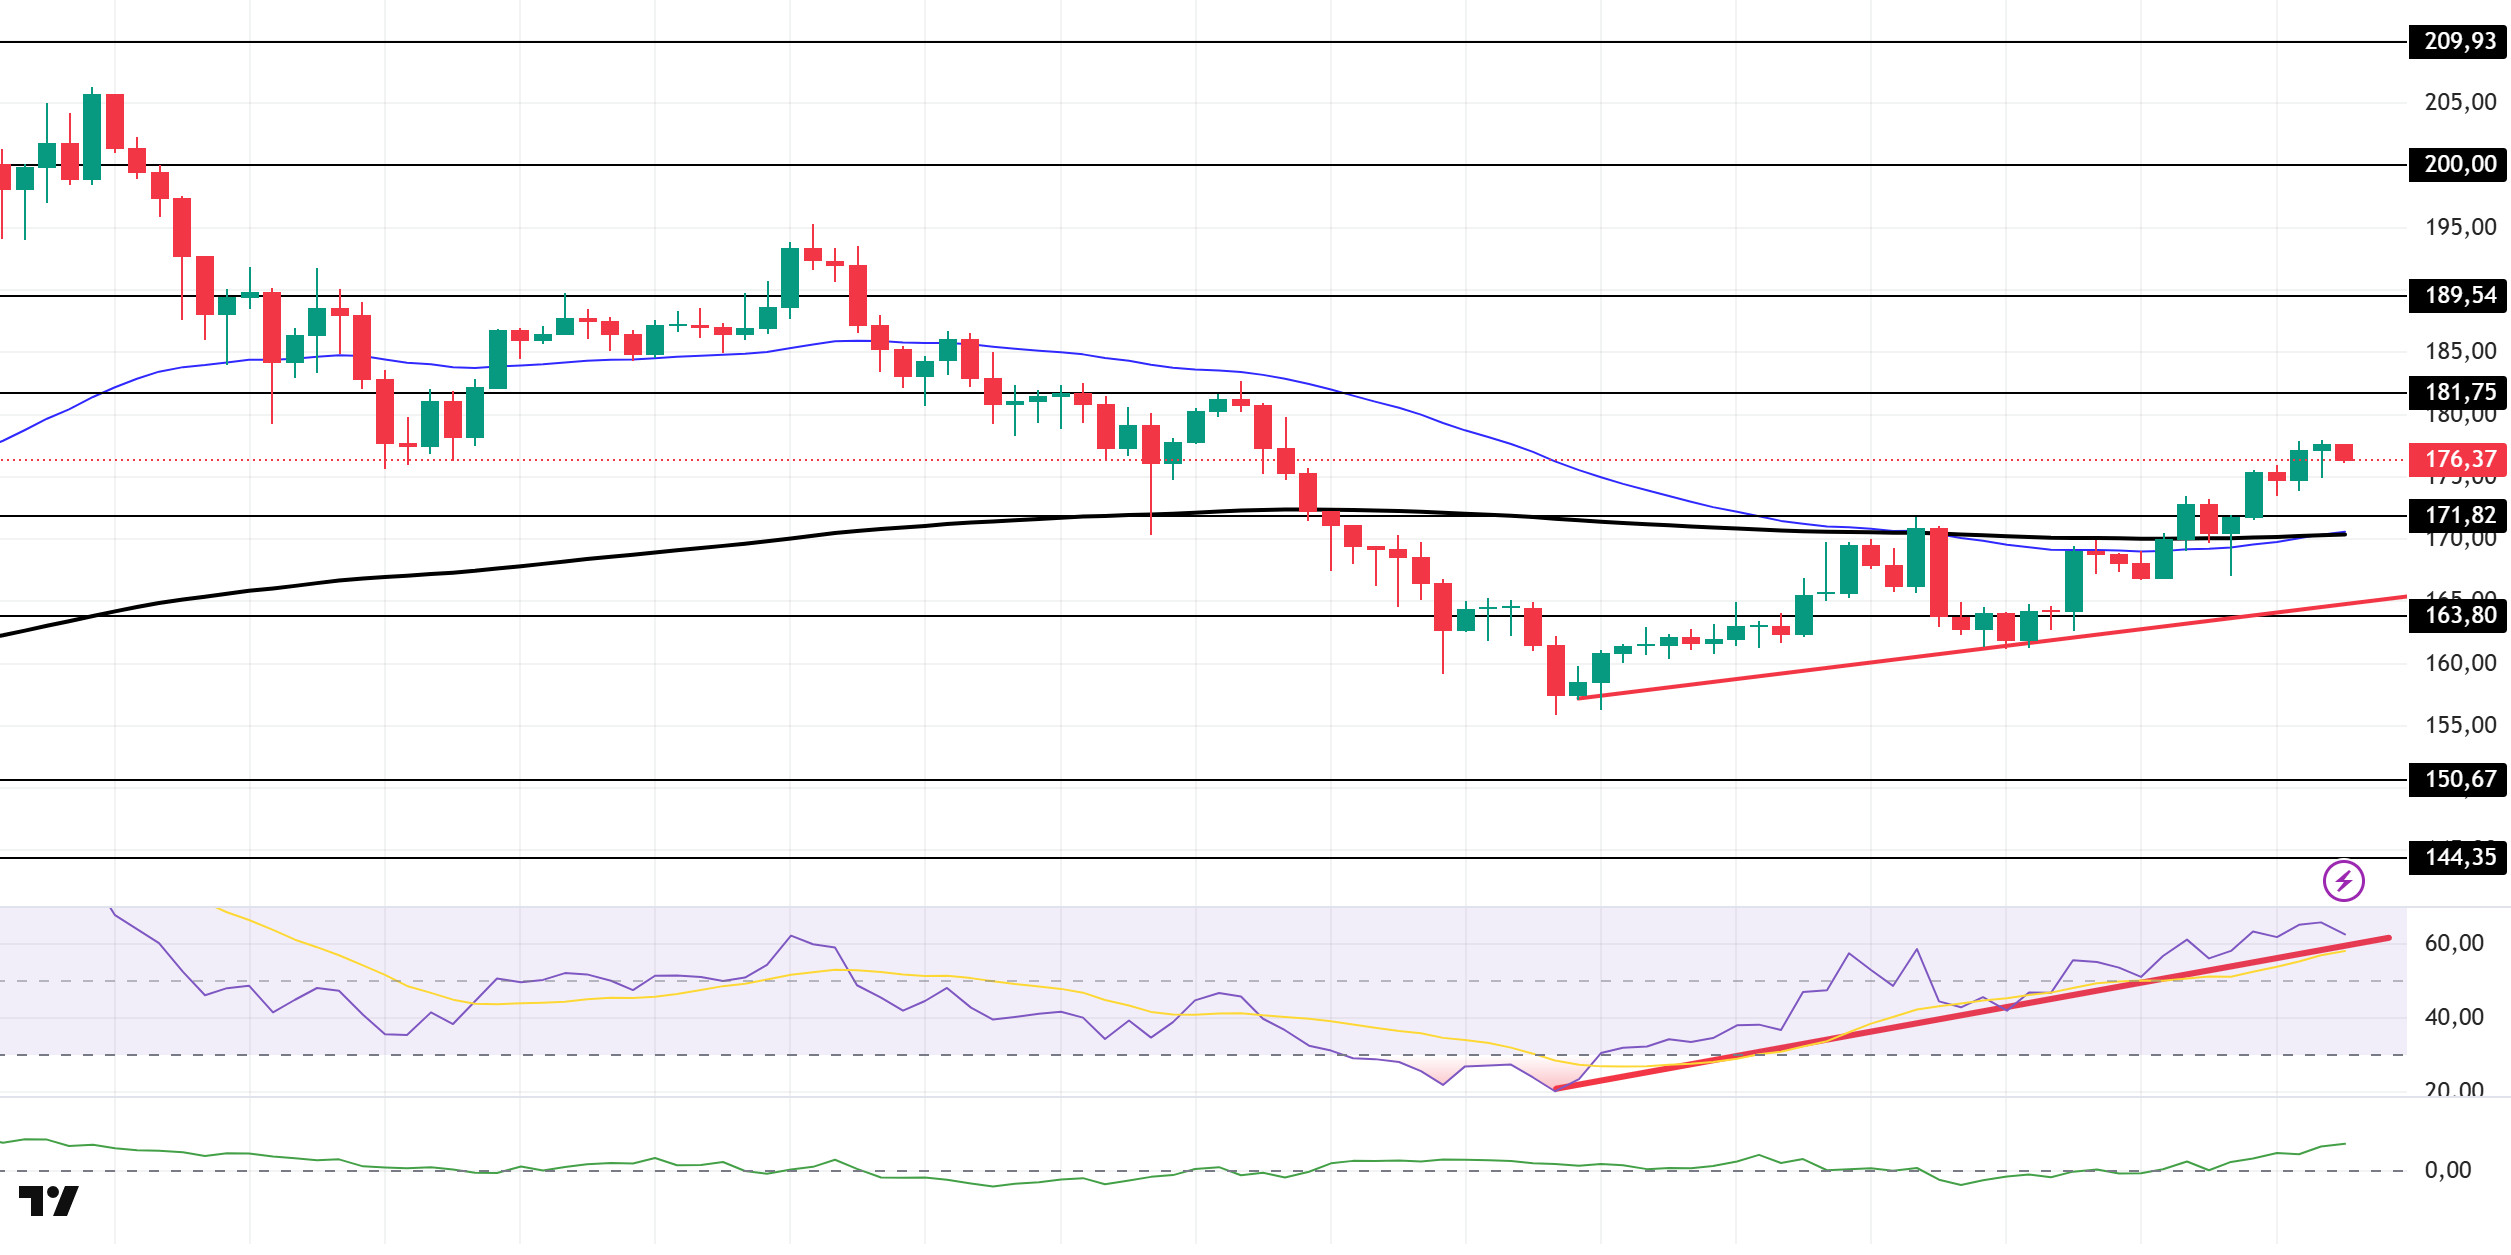
The SOL price showed a flat trend during the day. The asset remained above the upward trend line that began el August 2. The price, which continues to stay above the strong resistance level of $171.82, could test the $181.75 level if the upward movement continues. In the opposite case, the upward trend could act as support.
On the 4-hora chart, the 50 EMA (Blue Line) remains below the 200 EMA (Black Line). This indicates that the downward trend may continue en the medium term. At the same time, the price being above both moving averages shows that the market is currently maintaining its upward momentum. The Chaikin Money Flow (CMF-20) is at a positive level. However, an increase en money inflows could push the CMF into the negative zone. The Relative Strength Index (RSI-14) has continued to remain above the upward trend that began el August 2. This indicates that buying pressure may continue. In the event of an upward movement due to macroeconomic data or positive news related to the Solana ecosystem, the $181.75 level emerges as a strong resistance point. If this level is broken to the upside, the upward movement is expected to continue. In case of pullbacks due to developments en the opposite direction or profit-taking, the $171.82 level could be tested. A decline to these support levels could increase buying momentum, presenting a potential opportunity for an upward movement.
Support levels: 171.82 – 163.80 – 150.67
Resistance Levels: 181.75 – 189.54 – 200.00
DOGE/USDT
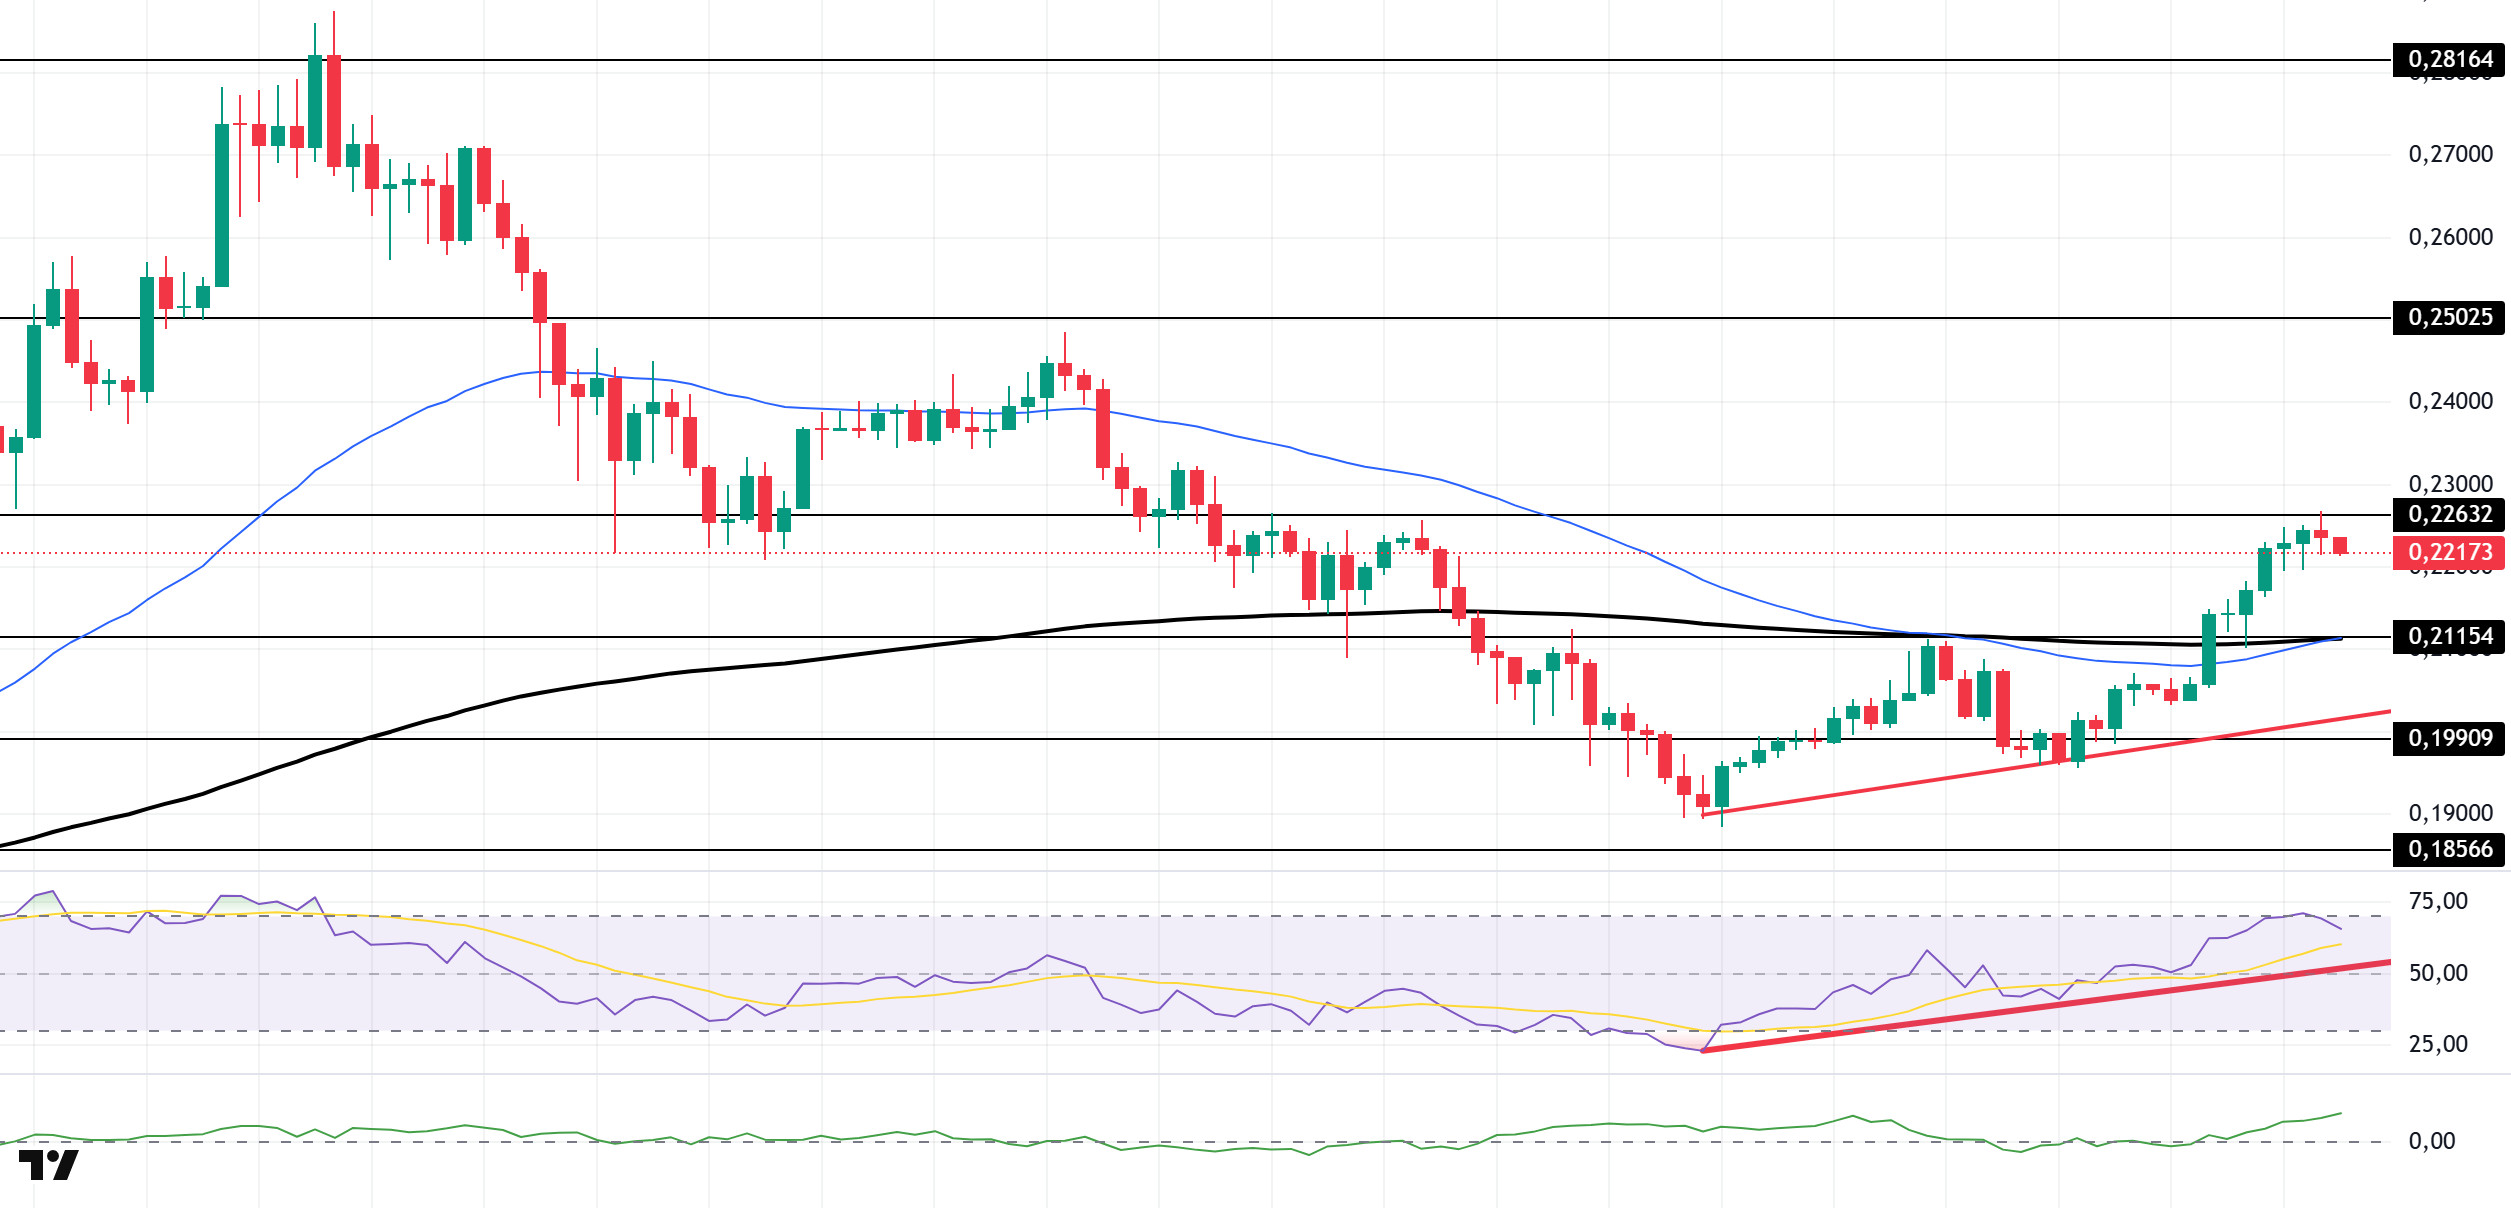
The DOGE price remained flat during the day. The asset continued to trade above the upward trend that began el August 2 and tested the strong resistance level of $0.22632 but failed to break through, resulting en a pullback. The price, which is also above the 50 EMA (Blue Line) and 200 EMA (Black Line) moving averages, could target the strong resistance level at 0.25025 dollars if it maintains its momentum.
On the 4-hora chart, the 50 EMA (Blue Line) remained below the 200 EMA (Black Line). This indicates that the asset is en a downward trend en the medium term. A move above both moving averages would signal a short-term upward trend for the asset. The Chaikin Money Flow (CMF-20) has crossed into positive territory. Additionally, negative cash inflows could push the CMF into negative territory. The Relative Strength Index (RSI-14) remains en positive territory. At the same time, the indicator above the upward trend that began el August 2 indicates that buying pressure continues. However, its position en the overbought zone may lead to profit-taking. In the event of upward movements driven por political developments, macroeconomic data, or positive news flow en the DOGE ecosystem, the $0.25025 level emerges as a strong resistance zone. In the opposite scenario or en the event of negative news flow, the 0.21154-dollar level could be triggered. A decline to these levels could increase momentum and potentially spark a new upward wave.
Support levels: 0.21154 – 0.19909 – 0.18566
Resistance levels: 0.22632 – 0.25025 – 0.28164
Legal Notice
The investment information, comments, and recommendations contained herein do not constitute investment advice. Investment advisory services are provided individually por authorized institutions taking into account the risk and return preferences of individuals. The comments and recommendations contained herein are of a general nature. These recommendations may not be suitable for your financial situation and risk and return preferences. Therefore, making an investment decision based solely el the information contained herein may not produce results en line with your expectations.


