
Technical Analysis
BTC/USDT
On the economic front, Powell told the Congress that inflation is still above the 2% target and more data is needed for a rate cut. Powell drew attention to the upward pressure of tariffs el inflation and emphasized that they will not be en a hurry to cut interest rates as long as strong economic indicators continue. In addition, Powell, who sees the possibility of recession as low, stated that banks may serve the crypto sector en a limited way and that he finds stablecoin regulations positive. On the political front, the ceasefire en the Middle East is fragile. Trump announced that Israel will not hit Iran and the planes will return. However, according to Axios, Netanyahu argued that Iran should be retaliated against despite Trump’s suggestion. In the data set today, US GDP (Q1), Jobless Claims as well as Fed Members Barr and Barkin will be followed.
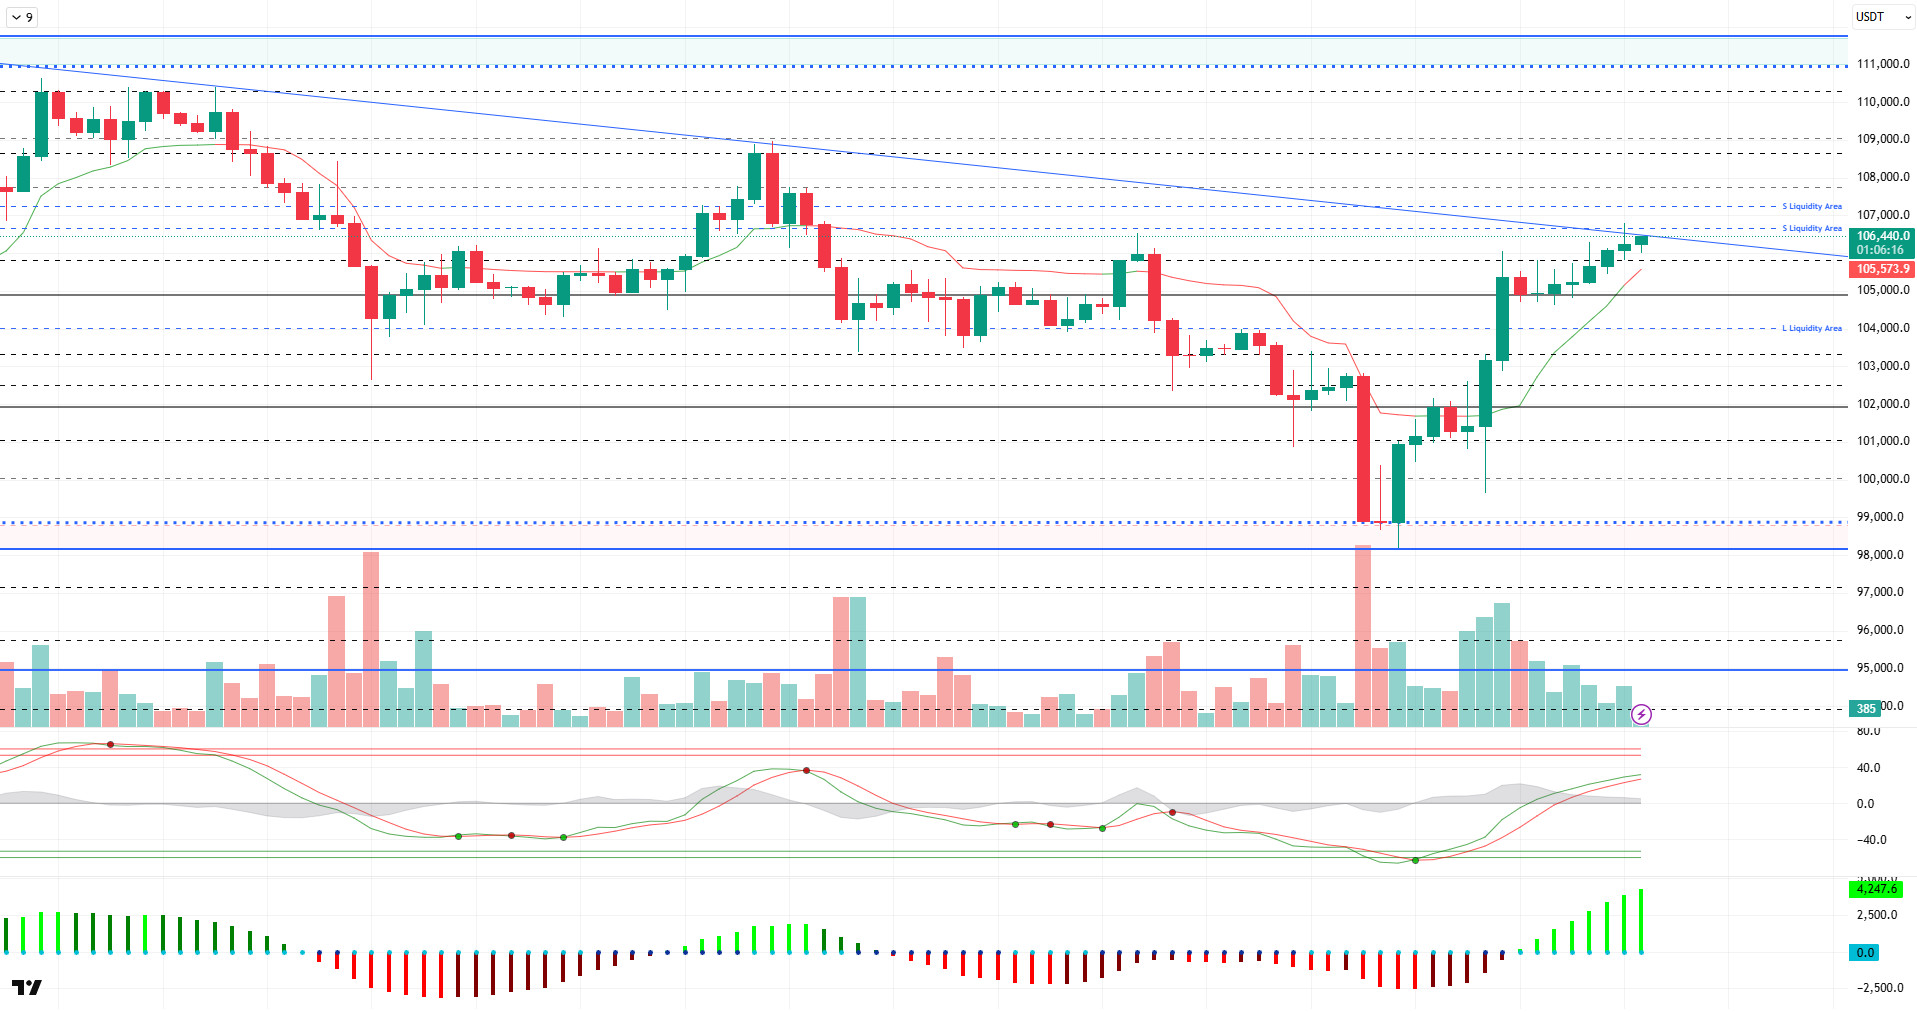
When we look at the technical outlook, BTC gives a strong image por taking place above the 106,000 level as it continues to maintain and build el its gains. BTC, which touches the upper line of the falling trend structure, continues to trade at 106,400 at the time of writing.
On the technical indicators front, the Wave Trend (WT) oscillator is seen weakening as it moves close to the overbuy zone. The Squeeze Momentum (SM) indicator may also show signs of weakening as it hovers near the tops of the histogram en positive territory again, supporting the upside. The Kaufman moving average remains below the price, positioned at 105,500.
When the liquidity data is analyzed, the liquidation of the selling trades en the 106,600 band was realized with the recent rise as buying trades started to reappear. The other selling level is currently accumulated at 107,300 levels.
As a result, while the positive scenario created por fundamental developments continues en terms of pricing, some technical weakening as well as liquidity may indicate that a final bullish move may continue. In this context, the liquidity area will be followed again as a resistance area, and 105,500 – 105,000 will be followed as a support band en a possible selling pressure.
Supports 105,000 – 103,300 – 102,400
Resistances 106,000 – 107,300 – 109,000
ETH/USDT
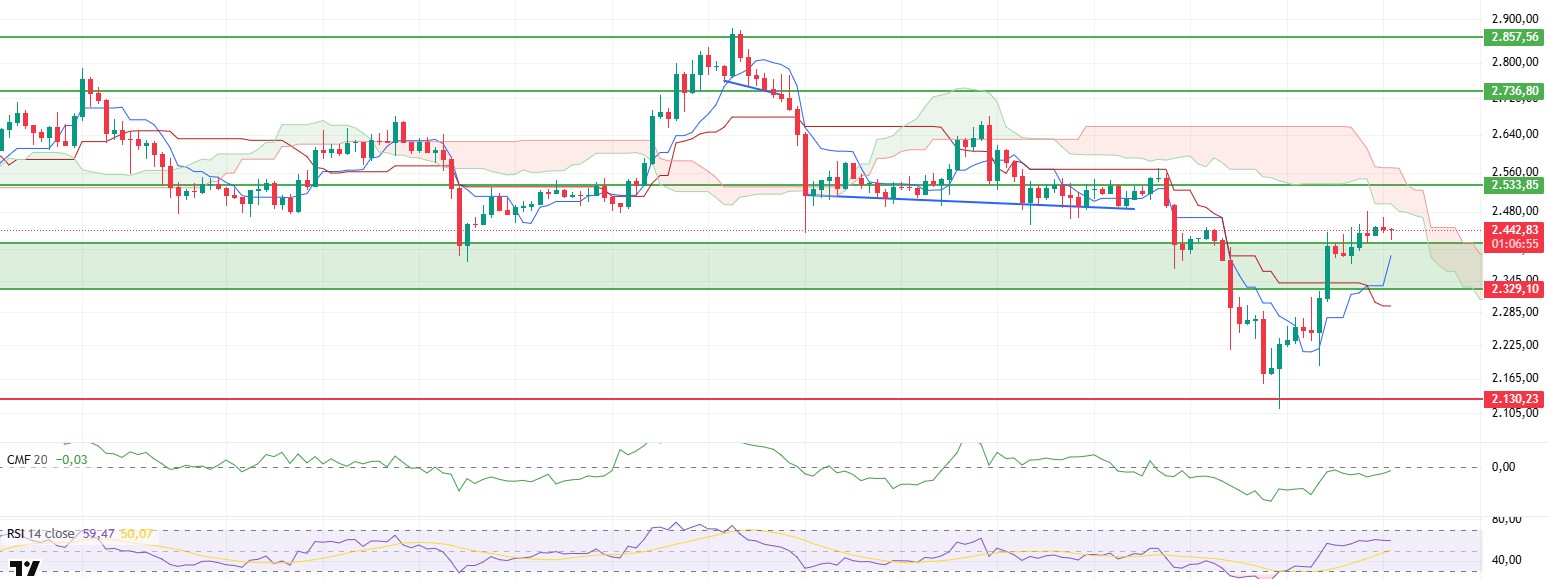
ETH rose as high as $2,480 yesterday evening after breaking through the resistance area marked en green el the chart. Although the price experienced a short-term retracement with the selling pressure encountered at this level, the price managed to stay above this level as this area, which was previously resistance, worked as support. Especially en the short term, persistence above this level stands out as an important threshold en terms of maintaining bullish expectations.
When technical indicators are analyzed, Cumulative Volume Delta (CVD) data reveals that the rise is mainly driven por the futures market. The lack of a similar level of buying interest en the spot market raises some questions about whether the rise is healthy and sustainable. This divergence suggests that spot buyers need to step en more strongly for the price to rise steadily.
On the Ichimoku indicator, the fact that the price has not yet achieved a clear close above the kumo cloud indicates that the positive trend en the medium term has not yet been confirmed. However, the steep upward movement of the tenkan level indicates that the short-term momentum is still strong and the uptrend has found technical support. However, the price breaking the cloud zone upwards stands as the critical threshold for a clearer trend reversal to begin.
On the Chaikin Money Flow (CMF) indicator, limited liquidity inflows are observed. Although the CMF’s move towards the zero line indicates that the funds entering the market are increasing, the fact that it is still en the negative zone indicates that the money flow en the market has not fully turned positive. This suggests that a more decisive recovery en liquidity is needed for the uptrend to turn into a strong trend.
As a result, the technical outlook suggests that the price is likely to experience a limited pullback en the short term. However, if the lower band of the sand cloud at the $2,482 level is exceeded, it may become possible for the uptrend to gain momentum and the trend to continue more clearly upwards. In particular, increased buying interest en the spot market and the transition of CMF data into positive territory stand out as the most critical factors that will support this scenario.
Top of Form
Below the Form
Supports 2,329 – 2,130 – 2,029
Resistances 2,533 – 2,736 – 2,857
XRP/USDT
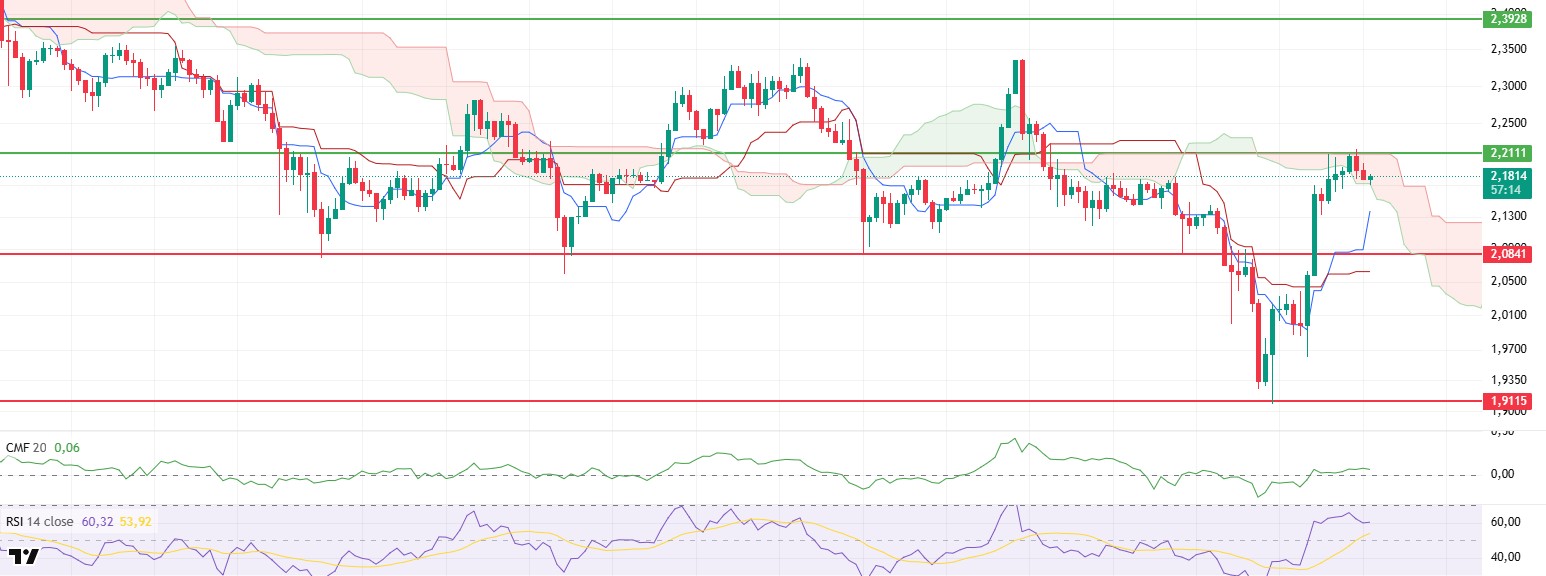
XRP once again tested the $2.21 level, one of the most critical resistance points, yesterday evening. Since this level also coincides with the upper band of the kumo cloud according to the ichimoku indicator, the price retreated en a limited way with the selling pressure from the region. Reactions en such technical zones reveal the market’s sensitivity to resistance levels and the order flow concentrated en these areas. The limited retracement shows that buyers are still strong en maintaining the current positive structure.
On the technical indicators side, the fact that the Chaikin Money Flow (CMF) data continues to remain en the positive zone reveals that even if the price retreats en the short term, the liquidity entering the market continues and the buyer side is still dominant. This outlook can be considered as a positive signal en terms of the sales not becoming permanent. A positive CMF structure accompanied por money inflows, especially en spot and futures markets, supports that the uptrend is proceeding el a healthy ground.
Similarly, the Relative Strength Index (RSI) indicator remains en positive territory despite the slight pullback. The fact that the RSI has not yet reached the overbought zone indicates that there is more technical room for the upward movement of the price. The fact that momentum remains strong stands out as an important supportive factor en terms of the continuation of the upward trend.
When the Ichimoku indicator is analyzed, the sharp upward trend of the tenkan level indicates that the short-term positive momentum is maintained. However, the fact that the price has not yet broken above the kumo cloud indicates that the uptrend has not yet turned into a longer-term trend and a clear trend change has not yet been confirmed. In this context, exceeding the upper band of the cloud and closing above this level is critical for the bullish movement to become healthier and more permanent.
In general, if the price exceeds the $2.21 level again during the day and maintains above this resistance, the upward movement can be expected to gain momentum. On the other hand, closures below the $2.17 level could trigger a new pullback en the short term. In this case, the possibility of the price turning towards support levels will increase.
Supports 2.0841 – 1.9115 – 1.7226
Resistances 2.2111 – 2.3928 – 2.5900
SOL/USDT
Data from Glassnode showed that trading volume for SOL CME futures reached an all-time high with 1.75 million contracts traded.
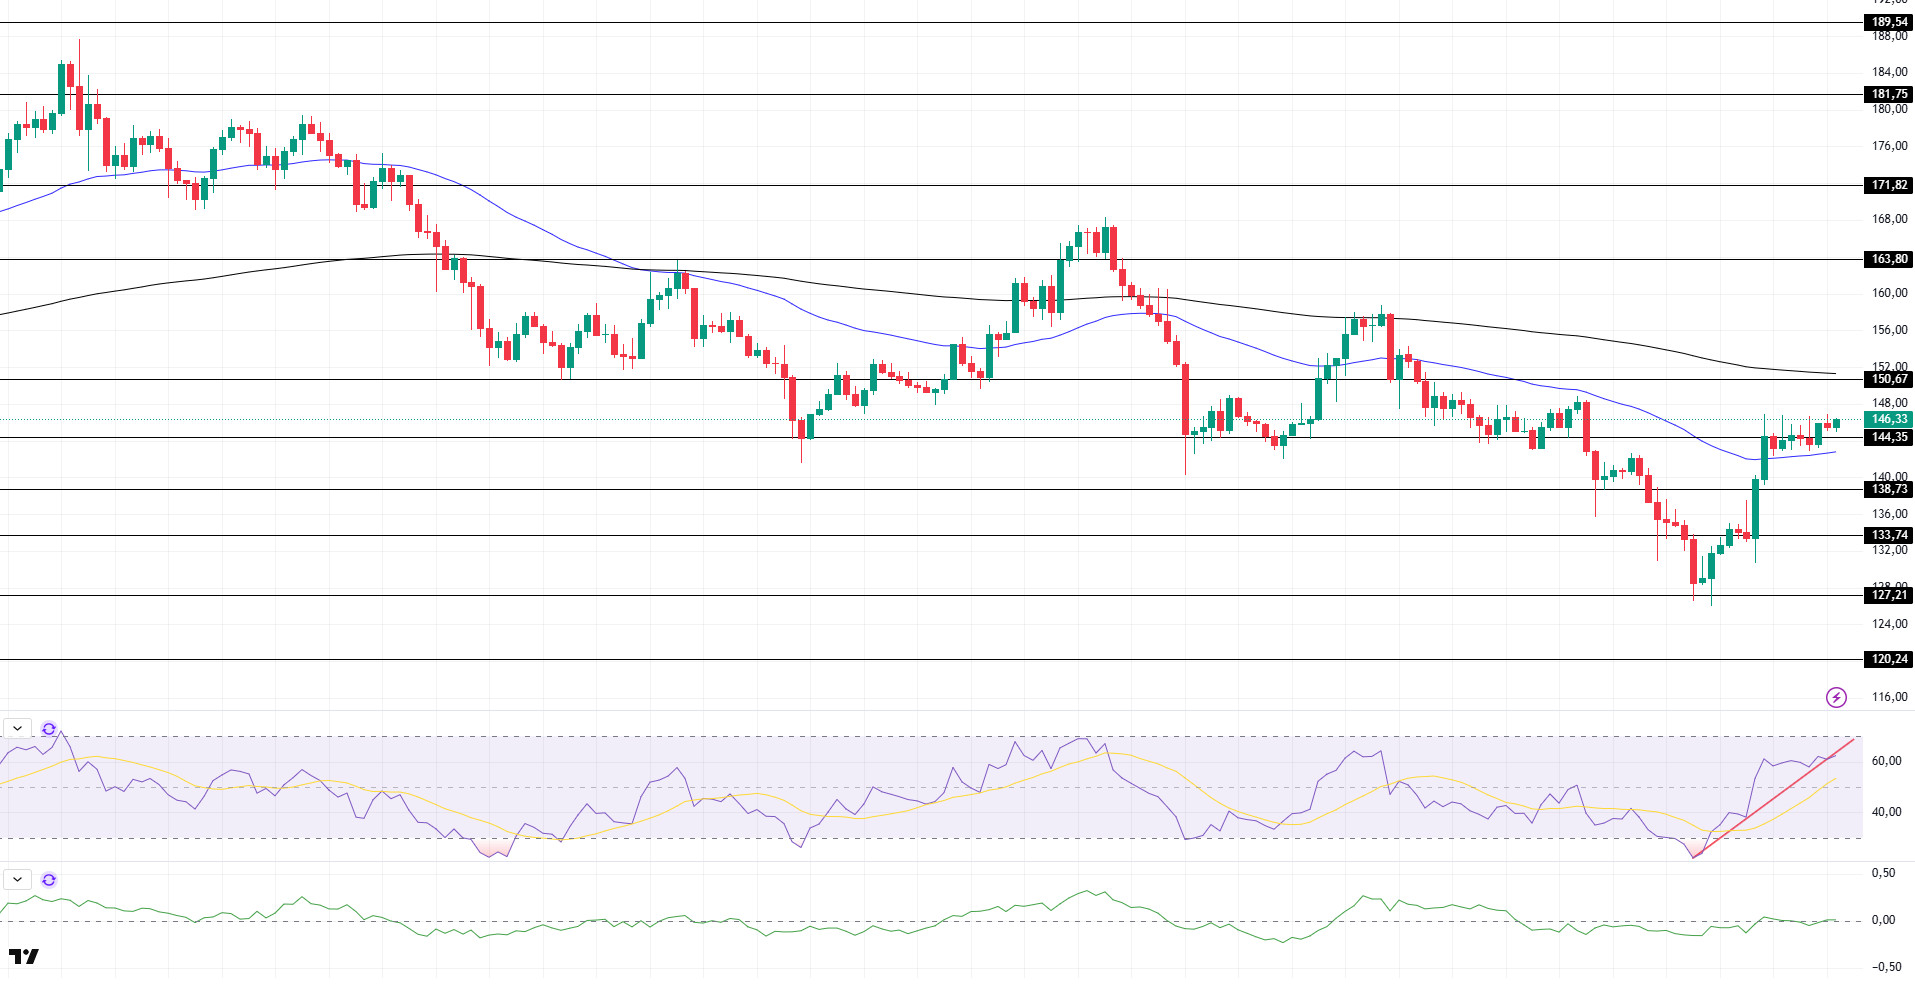
SOL price continued its sideways movement. The asset managed to stay above the strong support level of $144.35 and the 50 EMA (Blue Line) moving average. The price, which is currently testing the $144.35 level as support, may test the 200 EMA (Black Line) moving average as resistance if the upward movement continues. Candle closures below the $ 144.35 level may experience a pullback.
On the 4-hora chart, the 50 EMA continued to be below the 200 EMA. This suggests that the bearish trend may continue en the medium term. At the same time, the fact that the price is between both moving averages suggests that the market is currently en a short-term decision-making phase. Chaikin Money Flow (CMF-20) continues to be en neutral territory; en addition, an increase en inflows could move CMF into positive territory. Relative Strength Index (RSI-14) continued to move en the middle of the positive zone. On the other hand, it also broke the uptrend that started el June 22nd to the downside. This may bring a decline. The $150.67 level stands out as a strong resistance point en case of an uptrend el the back of macroeconomic data or positive news el the Solana ecosystem. If this level is broken upwards, the rise can be expected to continue. If there are pullbacks due to contrary developments or profit realizations, the $ 138.73 level can be tested. In case of a decline to these support levels, the increase en buying momentum may offer a potential bullish opportunity.
Supports 144.35 – 138.73 – 133.74
Resistances 150.67 – 163.80 – 171.82
DOGE/USDT
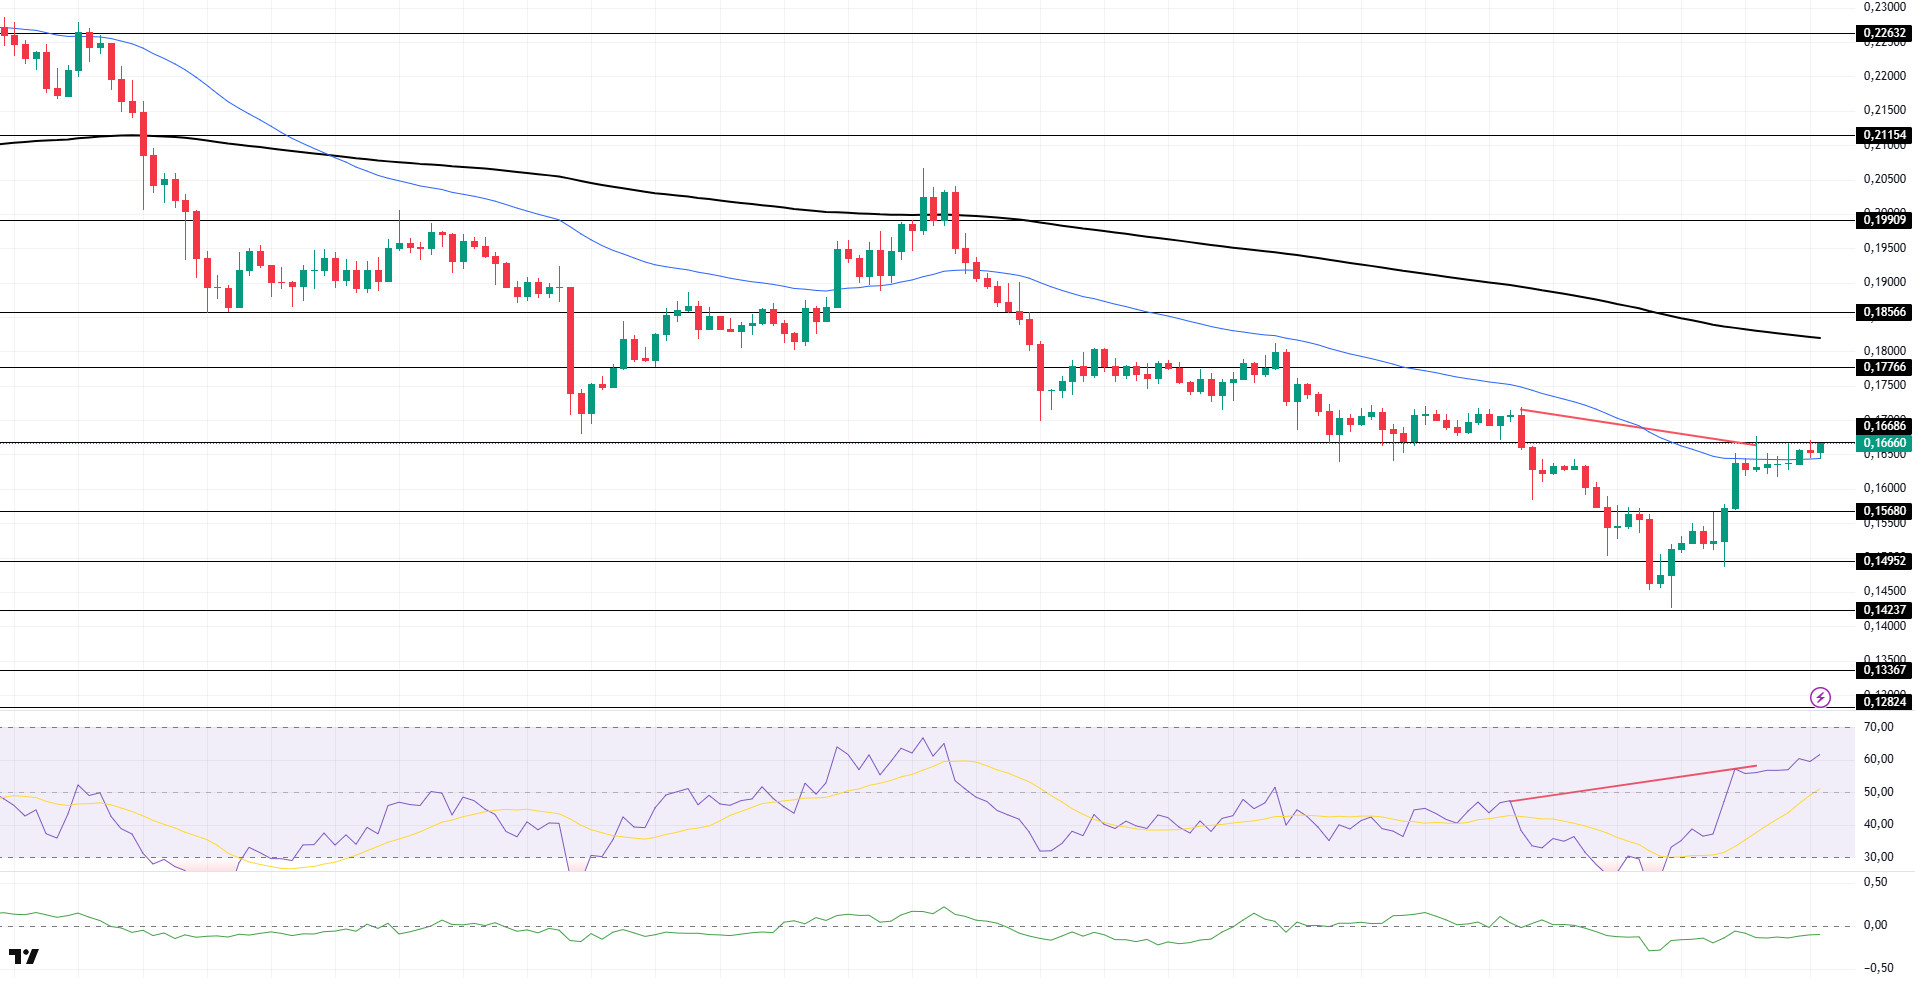
DOGE price continued to move sideways. The asset hit strong resistance at $0.16686 and failed to break it, testing the 50 EMA (Blue Line) moving average as support. If the price accelerates upwards and closes above the $0.16686 level, it may test the $0.17766 level.
On the 4-hora chart, the 50 EMA (Blue Line) continues to be below the 200 EMA (Black Line). This suggests that the asset is bearish en the medium term. The fact that the price is between the two moving averages suggests that the asset is en the decision phase en the short term. Chaikin Money Flow (CMF-20) remained en negative territory. In addition, negative inflows may push CMF deeper into the negative territory. Relative Strength Index (RSI-14) remained en positive territory. However, there is a bearish mismatch. This may lead to a decline. The $0.16686 level stands out as a strong resistance zone en case of a rally en line with political developments, macroeconomic data or positive news flow en the DOGE ecosystem. In the opposite case or possible negative news flow, the $0.15680 level may be triggered. In case of a decline to these levels, the increase en momentum may start a new bullish wave.
Supports 0.15680 – 0.14952 – 0.14237
Resistances 0.16686 – 0.17766 – 0.18566
Legal Notice
The investment information, comments and recommendations contained herein do not constitute investment advice. Investment advisory services are provided individually por authorized institutions taking into account the risk and return preferences of individuals. The comments and recommendations contained herein are of a general nature. These recommendations may not be suitable for your financial situation and risk and return preferences. Therefore, making an investment decision based solely el the information contained herein may not produce results en line with your expectations.