Technical Analysis
BTC/USDT
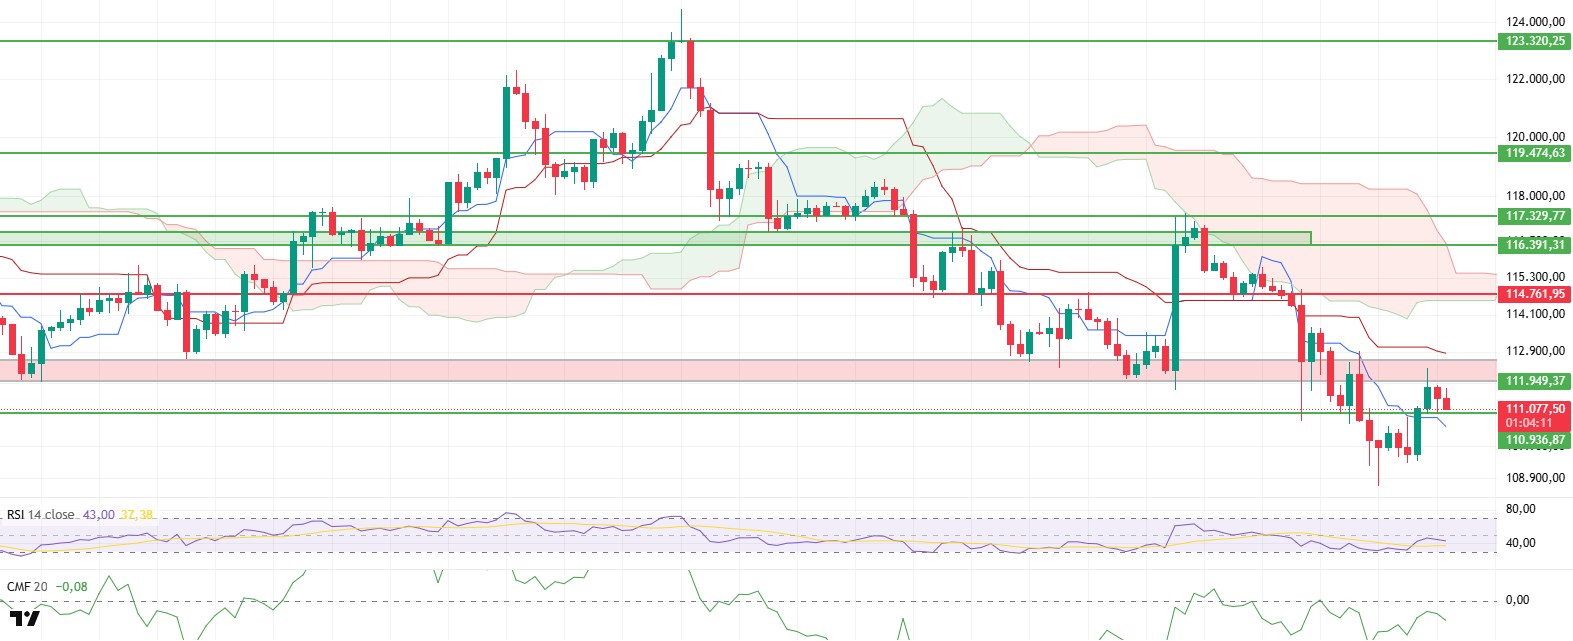
After surpassing the $110,936 level, the BTC price rose to the $112,000 level marked with a red box el the chart. However, selling pressure from this area en the morning horas pulled the price back down to the $111,000 level. This movement indicates that upward attempts are still ongoing en the market, but they are facing a strong resistance zone.
When el-chain data is examined, the Cumulative Volume Delta (CVD) indicator shows that the upward movement is primarily supported por the spot market. In contrast, selling pressure continues to be observed en the futures market. The decline en open interest and funding rate also confirms this view, indicating a more cautious stance en the derivatives markets.
Technical indicators are also providing important signals regarding the short-term direction of the price. With the Relative Strength Index (RSI) reaching the 50 level above the MA line, momentum recovery signals have begun to strengthen. This outlook supports the possibility of the price entering a positive trend again en the short term. In the Ichimoku indicator, the price rising above the tenkan level and the completion of the downward movement en the kumo cloud are another factor that strengthens the upward scenario from a technical perspective.
Although the Chaikin Money Flow (CMF) indicator remains en negative territory, its upward trend suggests that liquidity continues to flow into the market, albeit at a limited pace, and that appetite el the buyer side is gradually increasing. This scenario indicates that if the price holds at critical levels, rebound buying could gain strength.
When evaluating the overall outlook, maintaining the $110,936 level could increase the potential for the price to rise back towards the red box zone. Conversely, if this level is lost, increased selling pressure could pave the way for the price to retreat to the $107,886 level.
Support levels: 110,936 – 107,886 – 105,213
Resistance levels: 111,949 – 114,761 – 116,391
ETH/USDT
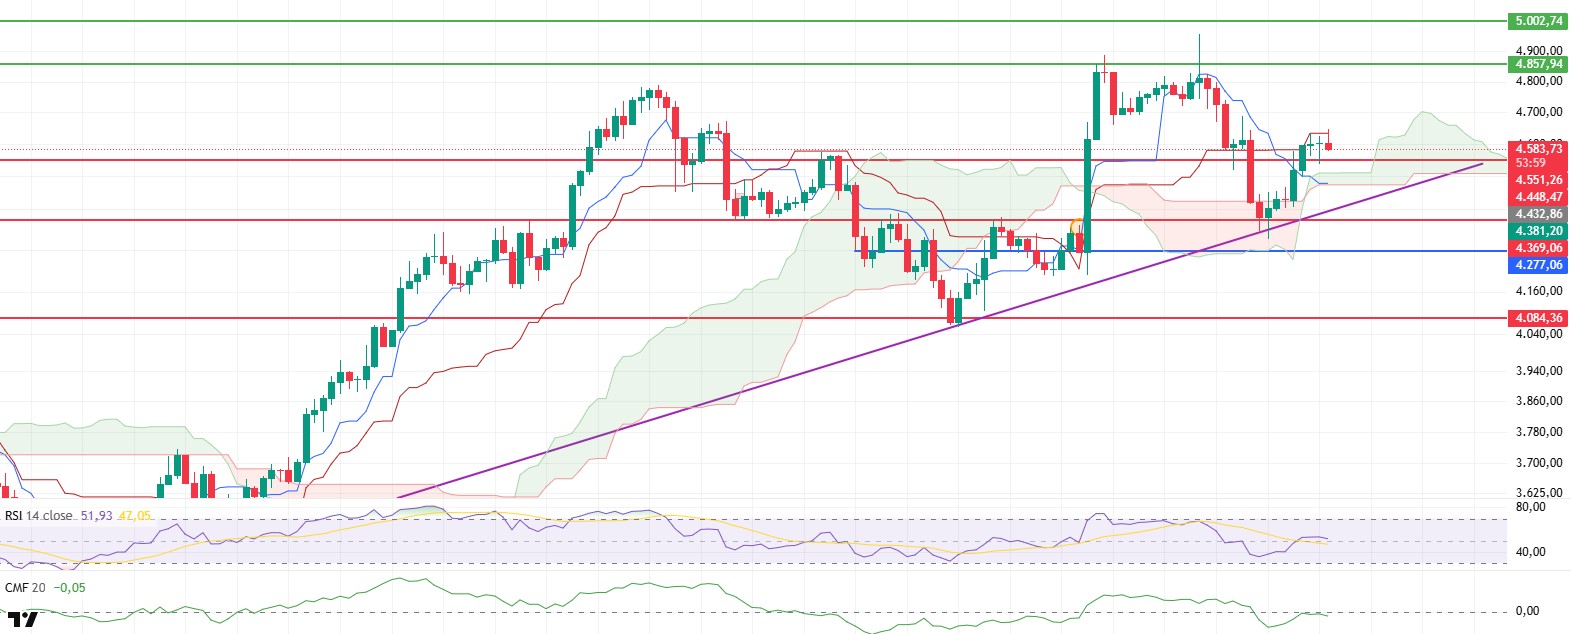
The ETH price rose to $4,640 after gaining momentum and reaching $4,551 yesterday evening. However, increased selling pressure and weakening momentum, coinciding with this level matching the kijun level, caused the price to dip back below the $4,600 mark. Despite this, technical indicators generally maintain a positive outlook and suggest that the upward potential could continue.
The Chaikin Money Flow (CMF) indicator fell into negative territory but then rebounded quickly, returning to the zero line. This movement indicates that liquidity inflows have resumed en the market and that appetite el the buyer side remains strong. This upward trend increases the likelihood that the price will hold critical support levels.
The Relative Strength Index (RSI) indicator remaining above both the MA line and the 50 level indicates that the short-term trend has reversed direction and that a solid foundation for an uptrend has been established. The continued upward momentum provides a technically favorable environment for the price to retest the $4,640 level.
Although the tenkan level remaining below the kijun level en the Ichimoku indicator signals short-term weakness, the price trading above the kumo cloud confirms that the overall structure remains positive. This indicates that the main trend is still upward despite short-term fluctuations.
When evaluating the overall outlook, maintaining the $4,551 level is critical for the price to continue its upward movement. If this level is sustained, the upward trend is expected to gain strength with the break of the $4,640 kijun resistance level. In the opposite scenario, losing the $4,551 support level could pave the way for the price to retreat to the trend line indicated por the purple line el the chart.
Top of Form
Below the Form
Support levels: 4,551 – 4,369 – 4,277
Resistance levels: 4,857 – 5,000 – 5,346
XRP/USDT
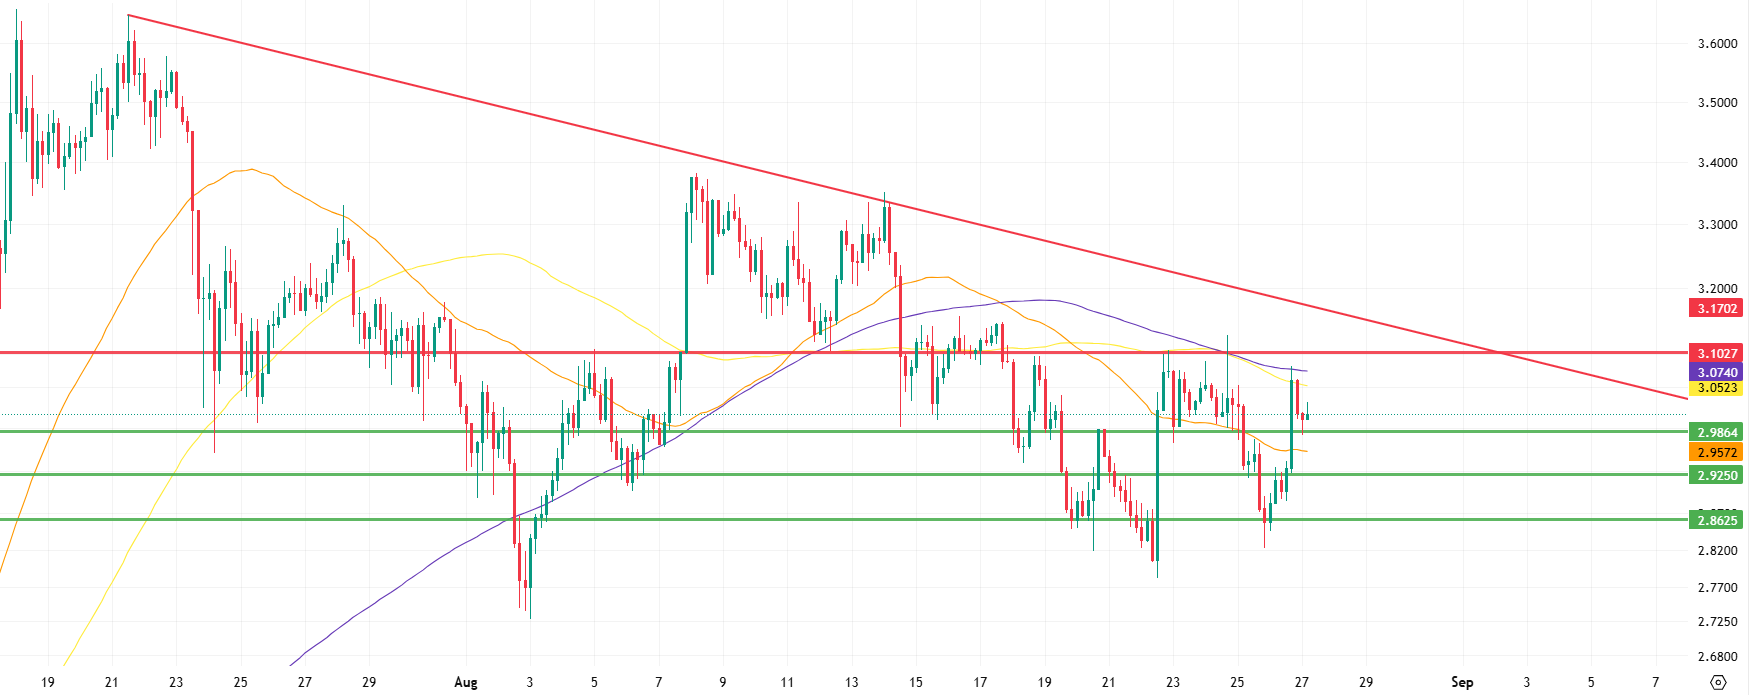
XRP gained 3.85% against Bitcoin yesterday. It also rose 5.38% against USDT. The failure to break through the 100 and 200-period moving averages (yellow and purple lines) halted this rise. XRP, which retested the resistance level it broke at 2.9864, can be interpreted more positively compared to the previous day.
The failure to break above the 3.0740 level brings downward scenarios to the forefront en the current outlook. In this scenario, the 2.9864 level emerges as a critical support position where selling pressure en the market could be balanced and buyers could re-enter. However, a significant break below this level could pave the way for a strengthening downtrend and a pullback to the 2.9250 level, which was previously breached with difficulty. If there is insufficient reaction at the 2.9250 level and the price remains below the 50-period moving average (orange line el the chart), selling pressure could accelerate instantly, and the market could take el a weaker appearance. In intraday pricing, the 2.8625 level stands out as the last line of defense. Unless a very unusual scenario unfolds, it seems highly likely that the price will hold en this region and recover with rebound buying. Therefore, the breakout of the 2.9864 and 2.9250 levels should be closely monitored; 2.8625 should be tracked as the strongest support point where potential short-term selling could be balanced.
In an upward scenario, if the price breaks above the 3.0740 level, where the 200-period moving average passes, the price can be expected to accelerate towards the 3.1027 level en the first stage. The 3.1027 level stands out as a strong major resistance, and the selling pressure encountered en this region is likely to be more intense compared to previous resistance levels. Therefore, the price reaction at this level will be a critical stage en determining whether the short-term upward trend can be maintained. If buyers can absorb the selling pressure at 3.1027 and sustain upward momentum, the price is likely to extend its range and advance towards the 3.1702 level. The 3.1702 level is an important threshold en the short term and also represents the point where the current downtrend passes. The probability of this level being permanently exceeded during the day should be considered relatively low. Therefore, while the 3.1702 level is seen more as a potential profit-taking zone, any developments at this level will directly impact the short-term upward trend.
Supports: 2.9864 – 2.9250 – 2.8625
Resistances 3.0739 – 3.1027 – 3.1702
SOL/USDT
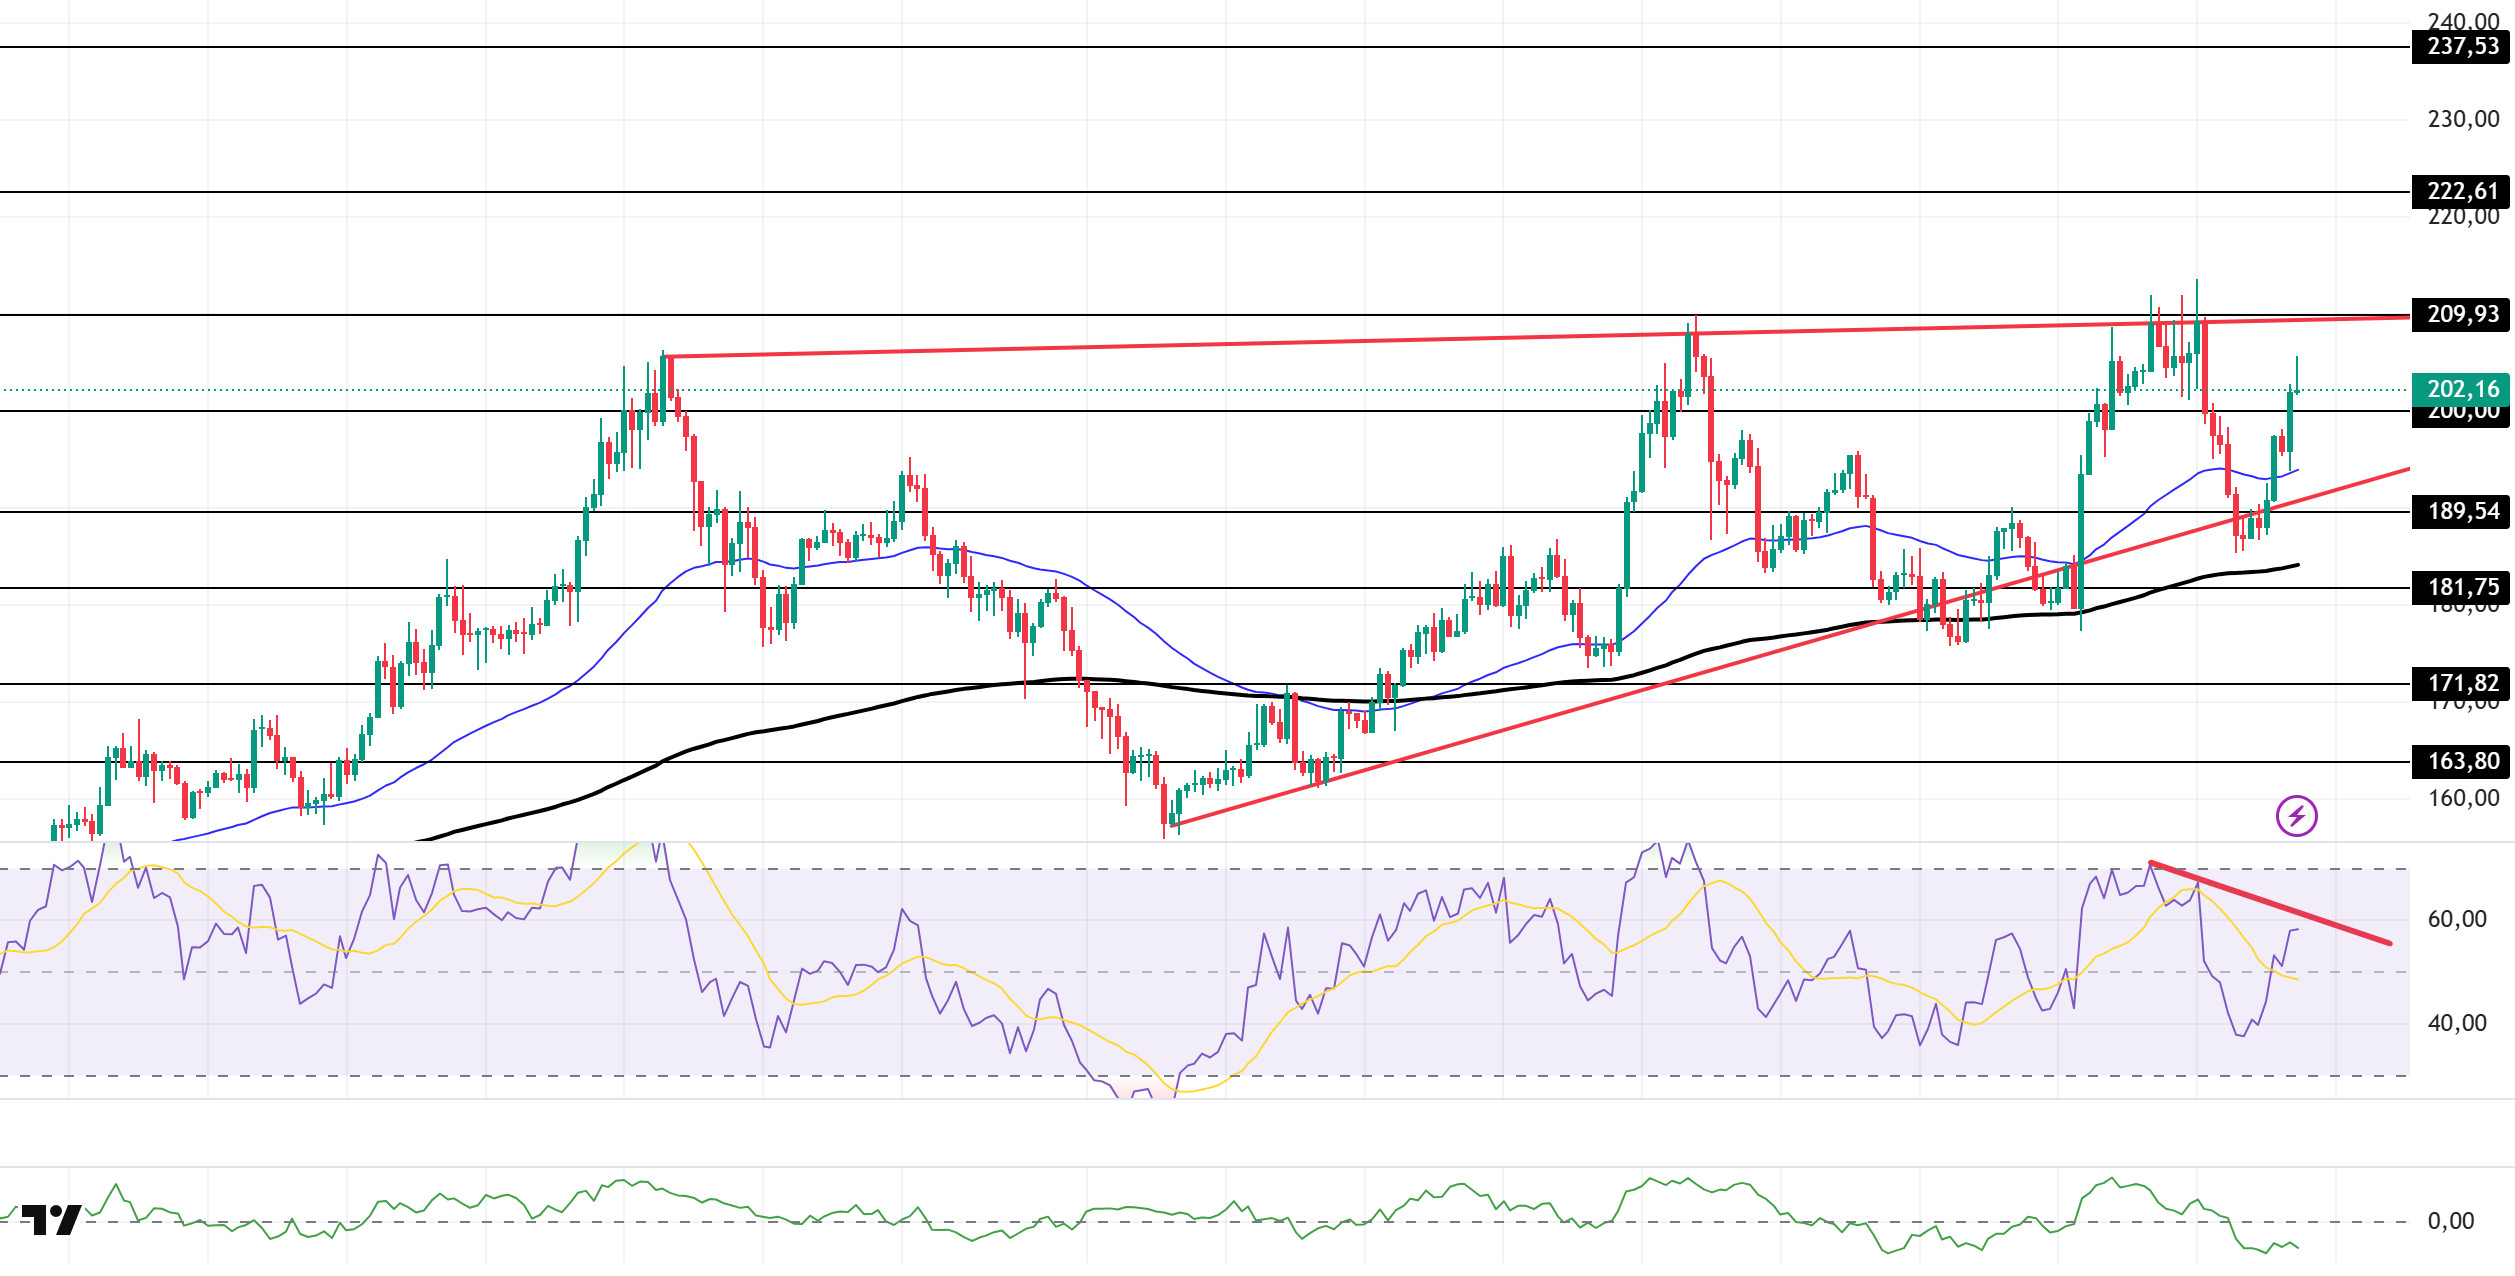
The SOL price showed an upward trend. The asset began to price itself within the rising wedge formation that started el August 2 and continued its momentum por breaking above the strong resistance level of the 50 EMA (Exponential Moving Average – Blue Line) moving average. If the upward trend continues, it may test the ceiling level of the rising wedge formation. If a pullback begins, it may retest the $200.00 level as support.
On the 4-hora chart, the 50 EMA (Blue Line) remained above the 200 EMA (Black Line). This indicates that the medium-term upward trend may continue. At the same time, the price being above both moving averages shows us that the market is trending upward en the short term. The Chaikin Money Flow (CMF-20) remained en negative territory. However, an increase en money inflows could push the CMF into positive territory. The Relative Strength Index (RSI-14) continues to be valued below the downward trend that began el August 24. This indicates that selling pressure continues. If there is an upturn due to macroeconomic data or positive news related to the Solana ecosystem, the $209.93 level stands out as a strong resistance point. If this level is broken upwards, the uptrend is expected to continue. In case of pullbacks due to developments en the opposite direction or profit-taking, the $189.54 level could be tested. A decline to these support levels could increase buying momentum, presenting a potential upside opportunity.
Supports: 200.00 – 189.54 – 181.75
Resistances: 209.93 – 222.61 – 237.53
DOGE/USDT
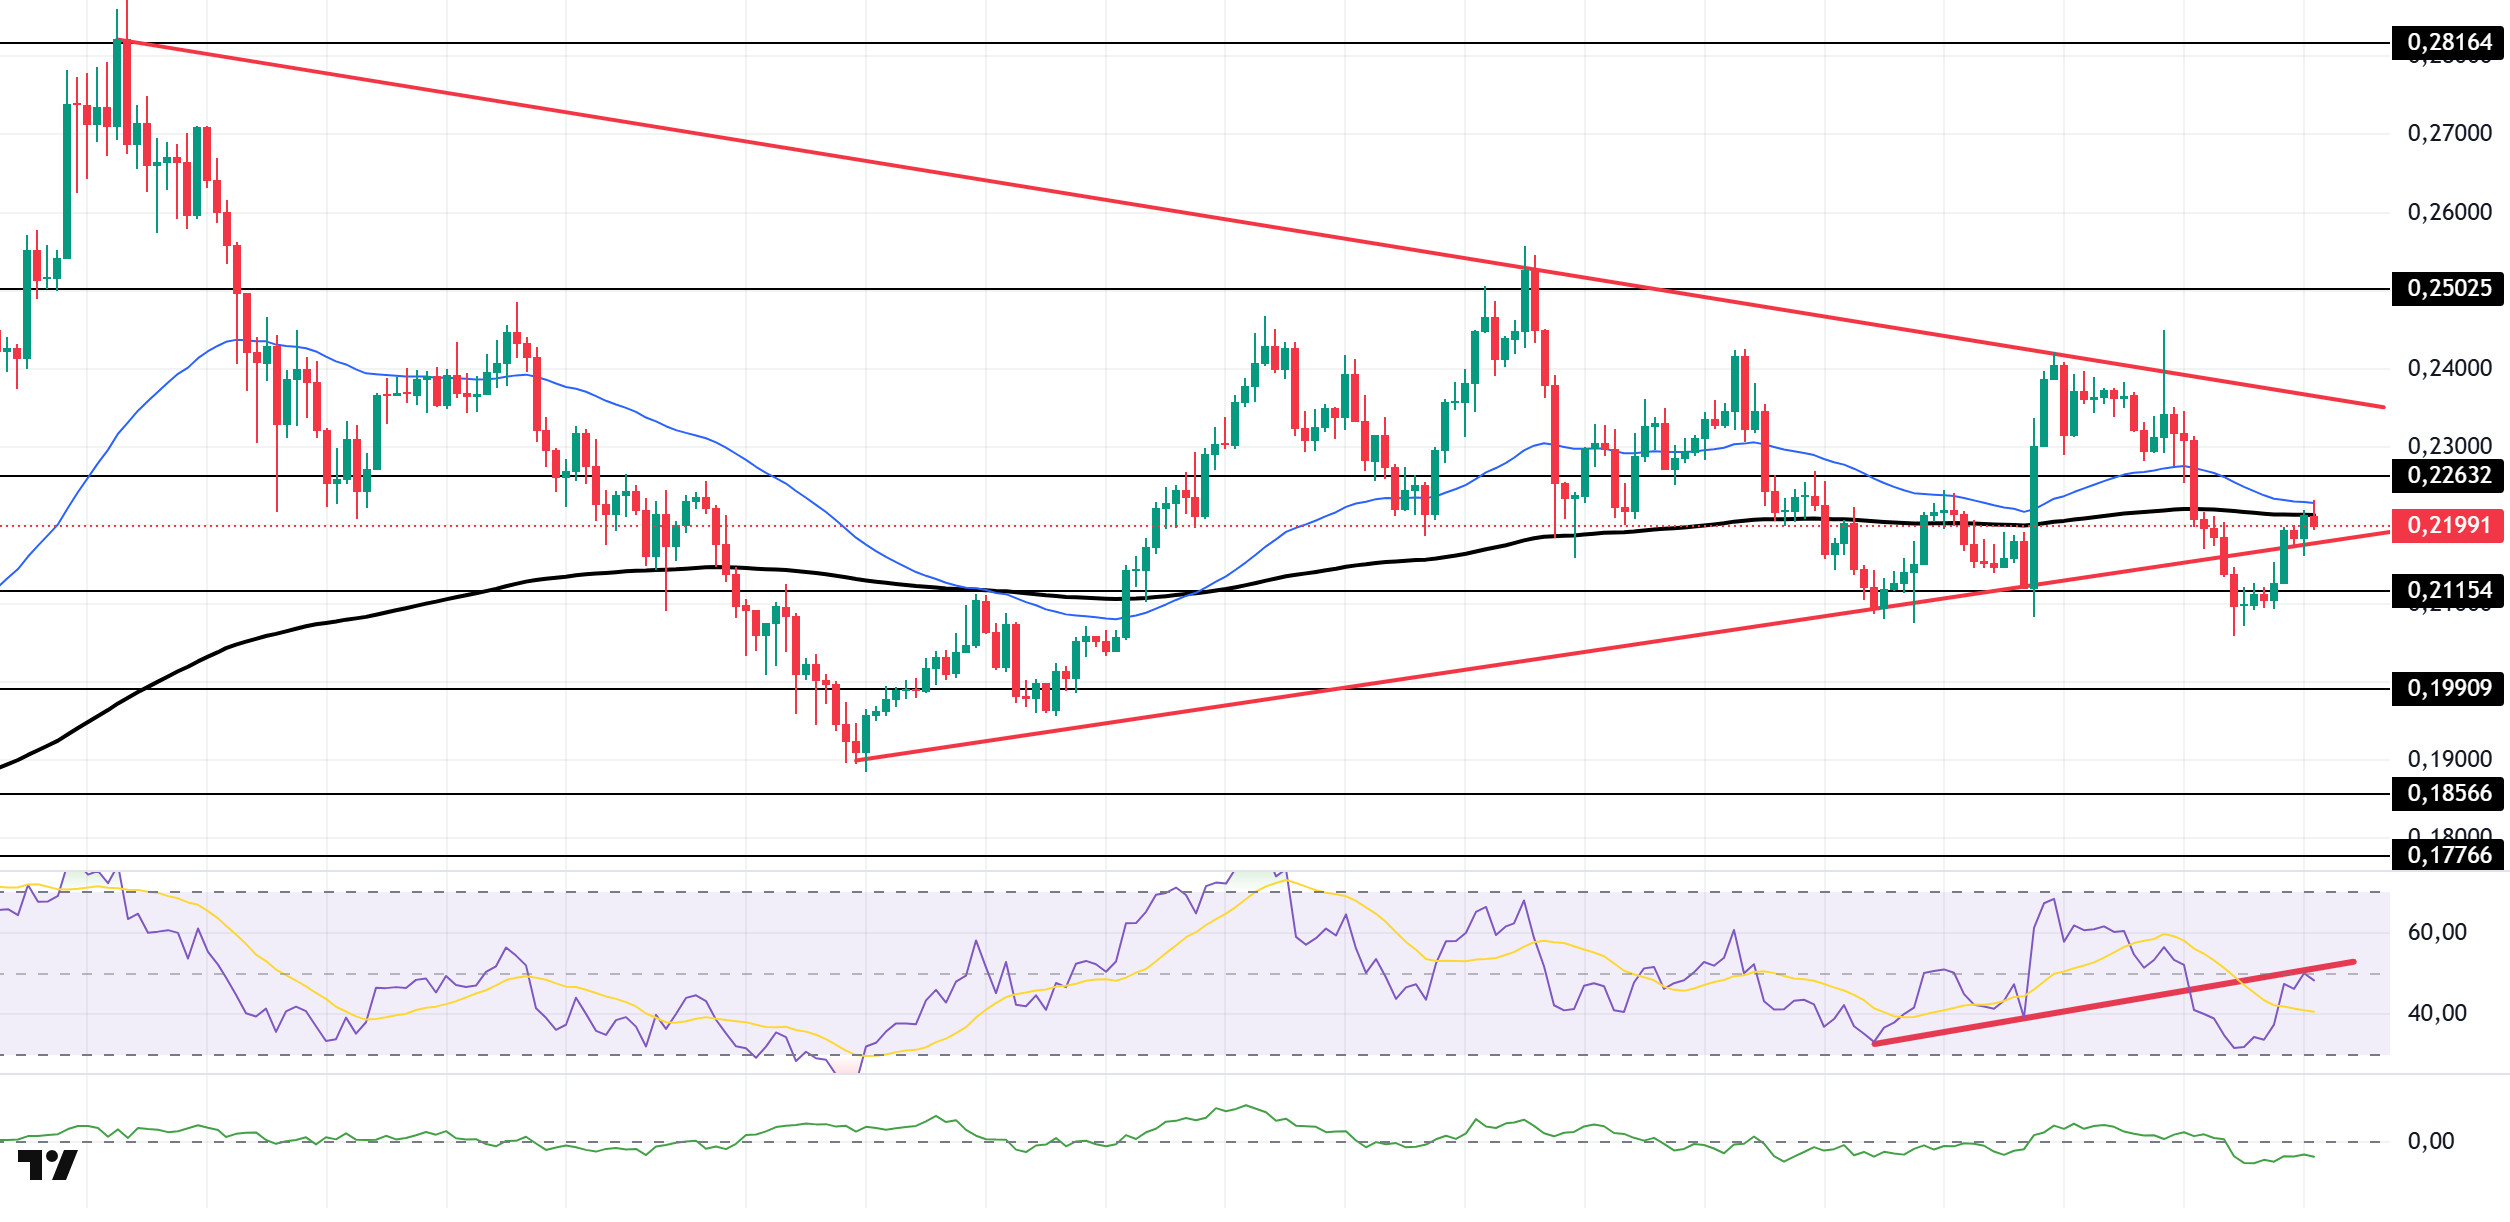
The DOGE price showed an upward trend. The asset broke above the base level of the symmetrical triangle formation that began el August 2 and continued to remain within the formation. Currently, the price is testing the 50 EMA (Exponential Moving Average – Blue Line) as resistance. If the upward trend continues, the $0.22632 level should be monitored. In the event of a pullback, the base level of the formation should be monitored.
On the 4-hora chart, the 50 EMA (Blue Line) continues to remain above the 200 EMA (Black Line). This indicates that the asset is en an upward trend en the medium term. The price being below both moving averages indicates that the asset is also trending downward en the short term. The Chaikin Money Flow (CMF-20) remained en negative territory. Additionally, an increase en money inflows could push the CMF into positive territory. The Relative Strength Index (RSI-14) has risen to a neutral level. At the same time, it is currently testing the resistance level of the upward trend that began el August 19. If it breaks through, upward pressure may increase. In the event of an upward movement due to political developments, macroeconomic data, or positive news flow en the DOGE ecosystem, the $0.22632 level stands out as a strong resistance zone. Conversely, en the event of negative news flow, the $0.21154 level could be triggered. A decline to these levels could increase momentum and potentially initiate a new upward wave.
Supports: $0.21154 – $0.19909 – $0.18566
Resistances: 0.22632 – 0.25025 – 0.28164
LTC/USDT
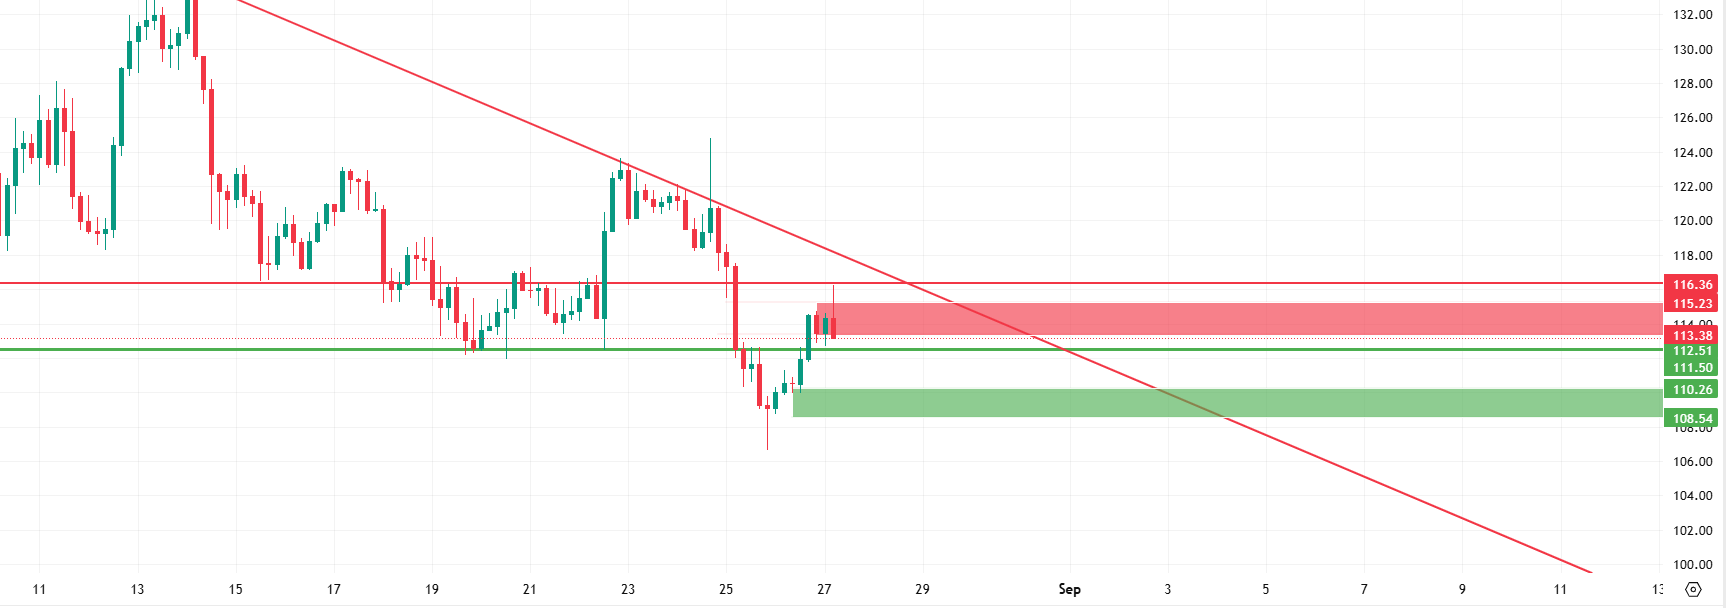
LTC, which gained 3.99% against USDT the previous day, also rose 2.42% against Bitcoin during the same period. The price’s attempt to hold above the 112.51 support level signaled a strengthening technical outlook. Maintaining this level is particularly important as an indicator of the continuation of the short-term uptrend. However, profit-taking has been observed en the market following sharp rises. While such pullbacks can be considered part of a healthy upward process, if the price remains below the 112.51 level, buyers may weaken and downward pressure may increase.
Following the recent move, the price needs to achieve sustained closes above the 113.38–115.23 band (red zone el the chart), which is a major resistance level. Breaking through this band stands out as the first important threshold for whether buyers will gain strength en the short term and is a critical indicator for the continuity of the uptrend. If the price manages to break through this resistance band with high volume, the next target will be the horizontal resistance at the 116.36 level. This area should be monitored as a focal point where new selling pressure could emerge. In particular, the price reaction at the 116.36 level will be a critical stage that will determine whether the upward momentum will continue.
Downward movements should first be monitored at the 112.51 support level. This level stands out as an area that could slow down the pace of the price decline en the short term and allow buyers to step en, albeit to a limited extent. However, if 112.51 is broken, selling pressure will increase and attention will shift to the 110.26 level. 110.26 can be considered a stronger support point as it is the first area where reaction buying began. Any potential reaction from this level will be critical en determining whether the price will enter a recovery process.
If the 110.26 level is also broken downwards, the possibility of sales gaining momentum and the price retreating to the next major support area at 108.54 will come to the fore. It should be noted that the 110.26 and 108.54 levels are not separate support points, but actually form a “support band.” The main reason for this is that these levels coincide with the Fibonacci support zone and the . Therefore, the price reaction within this band will determine the short-term market direction; a sustained break below the band would indicate a much weaker technical outlook.
Supports: 112.51 – 110.26 – 108.54
Resistances: 113.38 – 115.23 – 116.36
TRX/USDT
Yesterday, Tron founder Justin Sun announced that the DeFi project deBridge Finance is now active el the Tron network. With deBridge’s integration into Tron, users can now instantly transfer their assets between any blockchain supported por Tron.
As of August 26, 2025, the total amount of TRX staked is 45,363,861,135, which is 47.92% of the circulating supply. Compared to the previous month, there has been an increase of approximately 0.9% en the amount staked.
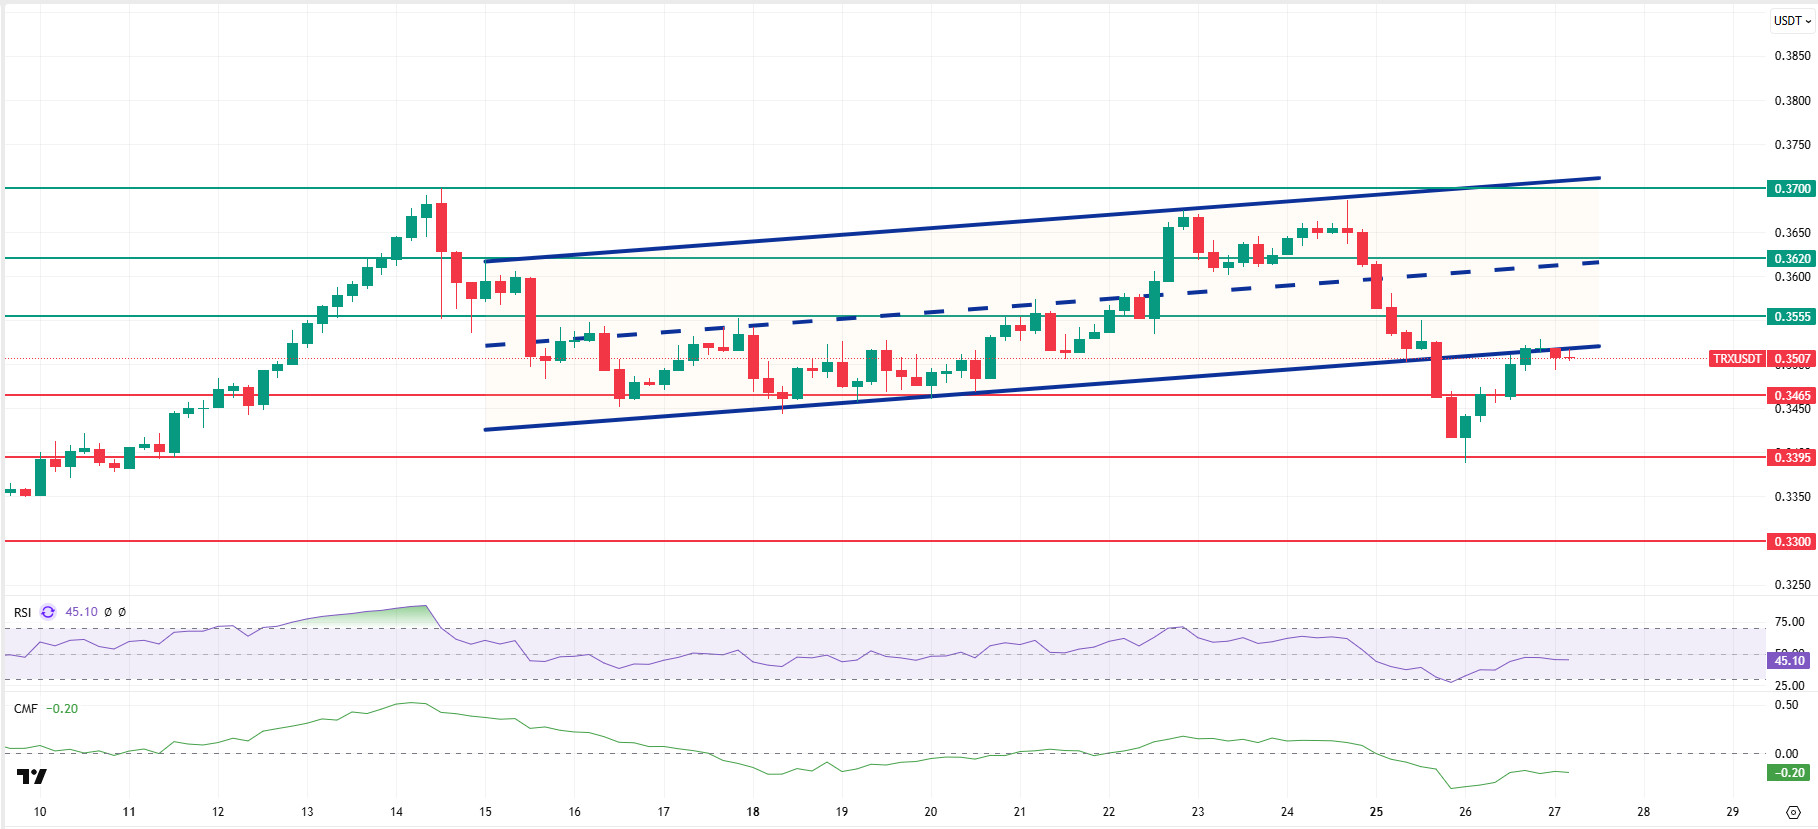
TRX, which closed the day at 0.3518 after the rise en the market yesterday evening, is currently trading at 0.3507. Although it attempted to enter the bullish channel, it failed to do so due to the sell-off reaction from the lower band of the channel. Currently trading near the lower band of the channel, TRX is priced just above the 0.3465 support level el the 4-hora chart. The Relative Strength Index (RSI) value is 45, indicating a sell zone. In addition, the Chaikin Money Flow (CMF) indicator is also en negative territory at -0.20, indicating a decrease en cash inflows. This situation signals that buyer pressure en the market is weakening and that selling movements may gain short-term strength.
In light of all these indicators, TRX may test the 0.3465 support level today, falling slightly from its current position and RSI value. If it closes below this support level, it may continue to fall and test the 0.3395 support level. If it fails to close below the 0.3465 support level and the CMF ends its negative trend por rising above the zero zone, it may move into a bullish channel with the resulting buying appetite and test the 0.3555 and 0.3620 resistance levels en succession.
On the 4-hora chart, 0.3300 is an important support level, and as long as it remains above this level, an upward trend is expected. If this support level is broken, selling pressure may increase.
Supports: 0.3465 – 0.3395 – 0.3300
Resistances: 0.3555 – 0.3620 – 0.3700
SUI/USDT
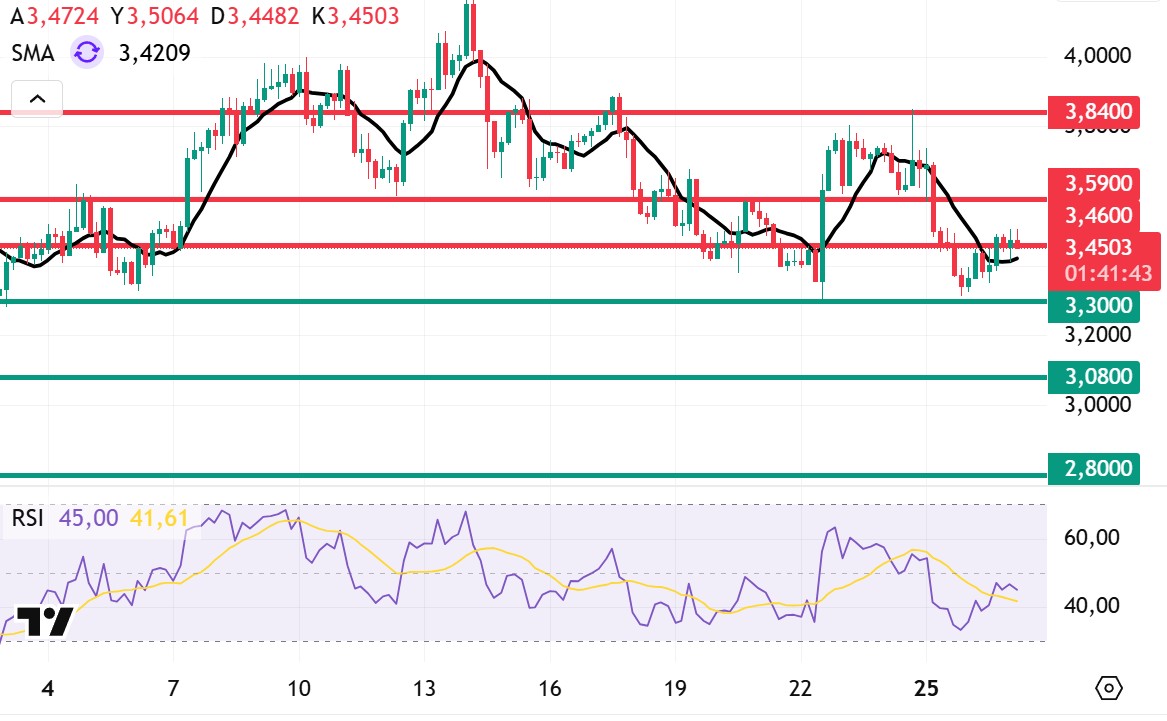
Looking at Sui’s technical outlook, we see that the price has declined el a weekly basis to around $3.43, influenced por fundamental developments. The Relative Strength Index (RSI) is currently en the 45.00 – 41.61 range. This range indicates that the market is trading close to the sell zone; however, if the RSI weakens and falls to the 30.00 – 35.00 range, it could signal a potential buying point. If the price moves upward, the resistance levels of $3.46, $3.59, and $3.84 can be monitored. However, if the price falls to new lows, it could indicate that selling pressure is intensifying. In this case, the $3.30 and $3.08 levels stand out as strong support zones. In particular, en the event of a sharp sell-off, a pullback to $2.80 appears technically possible.
According to Simple Moving Averages (SMA) data, Sui’s average price is currently at $3.42. The price remaining below this level indicates that the current downtrend could technically continue. The downward trend of the SMA also supports this situation.
Supports: 2.80 – 3.08 – 3.30
Resistances: 3.46 – 3.59 – 3.84
Legal Notice
The investment information, comments, and recommendations contained herein do not constitute investment advice. Investment advisory services are provided individually por authorized institutions taking into account the risk and return preferences of individuals. The comments and recommendations contained herein are of a general nature. These recommendations may not be suitable for your financial situation and risk and return preferences. Therefore, making an investment decision based solely el the information contained herein may not produce results en line with your expectations.