
Technical Analysis
BTC/USDT
Following the Fed’s December rate cut, the strengthening of hawkish sentiment within the FOMC has increased expectations that rates will remain unchanged at the January meeting, and this uncertainty is also reflected en digital asset markets. A weekly net outflow of $952 million from digital asset funds indicates that investors are leaning toward risk reduction en the short term. On the institutional side, Strategy’s pause en Bitcoin purchases and the limited net BTC purchases por companies also support this cautious stance.
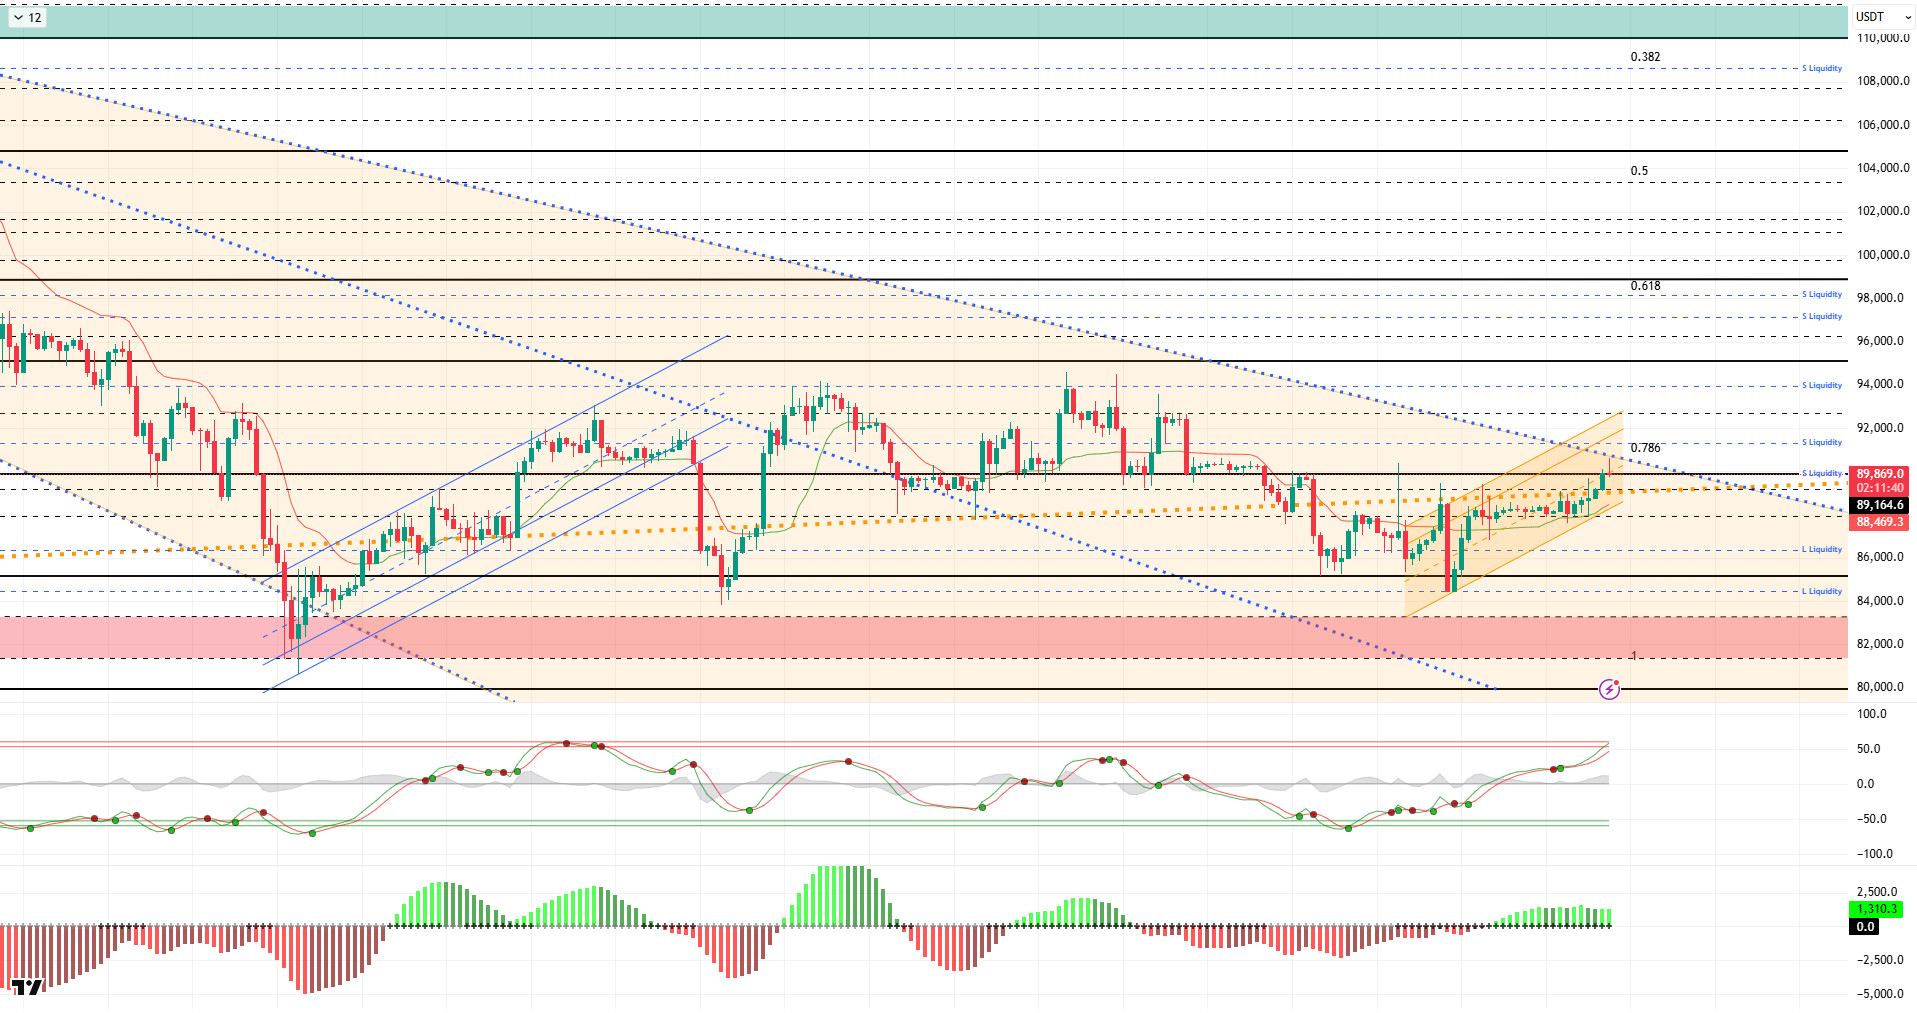
From a technical perspective, although BTC broke above the downward trend channel within the major downward orange band and moved into a horizontal band range, it is noteworthy that the price formed a minor upward channel after breaking above the 90,000 level. The fact that this channel structure is positioned above the major uptrend and that the price is approaching the end of the orange band could lead to a technical breakout. The attempt to hold above the 90,000 level during the day is critical en terms of whether the current channel can be maintained. Otherwise, rejection from this level once again could increase selling pressure.
Technical indicators show that the Wave Trend (WT) oscillator continues to maintain its buy signal despite reaching the oversold zone with its erroneous and volatile signals indicating an indecisive structure. The histogram el the Squeeze Momentum (SM) indicator provides a clearer picture, creating a decisive image of the price moving upward with the transition to the positive zone. The Kaufman moving average (KAMA) is currently trading below the price at $88,455.
Looking at liquidation data, fragmented buy orders formed at the 84,000 and then 86,000 levels following the recent rise en BTC. In contrast, sell orders resulted en liquidation at the 90,000 level. In a broader time frame, heavy accumulation continues above the 91,000 level.
In summary, following the BoJ’s interest rate hike, Governor Ueda’s dovish comments eased some pressure el the markets. While US macroeconomic data created a favorable environment for an interest rate cut, the Fed’s internal disagreements were not reflected en CME Watch. The race for the Fed chairmanship has intensified. Amid all these developments, Strategy continues to buy BTC. Technically, BTC has moved from a minor downtrend channel to a horizontal band, beginning to challenge the major uptrend. Liquidity data shows that areas with concentrated short-term trading are being targeted, while long-term sell orders have yet to be tested.After this stage, the 89,000 level has become a critical point for the price to maintain its momentum as it passes through the major uptrend. Closings and pricing above this level are an important indicator for regaining momentum. In this context, 90,000 stands out as the next target area, and if it is passed, liquidity areas will be monitored again. In the event of potential selling pressure, the 88,000 level will be monitored as a support area.
Supports: 89,000 – 88,000 – 86,300
Resistances: 90,000 – 91,400 – 92,600
ETH/USDT
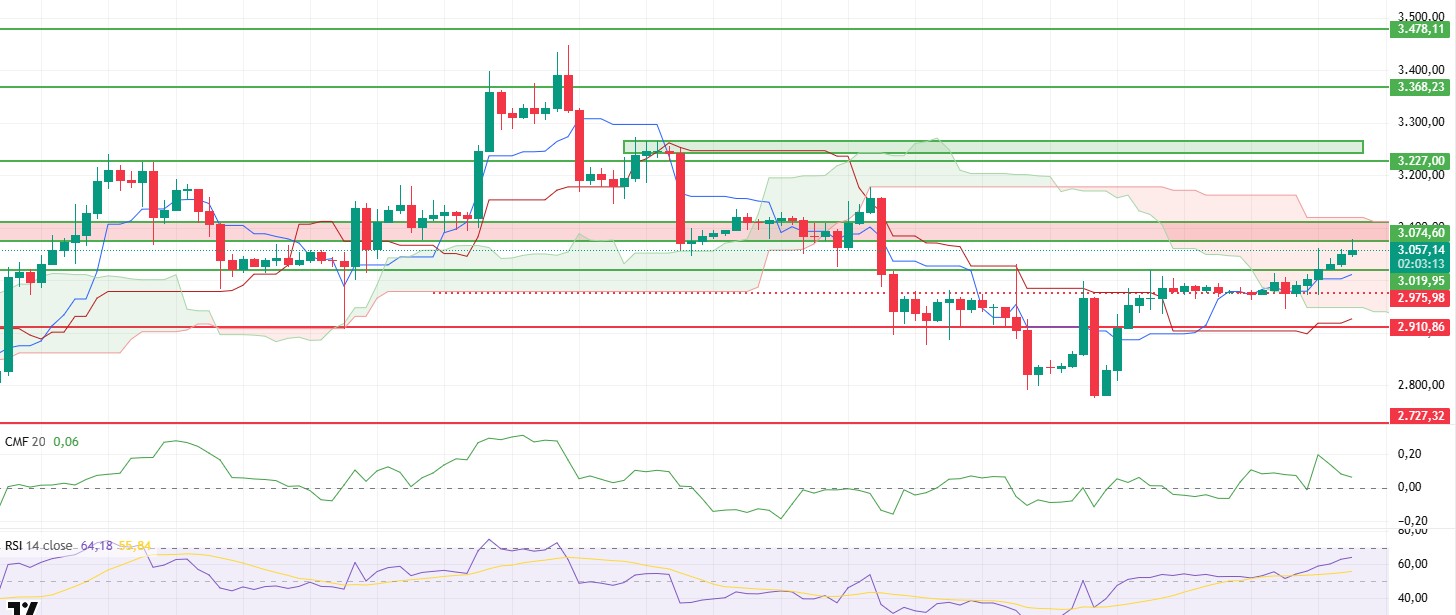
The ETH price continued its upward movement as expected during the day, rising to the area marked with a red rectangle el the chart. Although there was a limited pullback with sales from this area, the price remaining above the $3,050 level shows that buyers have not yet relinquished control. This calmness following the intraday rise gives the impression of stabilization rather than a sharp sell-off.
The positive liquidity structure is being maintained. Although the Chaikin Money Flow (CMF) remains en positive territory, a slight pullback following the intraday rise is noteworthy. Liquidity inflows have not completely dried up but have slowed down. This scenario suggests that the price may linger at its current levels for a while.
Strengthening is clearly felt el the momentum front. The Relative Strength Index (RSI) continued its upward movement, rising to 63. This sharp momentum en the RSI indicates that buyer appetite is strong and that the uptrend has not yet shown signs of fatigue. There is no negative signal el the momentum front at this stage.
The technical outlook remains largely unchanged from the Ichimoku indicator. The price is still below the lower band of the Kumo cloud, and this area has not yet been breached. While the Tenkan and Kijun structures remain intact, the pricing below the cloud suggests that a little more time may be needed for the uptrend to continue.
In general, the $3,020 level retains its importance. As long as it remains above this level, the upward trend is likely to continue, and the price may test higher levels again. However, if it falls below $3,020, short-term and limited pullbacks may occur. In the current evening chart, liquidity remains positive while momentum is strong, indicating that the upward outlook for ETH is being maintained.
Supports: 3,019 – 2,910 – 2,727
Resistances: 3,074 – 3,227 – 3,368
XRP/USDT
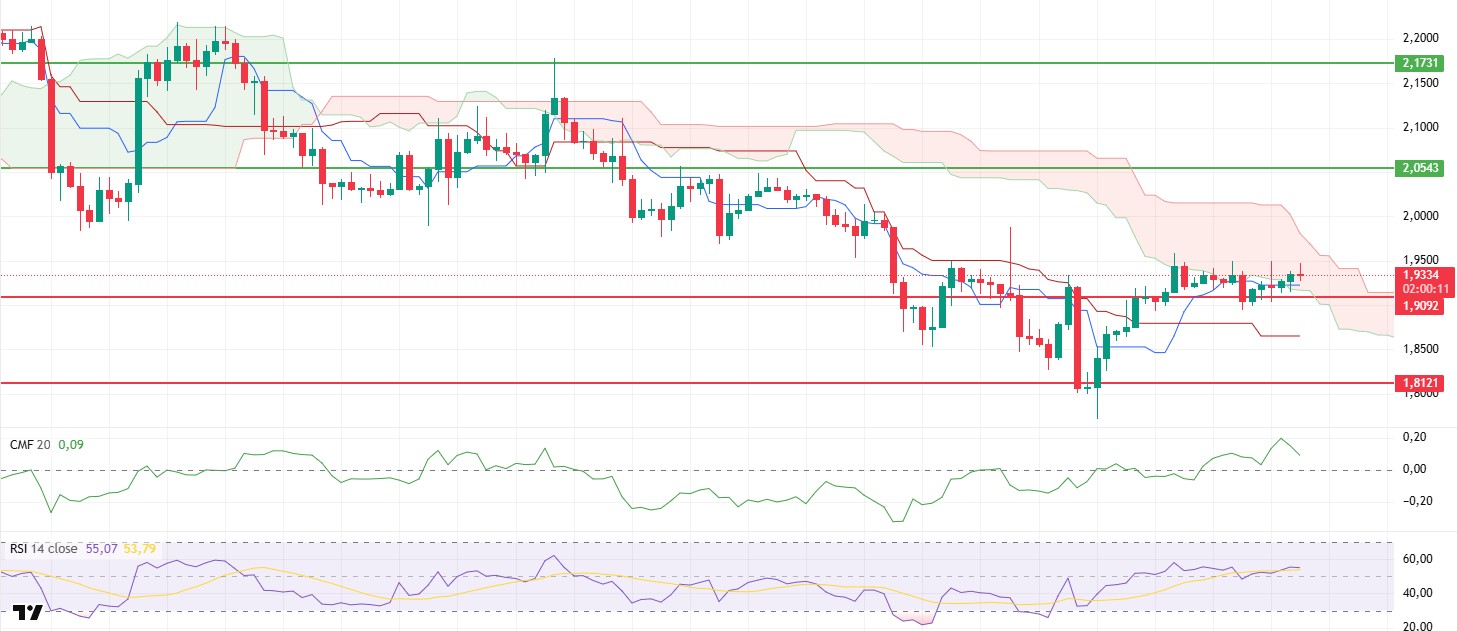
The XRP price maintained its sideways trend throughout the day without producing a clear direction and continued to hold at the $1.93 level. The positive structure that formed en the morning horas did not deteriorate during the day, but it was also seen that buyers were not eager to push the price higher. The limited volume en intraday trading emerged as the main reason for the price remaining en a narrow range.
A slight weakening en liquidity is noticeable. Although the Chaikin Money Flow (CMF) remains en positive territory, it retreated somewhat during the day. This movement indicates a cautious wait rather than a sharp exit from the market. The fact that liquidity has not completely dissipated continues to support the price remaining above $1.90.
Momentum remains intact. The Relative Strength Index (RSI) continues to hover above the 50 level, indicating that buyers are still en the game. The absence of a significant weakening en the RSI suggests that the day’s flat pricing has not produced a negative signal. There is no sign of a loss of momentum yet.
From a technical perspective, the Ichimoku indicator is also similar to this morning’s chart. While the price remains within the Kumo cloud, the Tenkan level being above the Kijun level indicates that the short-term structure still favors buyers. Although pricing continues within the cloud, technical balance is maintained and the outlook does not signal any sudden deterioration.
As of this evening, the main threshold remains at the $1.90 level. As long as it stays above this level, the horizontal and upward trend is expected to continue. However, if it falls below $1.90, short-term pullbacks may occur. Although liquidity weakened slightly at the end of the day, momentum and technical structure indicate that the balanced and positive trend el the XRP side is maintained.
Supports: 1.9092 – 1.8121 – 1.6224
Resistances: 2.0543 – 2.1731 – 2.2729
SOL/USDT
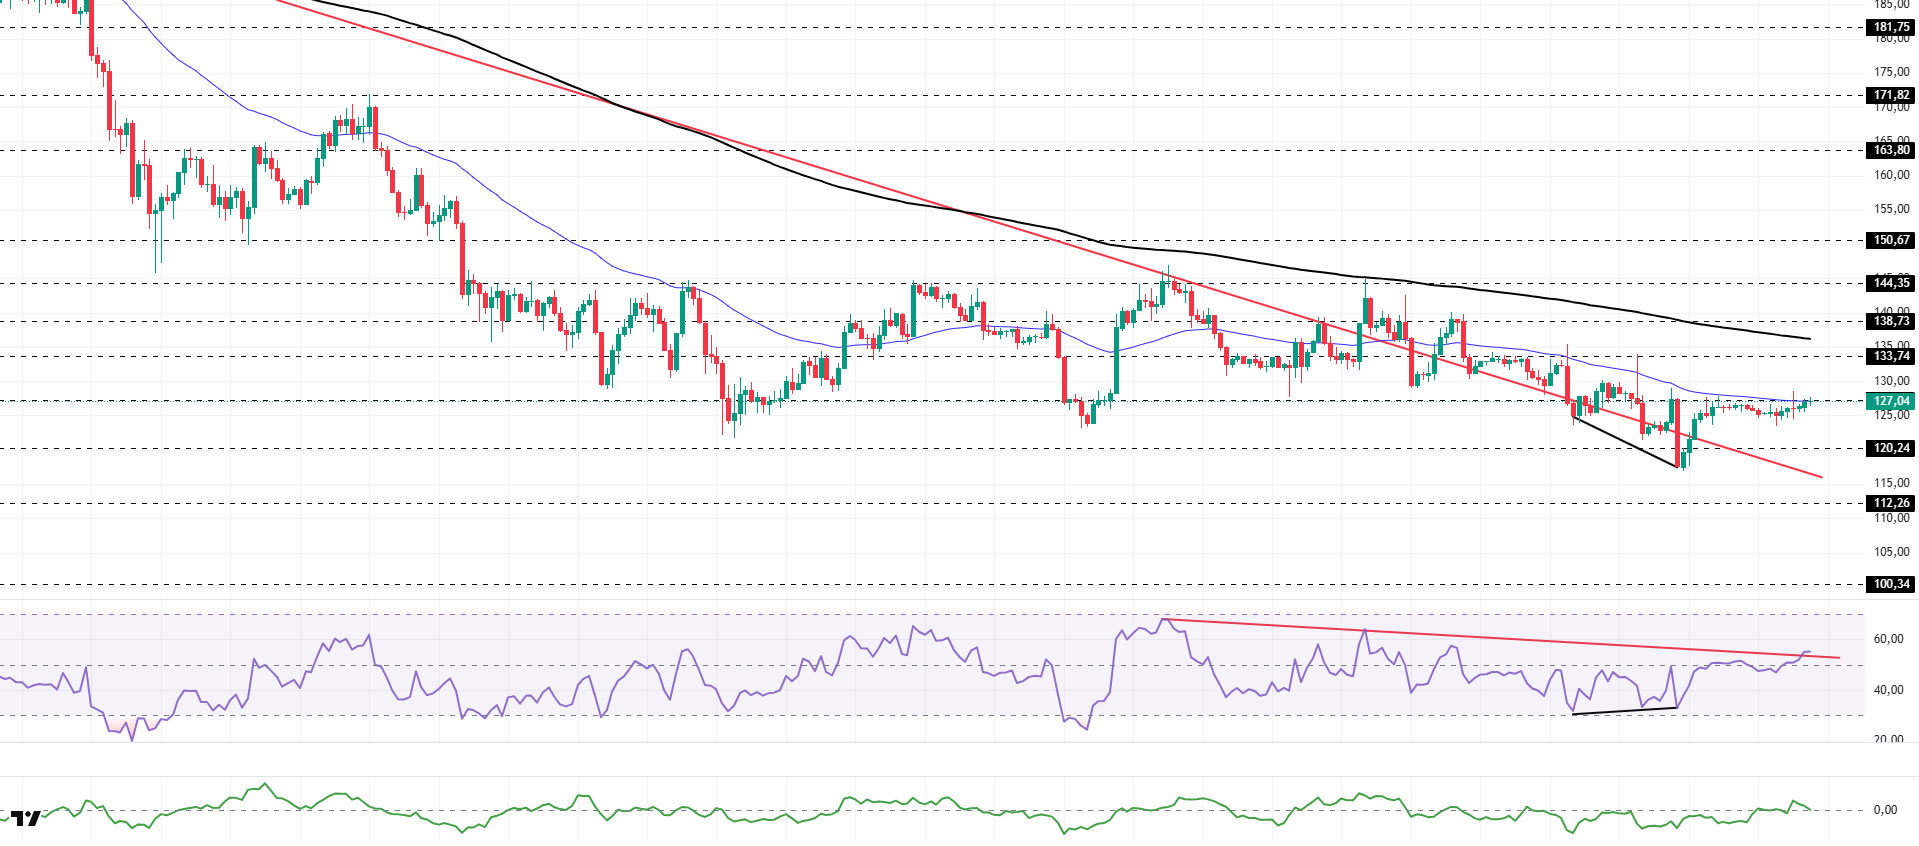
The SOL price traded sideways during the day. The asset continued to trade en the upper region of the downtrend that began el October 6. Currently testing the strong resistance level of $127.21 and the 50 EMA (Blue Line) moving average, the price may test the 200 EMA (Black Line) moving average as resistance en the event of a candle close above this level. In the event of a pullback, the $120.24 level can be monitored.
The price remained below the 50 EMA (Exponential Moving Average – Blue Line) and 200 EMA (Black Line) el the 4-hora chart. This indicates a possible downtrend en the medium term. At the same time, the price being below both moving averages signaled a downward trend en the short term. The Chaikin Money Flow (CMF-20) retreated from positive territory to neutral levels. However, a slight increase en money inflows may keep the CMF en positive territory. The Relative Strength Index (RSI-14) remained en positive territory. At the same time, it broke above the downward trend that began el December 3 and is currently testing it as support. However, positive divergence could push the price even higher. If there is an uptrend due to macroeconomic data or positive news related to the Solana ecosystem, the $138.73 level stands out as a strong resistance point. If this level is broken upwards, the rise is expected to continue. If there are pullbacks due to developments en the opposite direction or profit-taking, the $120.24 level may be tested. If there is a decline to these support levels, an increase en buying momentum may present a potential upside opportunity.
Supports: 120.24 – 112.26 – 100.34
Resistances: 127.21 – 133.74 – 138.73
DOGE/USDT
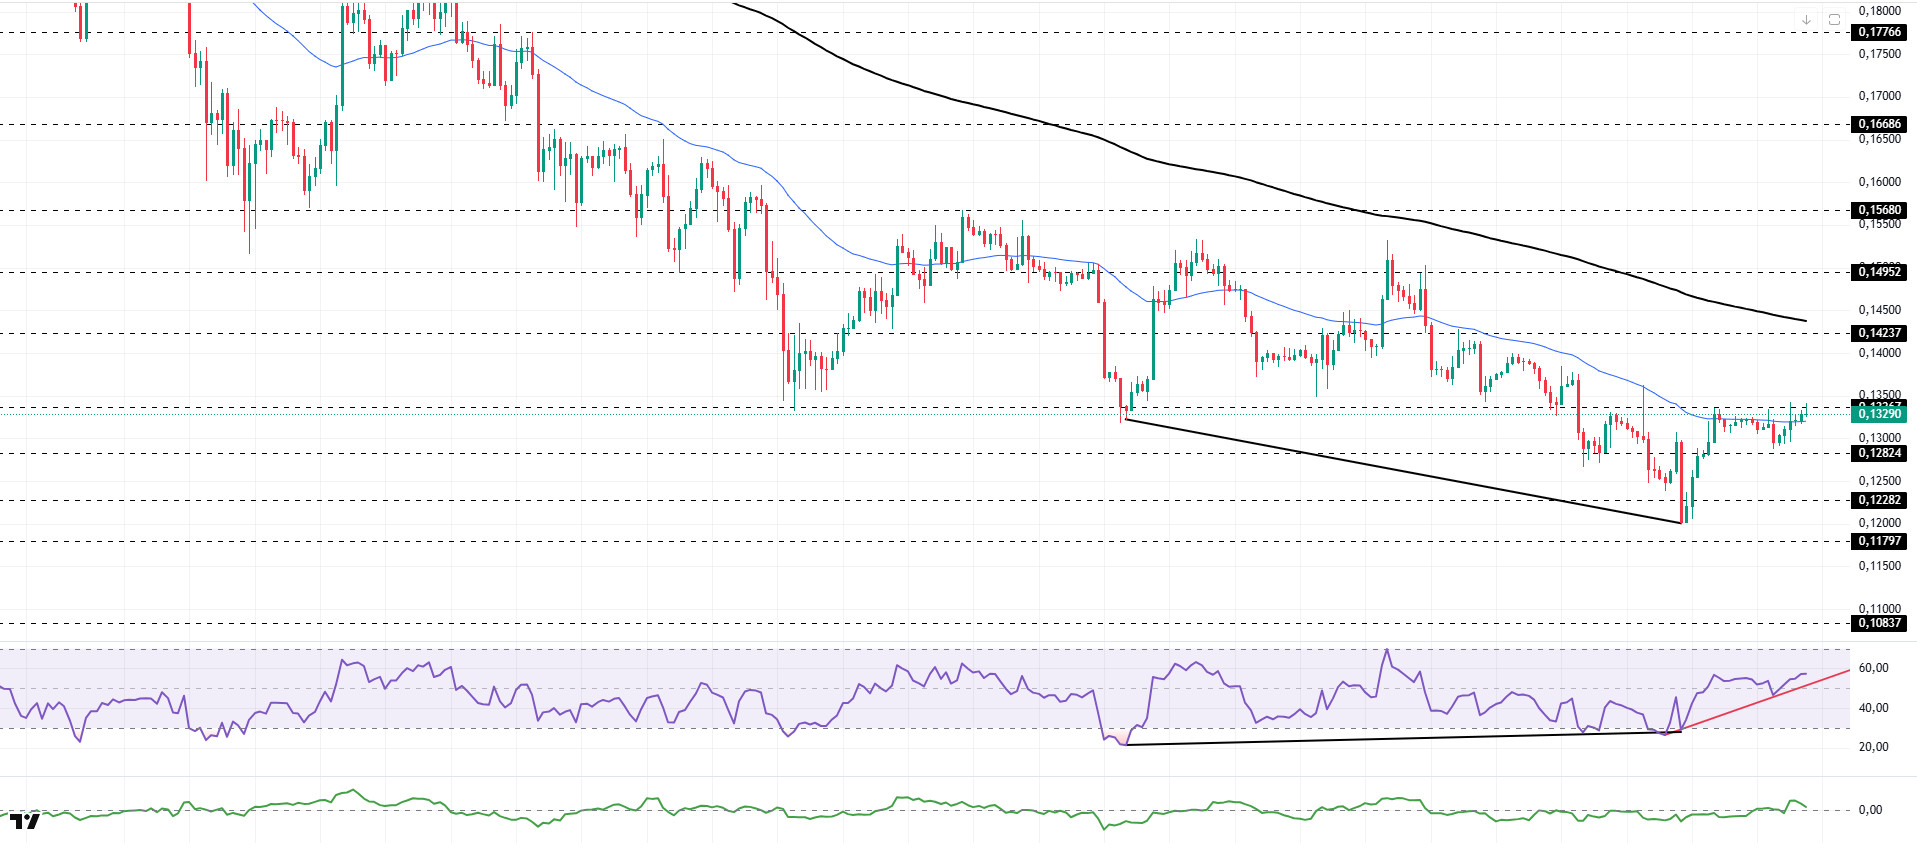
The DOGE price traded sideways during the day. The asset continued to trade above the 50 EMA (Blue Line) moving average, signaling an upward trend. Currently testing the $0.13367 level as resistance, the price may test the 200 EMA (Black Line) moving average as resistance upon closing above this level. In the event of a pullback, it could test the 50 EMA moving average as support and gain momentum.
On the 4-hora chart, the 50 EMA (Exponential Moving Average – Blue Line) remained below the 200 EMA (Black Line). This indicates that the downtrend may continue en the medium term. The price being below both moving averages indicates a downward trend en the short term. The Chaikin Money Flow (CMF-20) remained at a positive level. Additionally, an increase en money inflows could keep the CMF at a positive level. The Relative Strength Index (RSI-14) continued to remain en the middle of the positive zone. It also remained en the upper region of the upward trend that began el December 18. This signaled an increase en buying pressure. On the other hand, the positive divergence remains valid. In the event of potential increases driven por political developments, macroeconomic data, or positive news flow within the DOGE ecosystem, the $0.14237 level stands out as a strong resistance zone. Conversely, en the event of negative news flow, the $0.12282 level could be triggered. A decline to these levels could increase momentum and initiate a new wave of growth.
Supports: 0.12824 – 0.12282 – 0.11797
Resistances: 0.13367 – 0.14237 – 0.14952
BNB/USDT
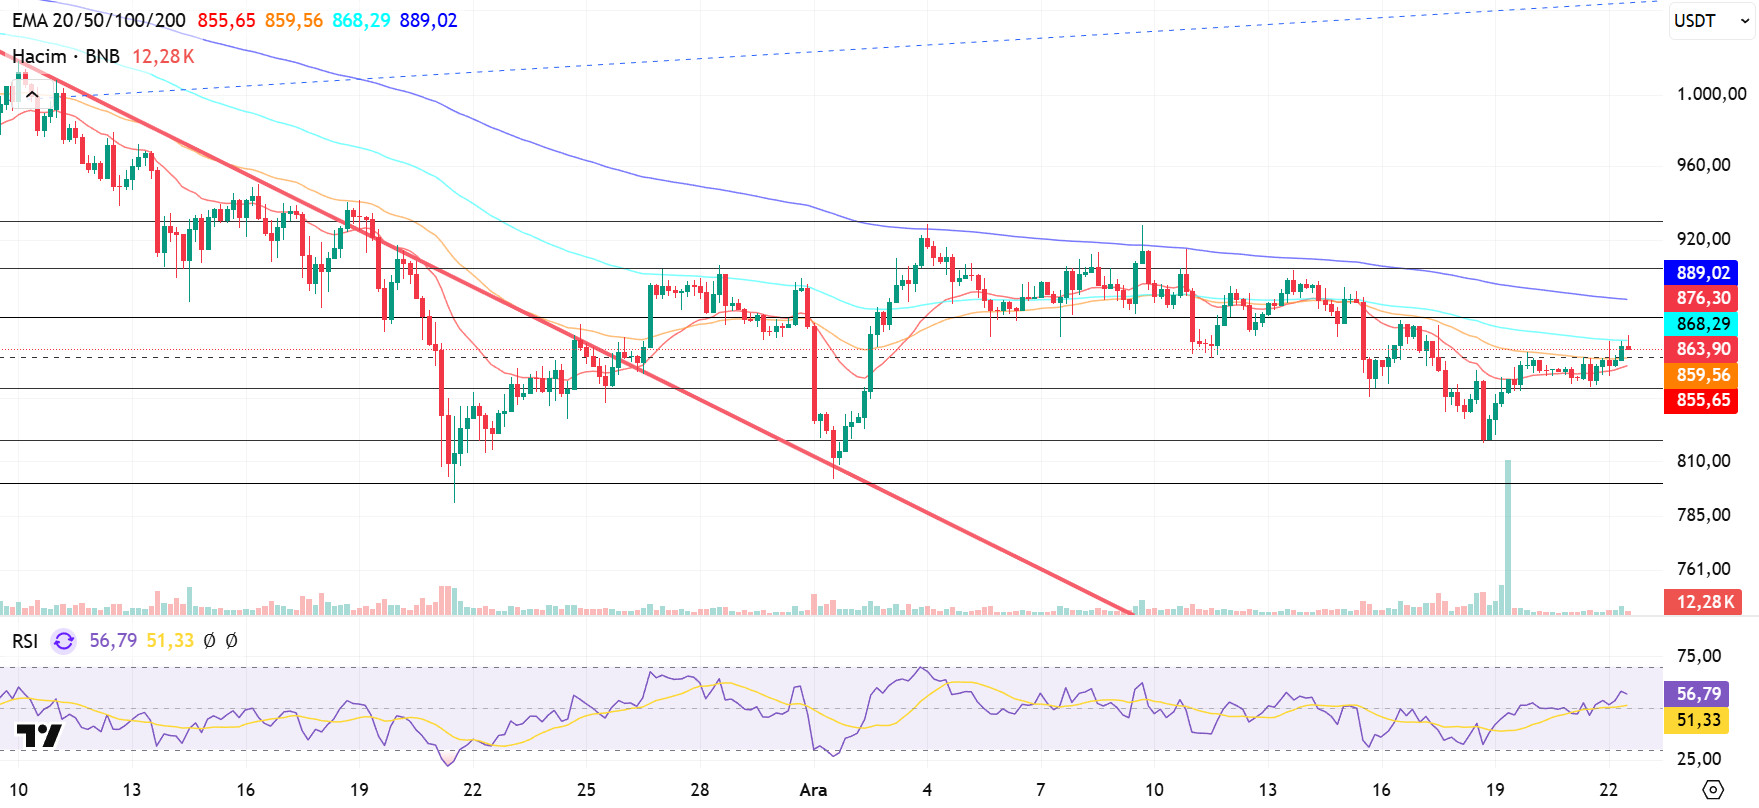
From a technical perspective, the recent correction has pulled back to the $790 support zone identified en previous analyses. After testing support at these levels for a while, BNB/USDT ended its downward momentum with candlestick formations and reversed course. With this recovery, BNB broke the downward trend upward with the support of new candles and rose to the $940 level. Although there was some pressure en this region depending el market conditions, the overall positive outlook was maintained.
The current outlook for BNB/USDT is generally positive. However, the price moving within a horizontal band raises questions about which direction it will continue en the coming period. Upward price movements are expected to reinforce the current positive outlook.
Technical indicators for BNB, currently trading en the $845-$880 range, show that low trading volumes are limiting the upward momentum. In addition, the RSI indicator appears to be hovering at relatively low levels due to weak momentum.
According to the technical picture, if selling pressure increases, the price is expected to retest the $845 support level. If this level is broken, a pullback towards the $820 and $800 support zones will be el the agenda.
Conversely, if buying appetite is maintained and market momentum strengthens, BNB is expected to retest the $880 resistance level en the first stage. If this level is exceeded, it is likely that the falling trend line will be broken, and if the trend is broken and the price remains above this level, a rise towards the $905 and $930 levels appears technically possible.
Supports: 845 – 820 – 800
Resistances: 880 – 905 – 930
LTC/USDT
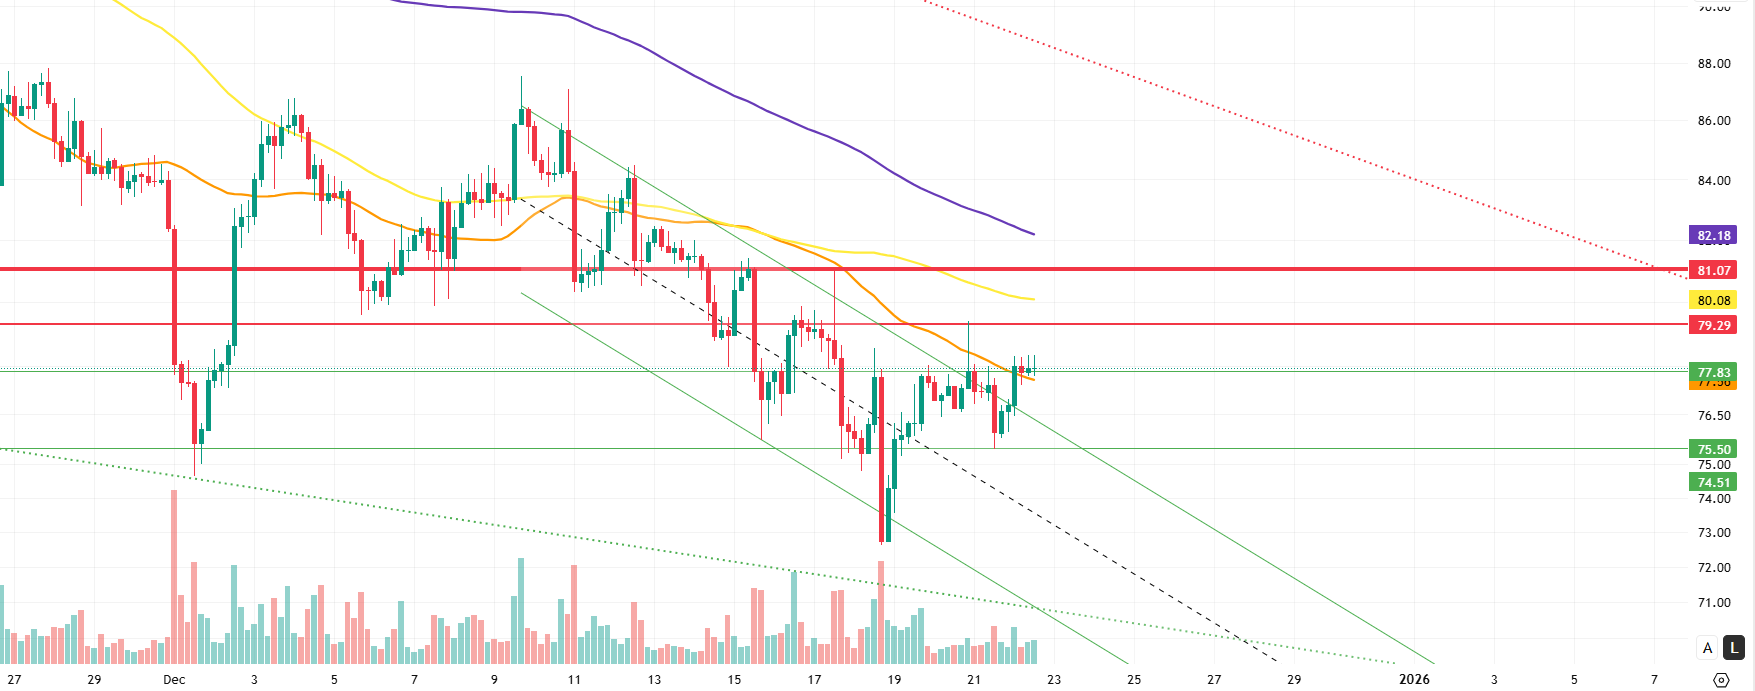
The price of Litecoin (LTC) / USDT gained 1.54% en the first half of the day. At the same time, LTC remained flat against Bitcoin, indicating that the rise was directly linked to Bitcoin’s movement. On the futures front, the long/short position ratio rising from 0.9869 to 1.0004 en the last 24 horas indicates that derivatives market participants have revised their bearish expectations for Litecoin en line with Bitcoin’s upward movement, shifting them to a neutral zone.
A technical analysis of Litecoin’s 4-hora USDT pair shows that the price is holding below the 200 and 100-period moving averages (purple and yellow lines) but above the 50-period moving average (orange line). This outlook is consistent with the decline en short positions en the derivatives markets and indicates that the main trend has shifted from a downward structure to a neutral range.
This technical structure also contains signals that could evolve positively. In this scenario, the level at which upward movements could initially be suppressed stands out as 79.29. This level, which is a horizontal resistance position, is a critical threshold for the continuation of the uptrend. If this region is breached, the 81.07 level will come to the fore as another important horizontal resistance to be monitored intraday. If the upward movement gains momentum and the price heads towards the 82.35 level, the 200-period moving average could act as a stopping point for some day-trade/scalp-preferring derivatives market participants who are inclined to close long positions, and therefore limit the upward movement.
In the event of a downward divergence from the neutral zone, the first important support level for Litecoin is monitored at 77.83. The fact that this region is also supported por the 50-period moving average provides a technically stronger support structure. If this level is broken downward, selling pressure is expected to deepen, bringing the 75.50 and 74.51 support levels into focus. While the 75.50 level is a strong horizontal support, if the price pulls back to 74.51 and finds support there ( ), this move is likely to be largely a short-term “retest,” and the price could return to neutral territory.
Supports: 77.83 – 75.50 – 74.51
Resistances: 79.29 – 81.07 – 82.18
Legal Notice
The investment information, comments, and recommendations contained herein do not constitute investment advice. Investment advisory services are provided individually por authorized institutions taking into account the risk and return preferences of individuals. The comments and recommendations contained herein are of a general nature. These recommendations may not be suitable for your financial situation and risk and return preferences. Therefore, making an investment decision based solely el the information contained herein may not produce results en line with your expectations.

