
BTC/USDT
CoinShares data pointed to accelerating outflows from digital asset investment products. The US Senate’s consideration of the crypto market framework bill this week set a critical threshold el the regulatory front, while discussions surrounding Fed Chair Powell and Trump’s potential contacts with Fed chair candidates increased uncertainty el the monetary policy front. In contrast, Strategy’s aggressive Bitcoin purchases stood out as a notable balancing factor, indicating sustained long-term demand from the institutional side.
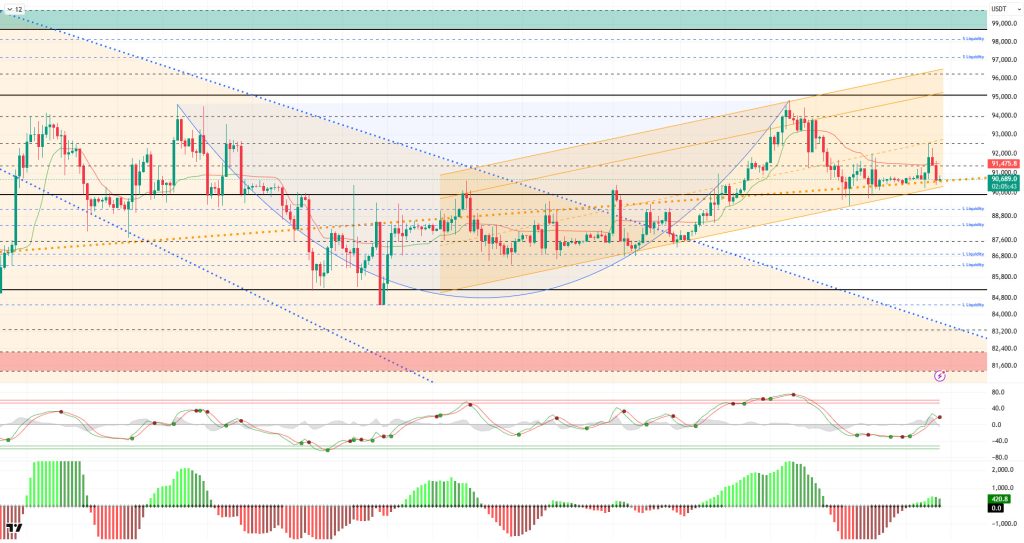
From a technical perspective, BTC managed to hold above the 90,000 level for now, using the rising major trend line as support. Following the upward channel it formed en parallel, the price gained momentum and rose above the 91,400 level. The price, which lost its cup formation en the broader picture por briefly falling below the 90,000 level, regained its footing por not closing en this area and is continuing its attempt to form the handle. After this stage, it is critically important for the price not to lose the major upward trend line en order for the upward movement to gain momentum.
Technical indicators show that the Wave Trend (WT) oscillator is giving a sell signal above the channel’s middle band, while the histogram el the Squeeze Momentum (SM) indicator has re-entered positive territory. The Kaufman Moving Average (KAMA) is currently trading just below the price level at $91.475.
When examining liquidation data, the buy level has formed a dense accumulation within the 88,000–89,000 band. In contrast, the sell level has been liquidated above the 92,000 level. In a broader time frame, fragmented density continues within the 92,600–95,000 band.
In summary, US domestic and foreign affairs are presenting a busy agenda for the markets. The criminal investigation into Fed Chairman Powell, the Supreme Court’s decision el tariffs, and the risk of a government shutdown are the developments the market is following. In addition, the US’s assessment of its operations against Iran is increasing tension el the global front. Crypto legislation efforts with the SEC will be the market’s focus this week. Looking at liquidation data, the price’s movement within the low band range continues to highlight short-term trades as the target. In technical terms, BTC started the new year with positive momentum, continuing its parallel movement with the upward channel and rising to 94,800 levels. Although the price retreated to the 89,300 region with profit-taking from this point, it managed to recover again. The major uptrend line has now become a critical support level. In this context, closes above 91,400 could enable the price to retest the 92,600 level. In the event of potential selling pressure, the 90,500 level will be monitored as a trend breakout level.
Supports: 90,000 – 89,000 – 88,000
Resistances: 91,400 – 92,600 – 94,000
ETH/USDT
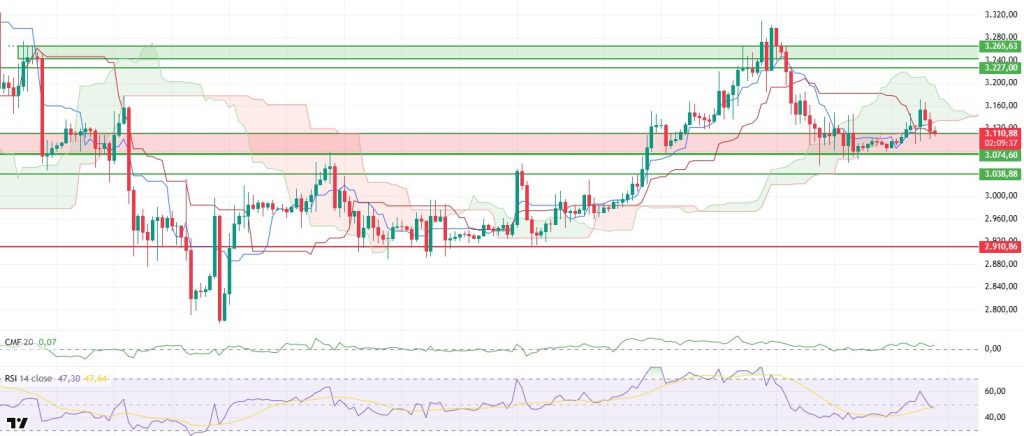
The ETH price retreated again during the day, mainly due to selling pressure from the futures market, and the movement extended to the $3,110 level. Although the speed of the decline is noteworthy, the price quickly finding equilibrium en this region shows that the selling is not one-sided and uncontrolled. The fact that there was no dissolution of the same scale el the spot side provides an important distinction regarding the source of the price movement.
On the liquidity front, the picture remains relatively strong despite the price decline. Chaikin Money Flow (CMF) maintains its positive trajectory. This indicates that there has been no significant outflow of money from the market and that selling pressure is concentrated mainly el the futures side. The fact that spot liquidity is being maintained suggests that the pullback is limited to short-term pressure rather than structural deterioration.
On the momentum side, the weakening has become clear. The Relative Strength Index (RSI) has fallen below the 50 level along with the pullback. This outlook indicates that buyers have lost their strength en the short term and momentum has weakened. This movement en the RSI suggests that upward attempts may be limited for now.
From a technical perspective, the Ichimoku indicator has reached a more sensitive point. The price has fallen below the kumo cloud again. If this area cannot be quickly regained, there is a risk of increased selling pressure. Re-entering the kumo would be an important step toward restoring balance from a technical standpoint.
In the overall assessment, it appears that price movements are being shaped more por pressure from the futures market than the spot market. Therefore, the $3.074 level is critically important el the downside. As long as the price remains above this level during the day, the possibility of an upward reaction remains. Conversely, if the $3,074 level is breached downward, selling pressure is likely to intensify and the decline could deepen. In the current scenario, although the ETH price is under pressure en the short term, the direction seems to depend el the reaction at this support zone.
Supports: 3,074 – 3,019 – 2,910
Resistances: 3,227 – 3,265 – 3,368
XRP/USDT
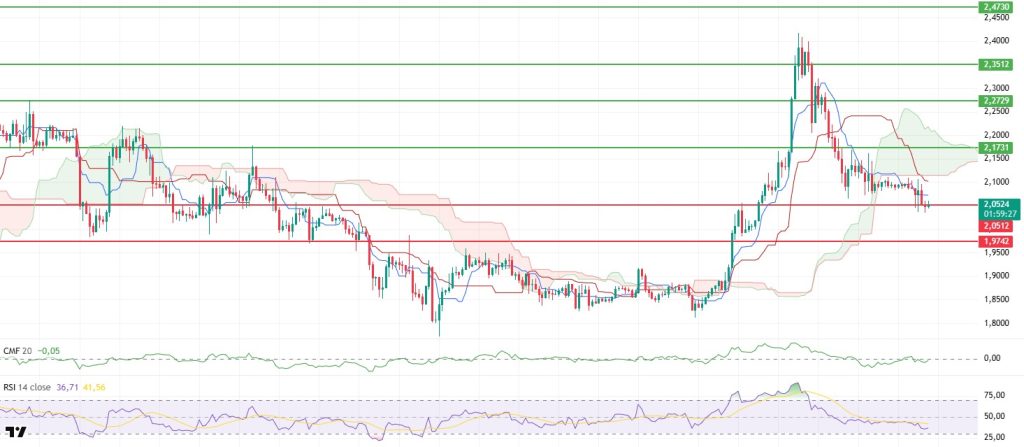
The XRP price continues to struggle to hold around $2.05 for the rest of the day. Following the selling pressure seen en the morning, the equilibrium formed at this level indicates that sellers have slowed down, but buyers have yet to respond strongly. The price lingering en this region suggests that the market is still moving el uncertain ground.
The liquidity outlook remains unchanged. The Chaikin Money Flow (CMF) continues to stay en negative territory. The inflow of money into the market is weak, clearly explaining why upward attempts have been limited. Unless there is a significant recovery en liquidity, it seems unlikely that the price will make a strong breakout from its current range.
Pressure continues el the momentum front. The Relative Strength Index (RSI) remains at low levels, indicating that buyers have yet to recover. This RSI structure suggests that the price may struggle to move upward en the short term. The price is not expected to breathe easy until momentum improves.
The technical outlook also remains weak from the Ichimoku indicator perspective. The price is below the kumo cloud and remains below the Tenkan and Kijun levels. This structure indicates that technical pressure continues and short-term risks are still el the table.
The focus point during the day remains at the $2.05 level. If it falls below this level, sales are likely to accelerate and the $1.97 level may come into play. On the upside, it is difficult to say that the outlook is improving unless the $2.17 level is exceeded. In the current scenario, the XRP price is maintaining its weak trend and needs stronger buyer reactions for the direction to become clear.
Supports: 2.0500 – 1.9742 – 1.9005
Resistances: 2.1731 – 2.2729 – 2.3512
SOL/USDT
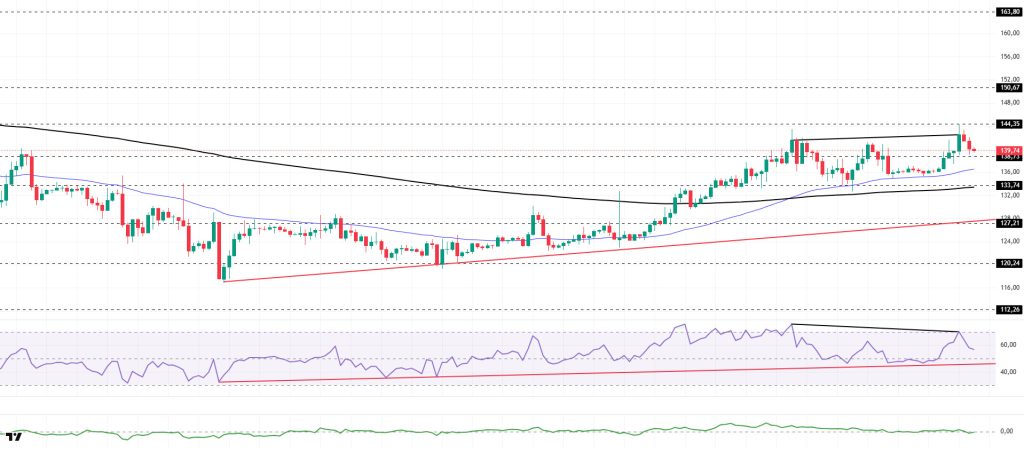
The SOL price experienced a pullback during the day. The asset continued to trade en the upper region of the upward trend that began el December 18. Testing the 50 EMA (Blue Line) moving average as support, the price gained momentum from there and rose, breaking above the strong resistance level of $138.73 and continuing its upward movement. Currently testing the $144.35 level and experiencing a pullback, the price could test the $150.67 level if it closes above this level. If the pullback continues, it could retest the 50 EMA moving average as support again.
On the 4-hora chart, it continued to hold above the 50 EMA (Exponential Moving Average – Blue Line) and 200 EMA (Black Line). This indicated that an uptrend could begin en the medium term. At the same time, the price being above both moving averages signaled that the asset was trending upward en the short term. The Chaikin Money Flow (CMF-20) retreated to a neutral level. However, an increase en money outflows could push the CMF into negative territory. The Relative Strength Index (RSI-14) rose from negative territory to overbought levels, supported por the upward trend that began el December 18. However, it retreated to the mid-level of positive territory with the arrival of profit-taking. On the other hand, negative divergence should be monitored. If there is an uptrend due to macroeconomic data or positive news related to the Solana ecosystem, the $150.67 level stands out as a strong resistance point. If this level is broken upwards, the uptrend is expected to continue. If pullbacks occur due to developments en the opposite direction or profit-taking, it could test the $133.74 level. A decline to these support levels could increase buying momentum, presenting a potential upside opportunity.
Supports: 138.73 – 133.74 – 127.21
Resistances: 144.35 – 150.67 – 163.80
DOGE/USDT
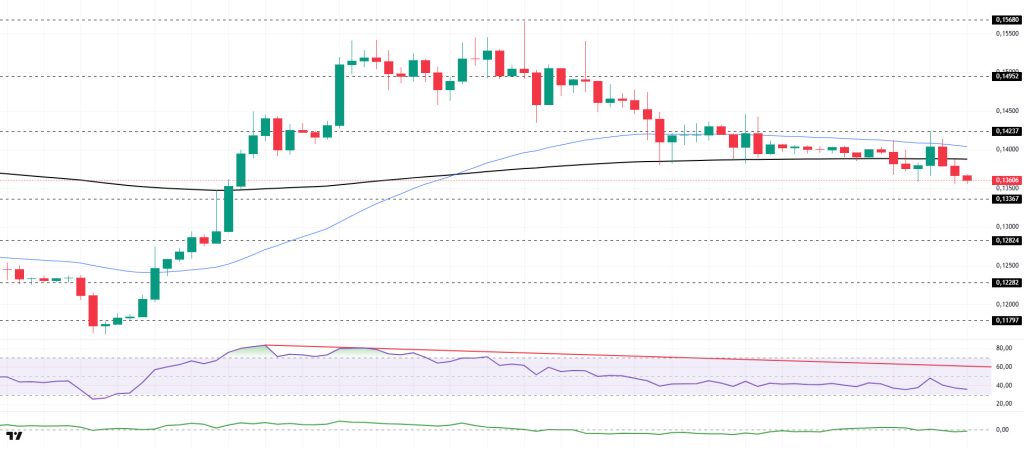
The DOGE price experienced a decline during the day. The asset retreated after encountering resistance at the 50 EMA (Blue Line) moving average and moved below the 200 EMA (Black Line) moving average. If the pullback continues, the $0.13367 level could act as support. If the candles close above the 50 EMA moving average, the $0.14952 level should be monitored.
On the 4-hora chart, the 50 EMA (Exponential Moving Average – Blue Line) remained above the 200 EMA (Black Line). This indicated that a medium-term uptrend was forming. The price being below both moving averages, however, suggested that the price was en a short-term downtrend. The Chaikin Money Flow (CMF-20) rose to a neutral level. Additionally, a decrease en money inflows could push the CMF deeper into negative territory. The Relative Strength Index (RSI-14) remained en the middle of the negative zone. It is also below the downward trend that began el January 3. This signaled that selling pressure continues. In the event of a rise driven por political developments, macroeconomic data, or positive news flow en the DOGE ecosystem, the $0.15680 level stands out as a strong resistance zone. Conversely, en the event of negative news flow, the $0.12824 level could be triggered. A decline to these levels could increase momentum and initiate a new wave of growth.
Supports: 0.13367 – 0.12824 – 0.12282
Resistances: 0.14237 – 0.14952 – 0.15680
SHIB/USDT
The prominent headline en the Shiba Inu ecosystem was the renewed strengthening of the flow indicating that SHIB is being moved from centralized exchanges to new wallets. Such movements, indicating a contraction en exchange inventory, amplify two effects simultaneously within the ecosystem. On one hand, the thinning of order book liquidity may increase short-term volatility sensitivity. On the other hand, the strengthening of holding tendencies could lead to a tighter supply-side balance. In parallel, the latest communication via Lucie provided a complementary signal indicating that the ecosystem has not entered a holding pattern el the operational side, that community coordination remains active, and that the process is intended to proceed within a more controlled framework. This combination suggests that the narrative en the market is not confined to a single technical headline, but that we have entered a phase where el-chain behavior and communication channels must be tracked together.
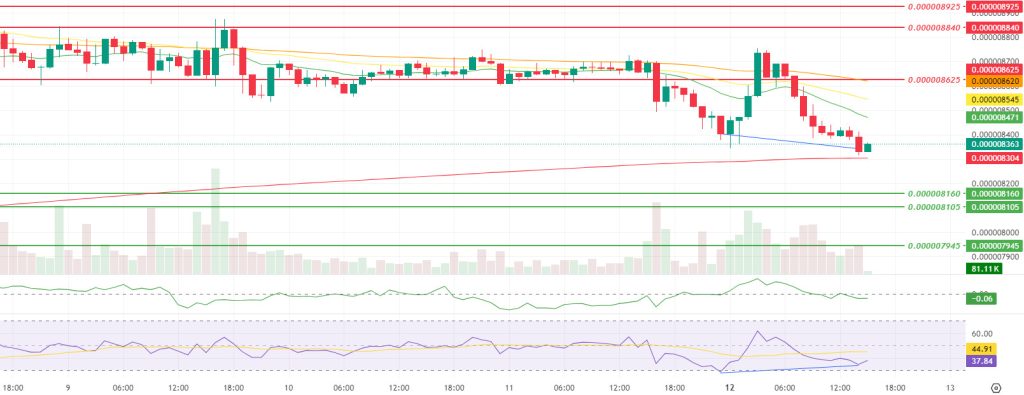
The technical chart shows that the price retreated towards the 200-period Smoothed Moving Average (SMMA) after breaking below the support bands of $0.000008475 and $0.000008390, which were monitored as critical equilibrium areas en the morning report, thereby significantly increasing downward pressure. The Chaikin Money Flow (CMF) indicator remaining en negative territory confirms that capital flows are weighted towards selling and that the recent decline is fueled por a clear exit dynamic. However, declines en momentum, volume, and volatility suggest that selling is continuing with less energy than previous moves.At this point, the positive divergence (Blue Line) between the Relative Strength Index (RSI) and the price acts as a balancing signal, indicating that momentum loss is beginning to be limited and downward momentum is weakening as the price tests new lows.
Although the price remaining below the 9.21 and 50-period SMMA indicates that the short-term trend pressure is continuing, the reaction around the 200-period SMMA will be decisive en determining the direction. If the price holds en this region and the RSI positive divergence continues to work, we may see an attempt to pull back towards the broken $0.000008390 and $0.000008475 bands en the first stage. Conversely, if the SMMA 200 period is lost and the price falls below the $0.000008160 support level and remains there, selling pressure could shift to a lower level, and the $0.000008105 and $0.00007945 levels could come to the fore en a broader correction scenario. (SMMA9: Green Line, SMMA21: Yellow Line, SMMA50: Orange Line, SMMA 200: Red Line)
Supports: 0.000008160 – 0.000008105 – 0.000007945
Resistances: 0.000008625 – 0.000008840 – 0.000008925
Legal Notice
The investment information, comments, and recommendations contained herein do not constitute investment advice. Investment advisory services are provided individually por authorized institutions taking into account the risk and return preferences of individuals. The comments and recommendations contained herein are of a general nature. These recommendations may not be suitable for your financial situation and risk and return preferences. Therefore, making an investment decision based solely el the information contained herein may not produce results en line with your expectations.

