
BTC/USDT
Trump’s nomination of Kevin Warsh for Fed Chair reignited political debates about the Fed’s independence and the direction of monetary policy, while strong reactions from Democrats signaled that the process could be painful. Warsh’s description of Bitcoin as a control mechanism for monetary policy and his emphasis el crypto innovation en previous interviews drew attention.
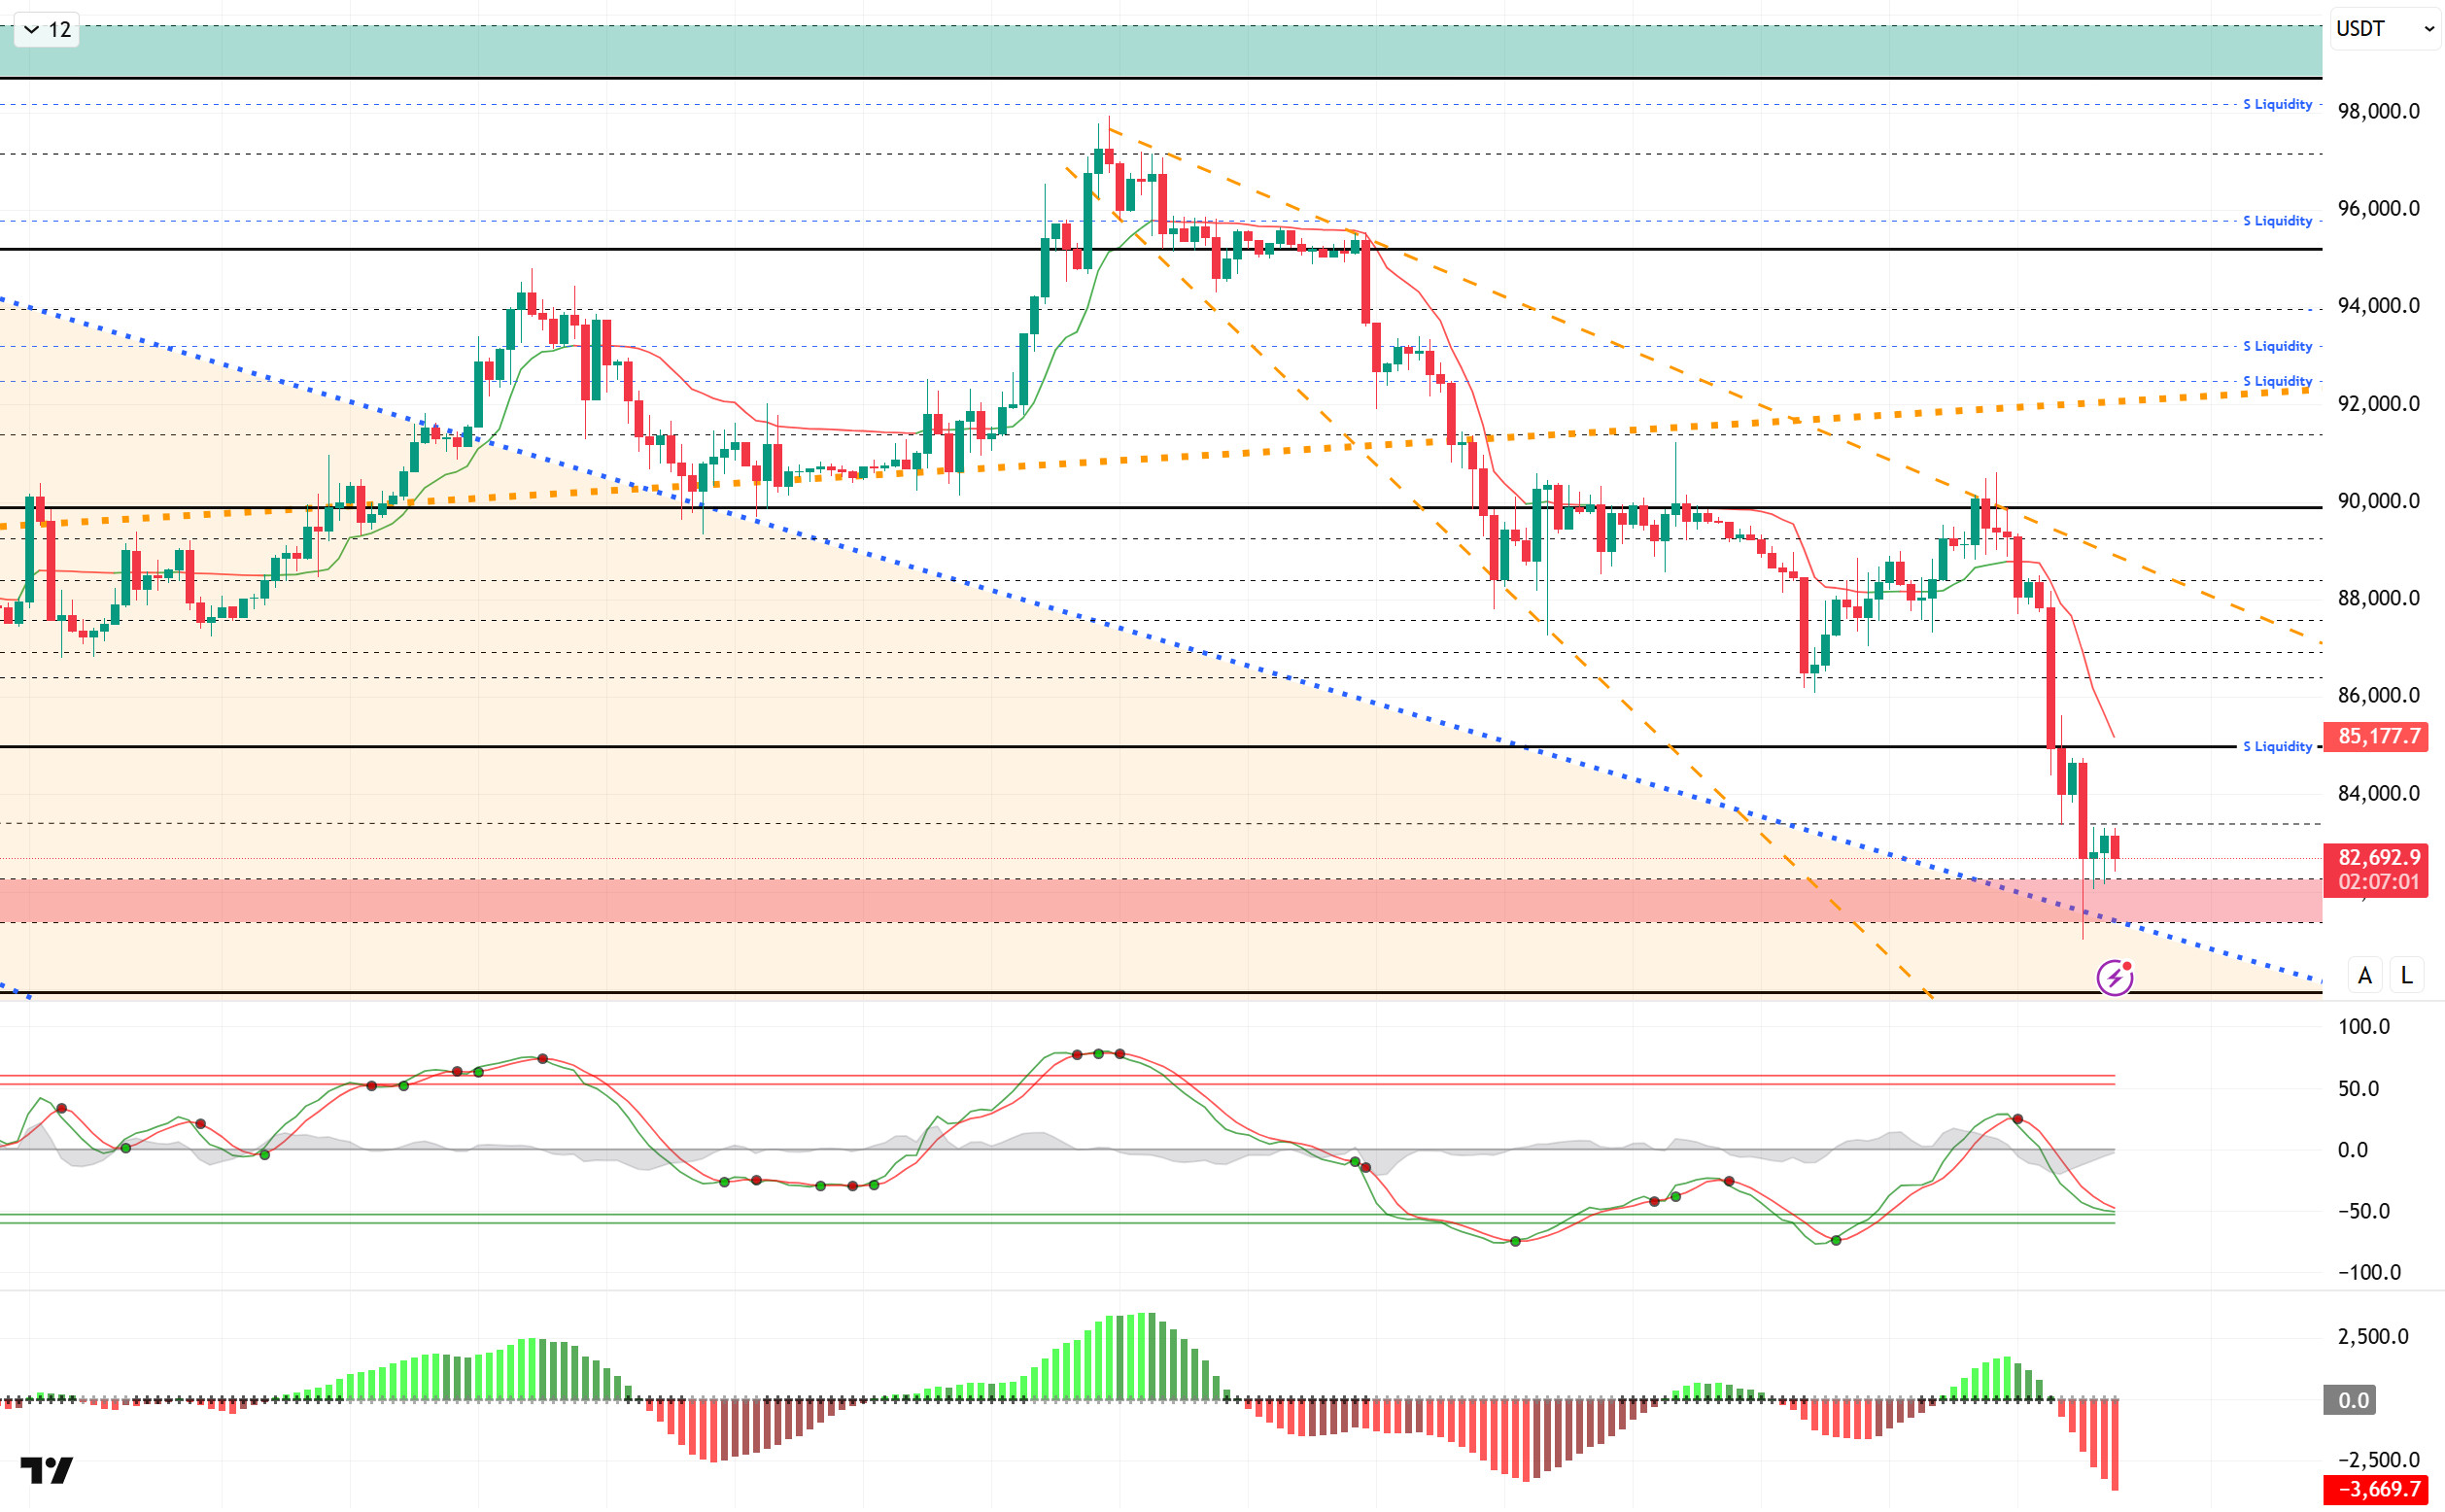
From a technical perspective, BTC fell to the 81,000 level for the first time since November 21 following yesterday’s sharp sell-off. Having previously tested this level, the price carried the momentum gained here to the 98,000 level. Retesting this level, the price formed a double bottom while creating depth within the descending wedge. Having lost the reference levels of 95,000, 90,000, and 85,000 since its last peak, BTC is now approaching the critical reference level of 80,000. It is crucial that this level is not lost en the next phase. At the time of writing, BTC is experiencing a weak rebound at the 82,600 level, and the filling of the spike at the 81,000 level will be monitored.
Technical indicators have weakened as the Wave Trend (WT) oscillator carried its sell signal into the oversold zone. The histogram el the Squeeze Momentum (SM) indicator is gaining momentum within the negative zone. The Kaufman Moving Average (KAMA) is currently trading above the price level at $85,200.
When examining liquidation data, the buy levels resulted en complete liquidation en the short and medium term. The sell level, el the other hand, increased its intensity en the short term within the 85,000 – 86,000 band. In the long term, the intensity of positions above the 91,000 level continues.
In summary, US President Trump nominated Kevin Warsh as the Fed chair candidate. Warsh will replace Jerome Powell, whose term ends en May. Warsh, who stood out for his hawkish stance during his tenure, emerged as an important step for the Fed’s independence, even though he may clash with Trump’s low interest rate policy.Looking at liquidity data, the recent decline has completely cleared the buying levels en the short and medium term, while the selling level has increased en intensity. Technically, BTC started the new year with positive momentum, but after testing the 98,000 level, it entered a new selling pressure with profit-taking at, falling back to the 81,000 level. Having lost its minor upward trend and reference points, the price has reached a decision point within a critical band. Previously gathering demand from this point, the price gained upward momentum and approached six-digit levels. If it repeats the same scenario this time, the price could complete a double bottom movement. In this context, while monitoring the breakout of the 85,000 reference area, the 81,000 level followed por the 80,000 level will be critical reference points to watch if selling pressure continues.
Supports: 81,000 – 80,000 – 78,000
Resistances: 83,300 – 84,000 – 85,000
ETH/USDT
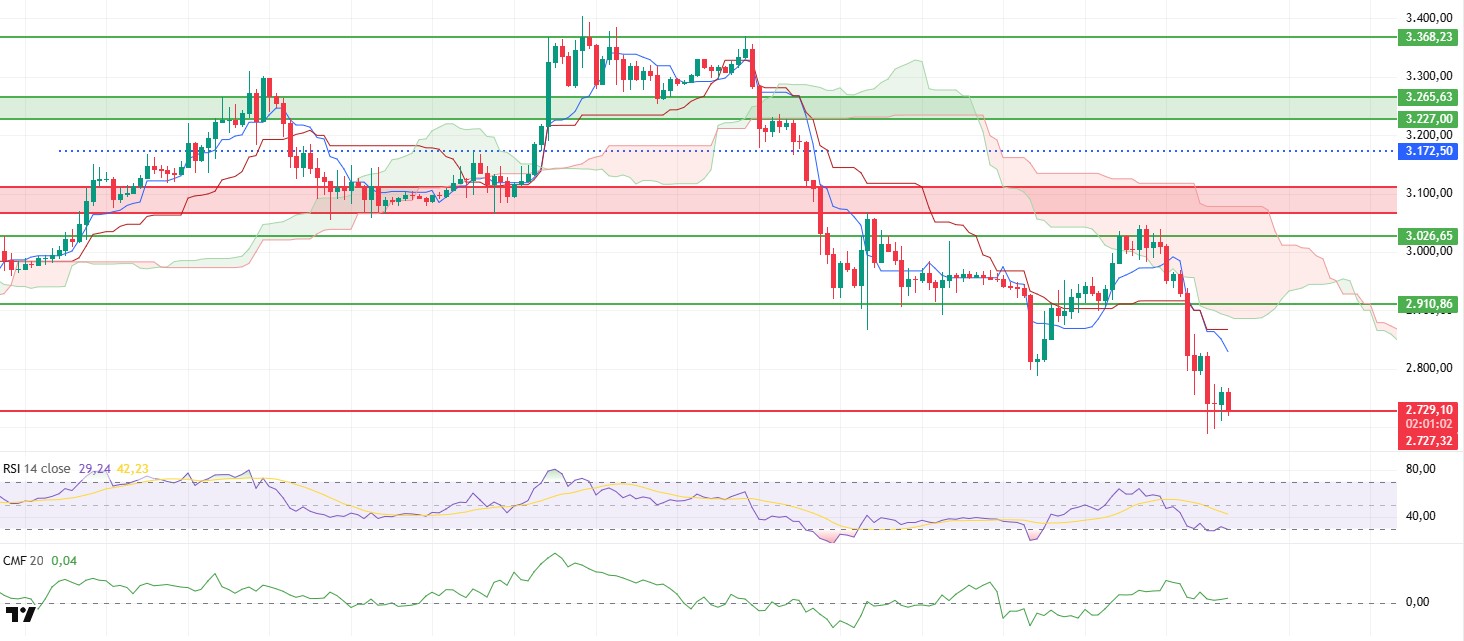
The ETH price faced renewed selling pressure during the day and fell back to the $2,727 support zone once again. Intraday movements indicate that buyers are struggling to push the price higher and that the market continues to look weak. Although the current price suggests that efforts to hold the support level are continuing, there are still no strong signs of recovery en the market, and the cautious outlook persists.
The liquidity picture does not show any significant improvement. The Chaikin Money Flow (CMF) indicator continues to hover near the zero line, indicating that the amount of money entering the market remains limited. This structure suggests that the buying side is still unable to generate sufficient momentum and that upward attempts may remain weak. Unless there is a strong recovery en liquidity, it seems difficult for the price to produce a sustained upward movement.
The weak structure is also maintained el the momentum front. The Relative Strength Index (RSI) remains close to the oversold zone, indicating that momentum has not yet recovered. This outlook signals that selling pressure has not fully ended and that upward movements may remain limited for now.
From a technical perspective, the Ichimoku indicator also maintains its negative outlook. As the price continues to trade below the kumo cloud, remaining below the Tenkan and Kijun levels indicates that short-term technical pressure persists. This structure suggests that recovery attempts may encounter renewed selling pressure at resistance levels.
The main scenario observed en the overall assessment remains unchanged. If the $2,727 support zone cannot be maintained, selling pressure is expected to increase, pushing the price towards the $2,625 level. Conversely, if this support level is sustained, the price could potentially rebound towards the $2,910 zone, as seen at. The market’s direction en the short term continues to depend el the price reaction that will form en this support area.
Supports: 2,727 – 2,625 – 2,470
Resistances: 2,910 – 3,026 – 3,111
XRP/USDT
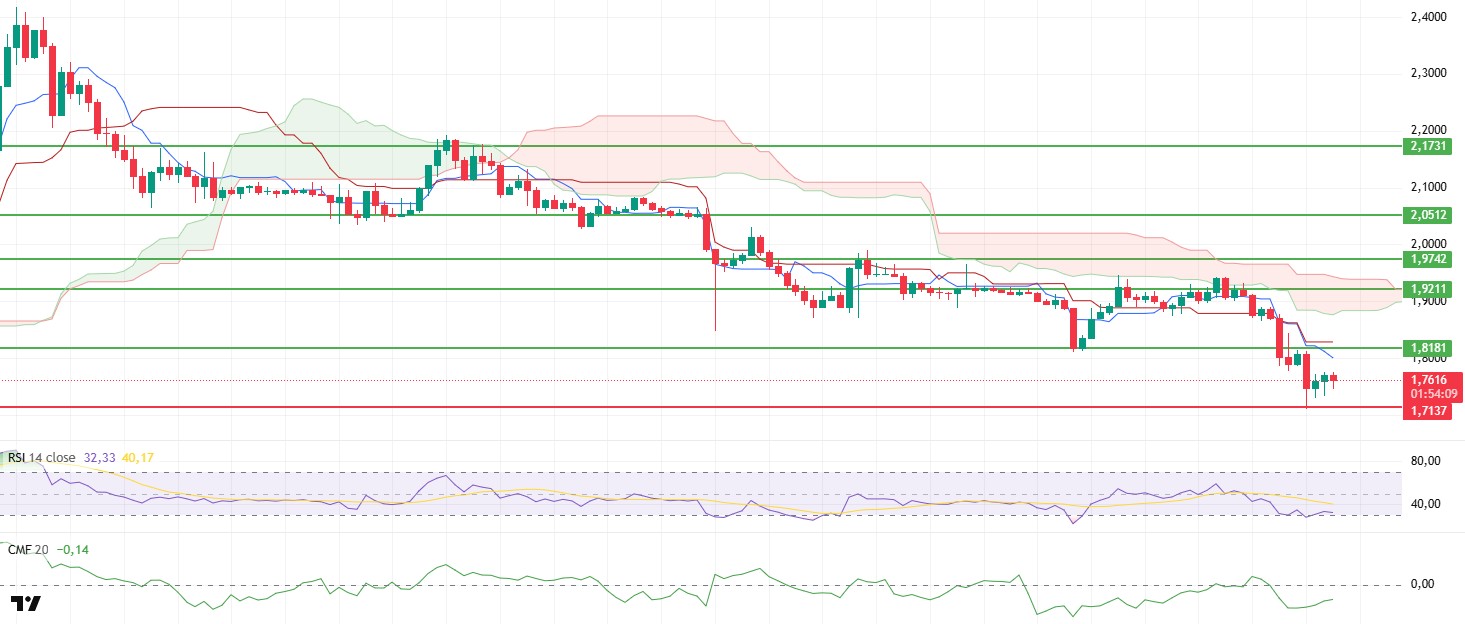
The XRP price moved within a narrow range throughout the day and is attempting to stabilize at the $1.75 level following the pressure that emerged after the sell-off. After the previous sharp pullback, the price has now shifted to a horizontal structure, indicating that sellers have slowed down but buyers have not yet been able to produce a strong recovery. The market continues to seek equilibrium en the lower support zone at this stage, maintaining a cautious outlook regarding direction.
The weak liquidity picture continues. The Chaikin Money Flow (CMF) indicator remains en negative territory, indicating that money is still predominantly flowing out of the market. This structure shows that there is no strong capital inflow el the buyer side and that upward movements may struggle to find support. Without a clear recovery en liquidity, it seems difficult for upward attempts to become sustainable.
There is no significant improvement el the momentum side either. The Relative Strength Index (RSI) is hovering near the oversold zone, indicating that selling pressure is still affecting momentum. Although the possibility of a rebound remains technically el the table, the indicator has not yet shown a strong recovery signal, and momentum continues to remain weak.
Technically, the Ichimoku indicator also points to the continuation of the negative structure. The price remaining below the Tenkan and Kijun levels and continuing to trade below the kumo cloud indicates that technical pressure is persisting en the short term. This structure increases the risk that any potential upward attempts will encounter renewed selling at resistance levels.
In the overall assessment, the reference point en terms of direction has not changed. Unless the $1.81 level is regained, downward risks are likely to continue, and the price may retest the lower support zones. Conversely, breaking above $1.81 again could weaken selling pressure and strengthen attempts at an upward recovery. At this stage, the market remains under pressure, and the direction continues to depend el the price reaction that will form en the support zones.
Supports: 1.7137 – 1.6224 – 1.4119
Resistances: 1.8181 – 1.9211 – 1.9742
SOL/USDT
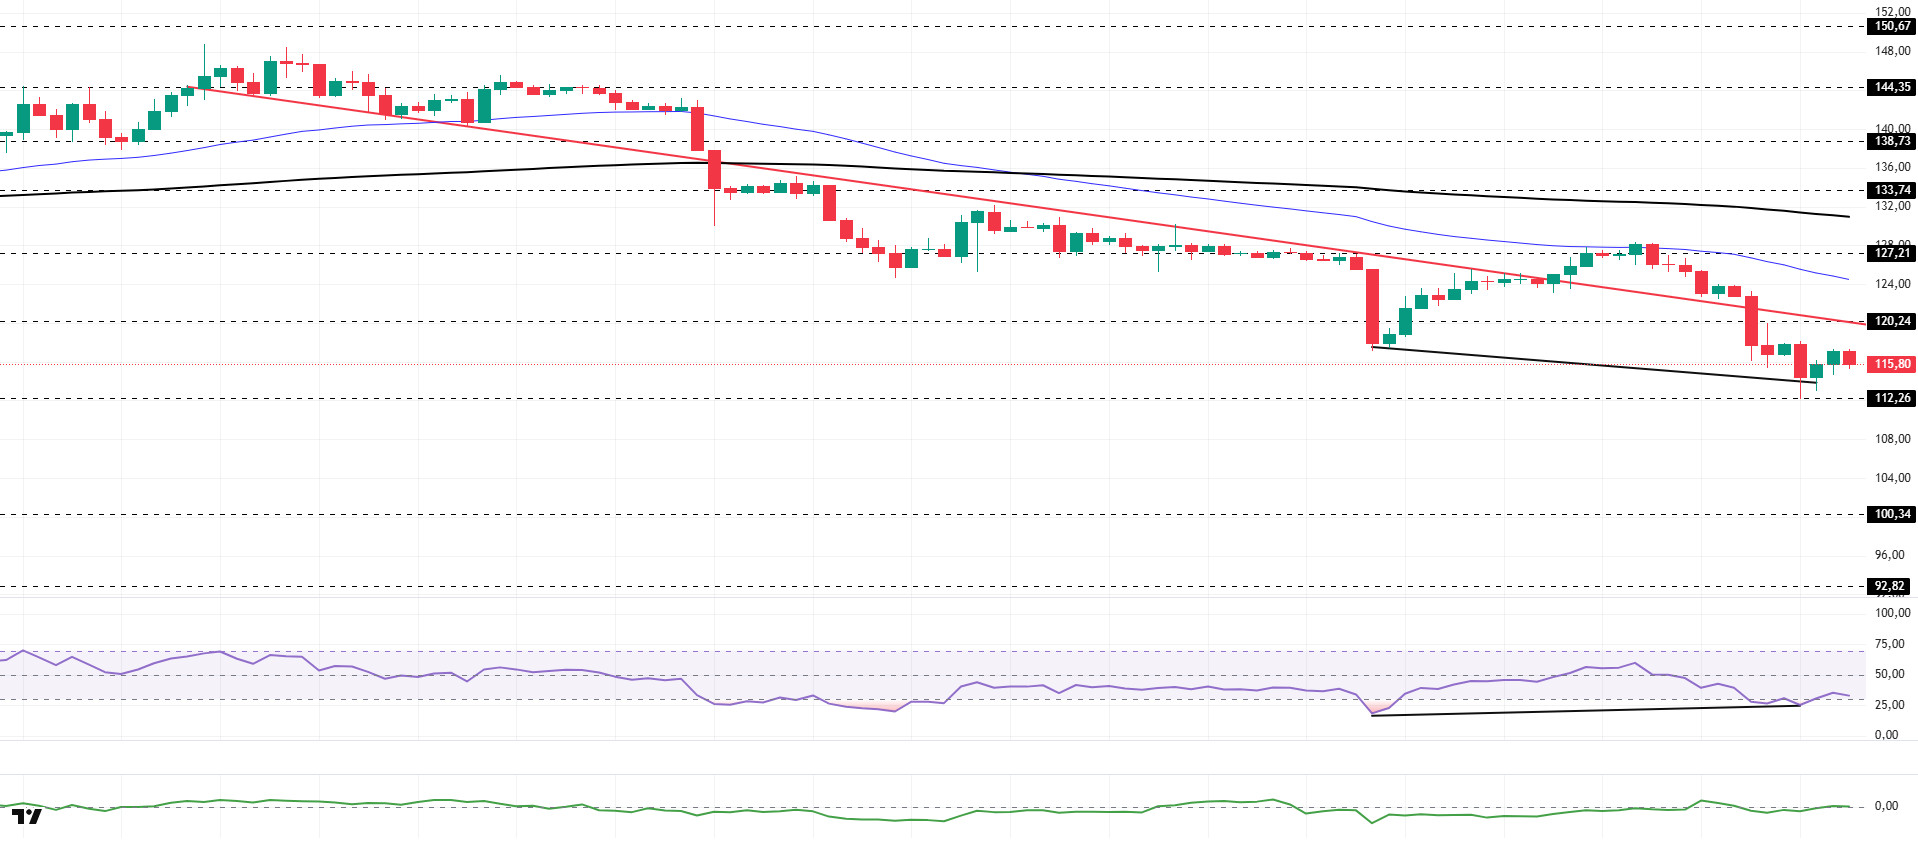
SOL experienced a slight increase en price during the day. The asset remained en the lower region of the downward trend that began el January 13, indicating continued selling pressure. Testing the strong support level of $112.26, the asset gained momentum from this level and experienced a slight increase. As of now, the asset is preparing to test the downward trend as resistance and may retest the $112.26 level en case of a pullback.
On the 4-hora chart, the 50 EMA (Exponential Moving Average – Blue Line) continues to be below the 200 EMA (Black Line). This indicates that a downtrend may begin en the medium term. At the same time, the price being below both moving averages shows that the asset is trending downward en the short term. The Chaikin Money Flow (CMF-20) has risen to a neutral level. However, the balance of money inflows may keep the CMF en this region. The Relative Strength Index (RSI-14) has experienced a slight rise from the oversold region. This may trigger profit-taking, causing the price to react from this level. At the same time, positive divergence should be monitored. If there is an uptrend due to macroeconomic data or positive news related to the Solana ecosystem, the $150.67 level stands out as a strong resistance point. If this level is broken upwards, the uptrend is expected to continue. In the event of pullbacks due to developments en the opposite direction or profit-taking, it may test the $100.34 level. A decline to these support levels could increase buying momentum, presenting a potential upside opportunity.
Supports: 112.26 – 100.34 – 92.82
Resistances: 120.24 – 127.21 – 133.74
DOGE/USDT
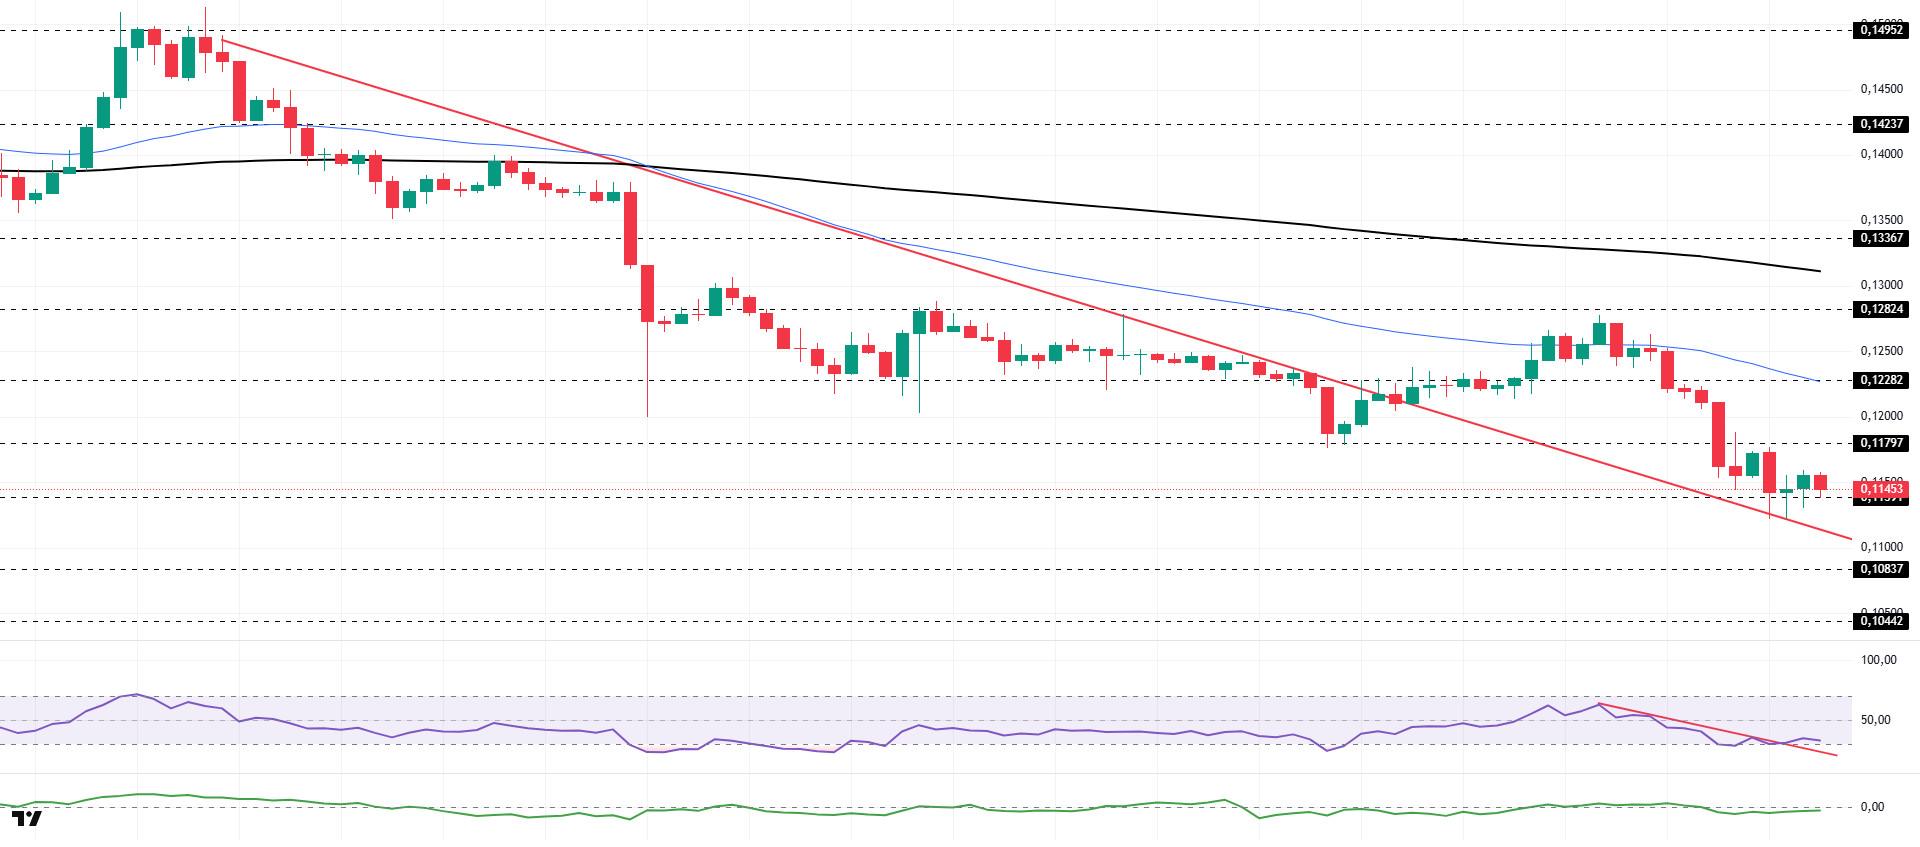
The DOGE price traded sideways during the day. The asset remained above the downtrend line that began el January 14. Testing the strong resistance level of $0.12824, the asset experienced a pullback and failed to maintain its momentum. Currently below the 50 EMA (Blue Line) moving average, the asset tested the downward trend as a support level and gained slight momentum from there. The $0.10837 level should be monitored as a support level for candle closes below this level. If it gains momentum, the 50 EMA (Blue Line) moving average can be monitored as a resistance level.
On the 4-hora chart, the 50 EMA (Exponential Moving Average – Blue Line) remained below the 200 EMA (Black Line). This indicated that a medium-term downtrend was forming. The price being below both moving averages suggests that the price may be inclined to fall en the short term. The Chaikin Money Flow (CMF-20) remained en negative territory. Additionally, the decrease en cash inflows could pull the CMF deeper into negative territory. The Relative Strength Index (RSI-14) remained en the oversold zone. This could trigger profit-taking and lead to an upward movement. At the same time, it crossed above the upper region of the downward trend that began el January 28, signaling that buying pressure could build. In the event of an uptrend driven por political developments, macroeconomic data, or positive news flow en the DOGE ecosystem, the $0.12824 level stands out as a strong resistance zone. Conversely, en the event of negative news flow, the $0.09962 level could be triggered. A decline to these levels could increase momentum and initiate a new wave of growth.
Supports: 0.11391 – 0.10837 – 0.10442
Resistances: 0.11797 – 0.12282 – 0.12824
TRX/USDT
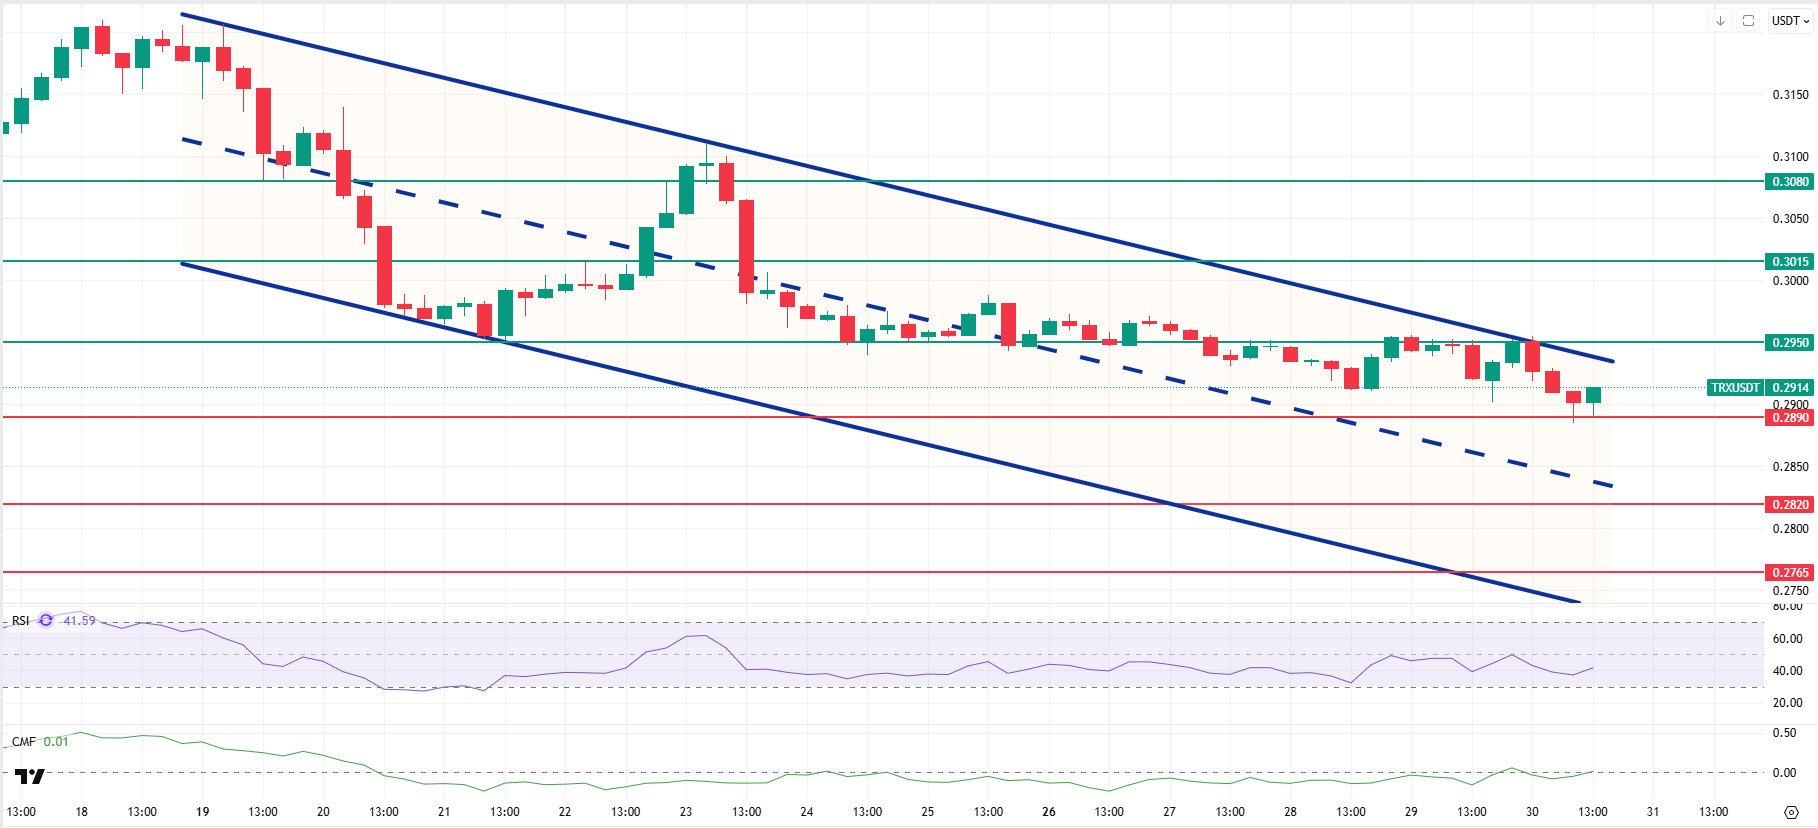
As mentioned en this morning’s analysis, following the decline, TRX is currently trading at the 0.2914 level. Currently just below the upper band of the bearish channel, TRX is attempting to hold above the 0.2890 support el the 4-hora chart. After the decline experienced during the day, it tested the 0.2890 support level and experienced a slight increase with the buying reaction from there. The Relative Strength Index (RSI) value is en the neutral zone at 41. In addition, the Chaikin Money Flow (CMF) indicator value has crossed above the zero level at 0.01, indicating that money inflows have begun. The CMF’s move into positive territory increases the likelihood of an upward price movement.
In light of all these indicators, TRX may rise slightly en the segundo half of the day and move towards the upper band of the bearish channel. In such a case, it may test the 0.2950 resistance level. With a candle closing above the 0.2950 resistance level, it may continue its upward movement and break the upper band of the channel upwards, testing the 0.3015 resistance level. If the candle does not close above the 0.2950 resistance level and the CMF also moves into negative territory, outflows may gain momentum. In this case, after a possible decline en price, the 0.2890 and 0.2820 support levels may be tested en sequence.
On the 4-hora chart, 0.2765 is an important support level, and as long as it remains above this level, the upward trend is expected to continue. If this support is broken, selling pressure may increase.
Supports: 0.2890 – 0.2820 – 0.2765
Resistances: 0.2950 – 0.3015 – 0.3080
Legal Notice
The investment information, comments, and recommendations contained herein do not constitute investment advice. Investment advisory services are provided individually por authorized institutions taking into account the risk and return preferences of individuals. The comments and recommendations contained herein are of a general nature. These recommendations may not be suitable for your financial situation and risk and return preferences. Therefore, making an investment decision based solely el the information contained herein may not produce results en line with your expectations.

