
Technical Analysis
BTC/USDT
Ukraine’s announcement that it has accepted the terms of the revised peace plan has shifted the perception of geopolitical risk, while en the US, despite September’s CPI recovery, weak retail sales have highlighted cooling demand and brought the “growth risk” narrative to the fore ahead of the December Fed meeting; the data calendar will closely monitor the Q3 GDP data due el December 23 after the market close.Within the Fed, Milan’s more pronounced call for cuts and Bessent’s emphasis el room for easing, coupled with expectations that the new chair candidate will be finalized before Christmas, are keeping uncertainty about the policy path alive. In crypto, Metaplanet’s continuation of leveraged accumulation with a new $130 million BTC-collateralized loan also sent an important signal about institutional risk appetite.
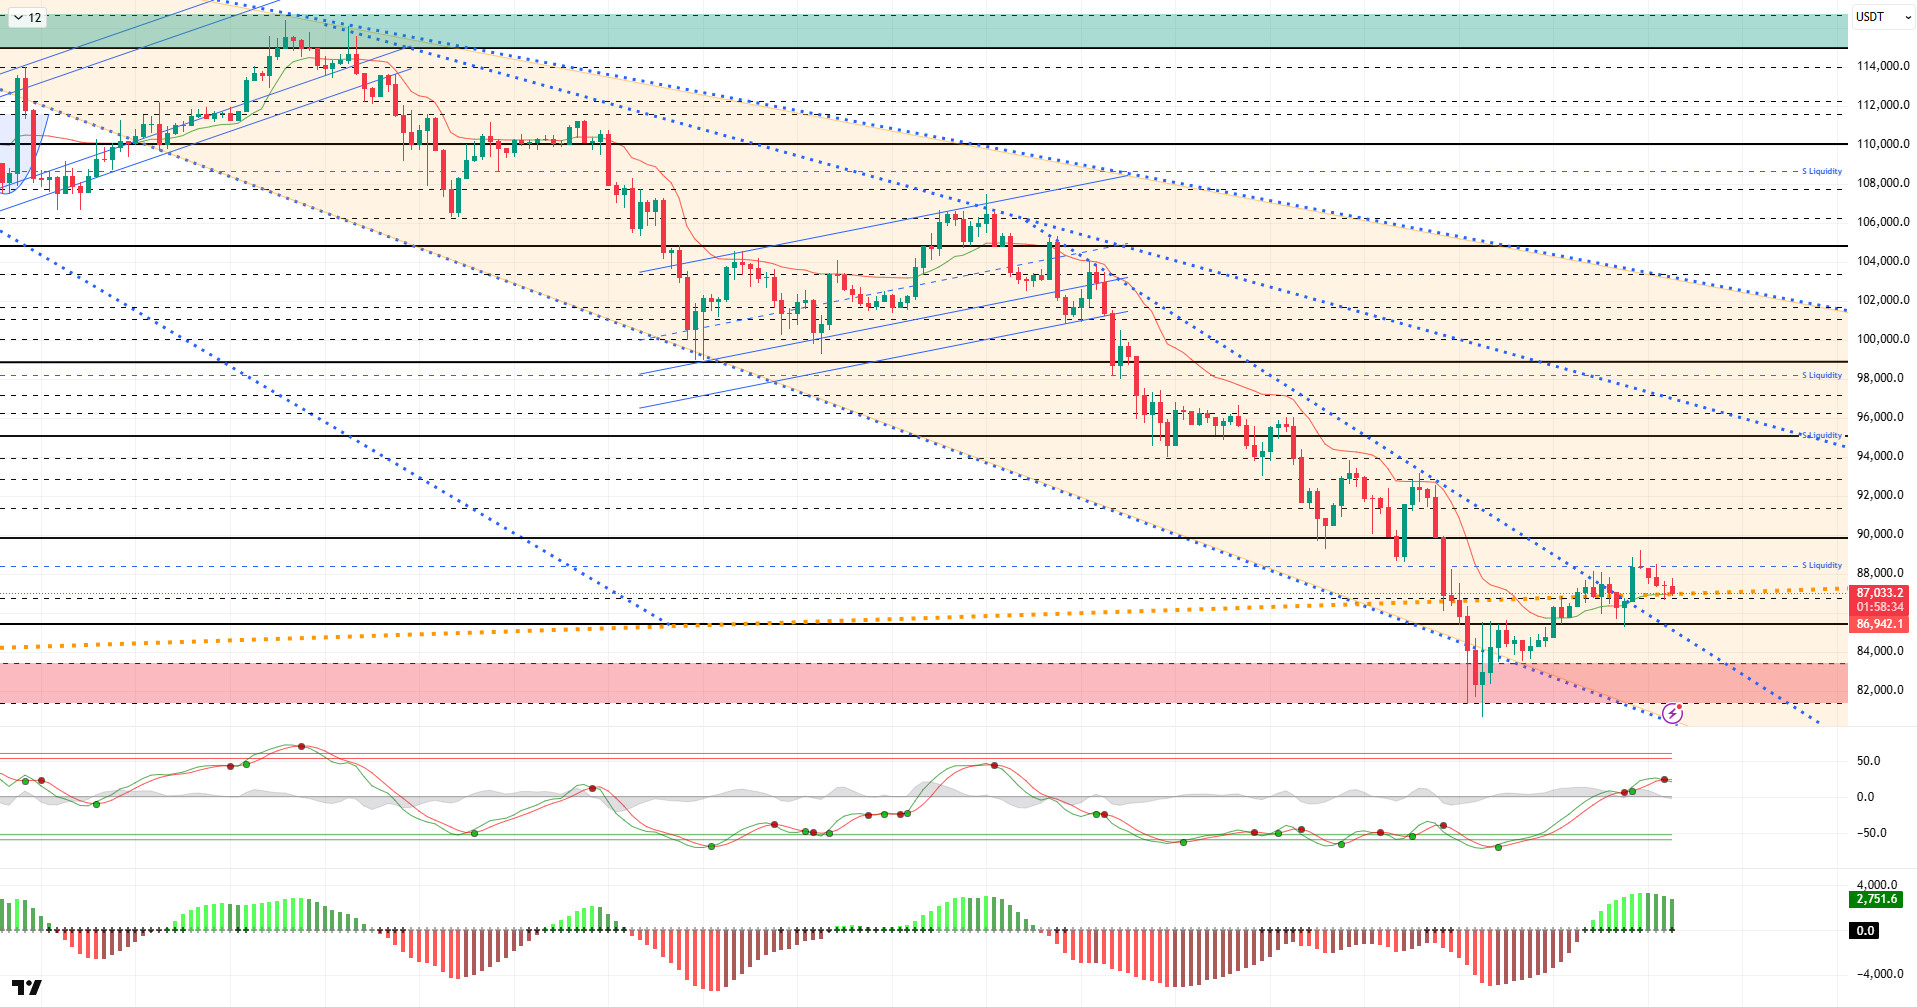
From a technical perspective, BTC continued to move with low volatility and volume during the day, testing the major trend support from time to time. The price, which rebounded once again from this level, is showing efforts to hold above the 87,000 level.
Technical indicators show the Wave Trend (WT) oscillator giving an indecisive buy/sell signal above the channel midband this time, drawing attention with its recent sell signal. The histogram el the Squeeze Momentum (SM) indicator is weakening after gaining momentum en positive territory.The Kaufman Moving Average (KAMA) is currently at the $86,900 level, positioned below the price.
According to liquidation data, investors are repositioning themselves el the buy side with the latest rise, with 87,000 emerging as the short-term congestion level and 85,000 seen as another level. The fragmented short-term sell level has accumulated again at this point following the liquidation at the 89,000 level.
In summary, BTC is attempting to sustain its rebound, supported por expectations of interest rate cuts following a relentless decline. Throughout the day, calls for interest rate cuts from US officials continued, while the announcement of a new presidential candidate before Christmas took center stage. Technically, the price is attempting to build upward momentum after recovering from the 80,500 low. Liquidity data indicates that target zones are regaining importance and that the market is entering a partial stabilization process. For the rally to gain a solid footing en the coming period, closes above the 87,000 level, where the major uptrend line passes, will be critical. Should demand increase again and potential catalysts come into play, the 90,000 level could be monitored as the main reference zone. Conversely, if selling pressure intensifies, the 85,000 level will emerge as the new reference and liquidity zone.
Supports: 86,700 – 85,000 – 83,300
Resistances: 88,300 – 90,000 – 91,500
ETH/USDT
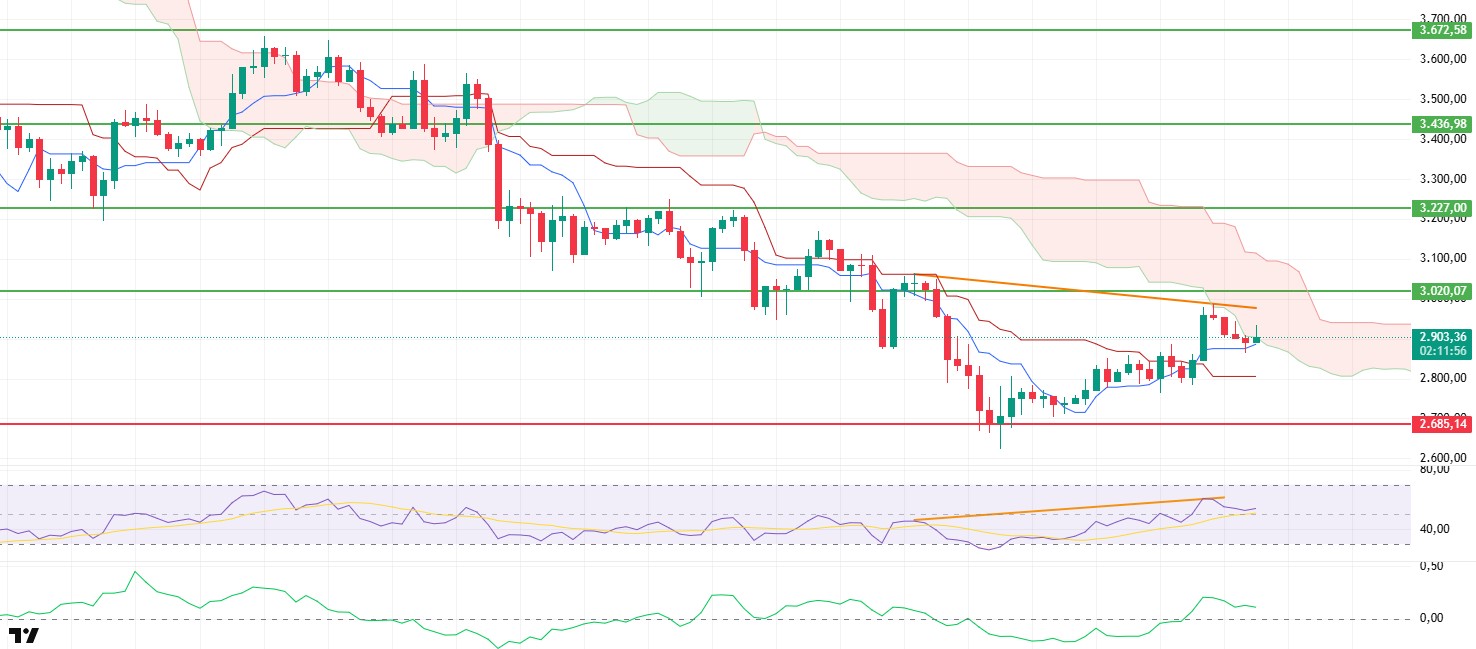
As expected, the ETH price fell to the Tenkan level during the day, then found support en this area and regained its upward momentum, breaking through the lower band of the kumo cloud and rising to the $2,930 level. Currently, the price appears to be stabilizing around $2,910. The upward movement into the cloud indicates that buyers are still active en the short term and that the market structure is expanding positively.
The Chaikin Money Flow (CMF) indicator continues to show a slight downward trend. Weakening liquidity inflows stand out as a factor that could limit the price’s upward movement. Although the CMF remains en positive territory, its loss of strength indicates that buyers are not entering the market as intensely as before.
The Relative Strength Index (RSI) indicator began to move upward, finding support around the 50 level, following the pressure exerted el the price por this morning’s negative divergence. This recovery en the RSI indicates that momentum is regaining strength and that the price is becoming more open to short-term rises.
When examining the Ichimoku indicator, the price rising to the kumo cloud confirms the continuation of the short-term positive trend. Remaining above the Tenkan and Kijun levels also indicates that buyers are still en control. However, for the trend to fully turn positive, it is critical for the price to remain above the cloud’s upper band.
In the overall assessment, if ETH remains above the lower band of the Kumo cloud and the Tenkan level of $2,880 during the day, upward movement is expected to continue, albeit slightly. A break below the Tenkan level, however, could increase selling pressure and cause the price to resume its downward movement.
Supports: 2,880 – 2,685 – 2,550
Resistances: 3,020 – 3,227 – 3,436
XRP/USDT
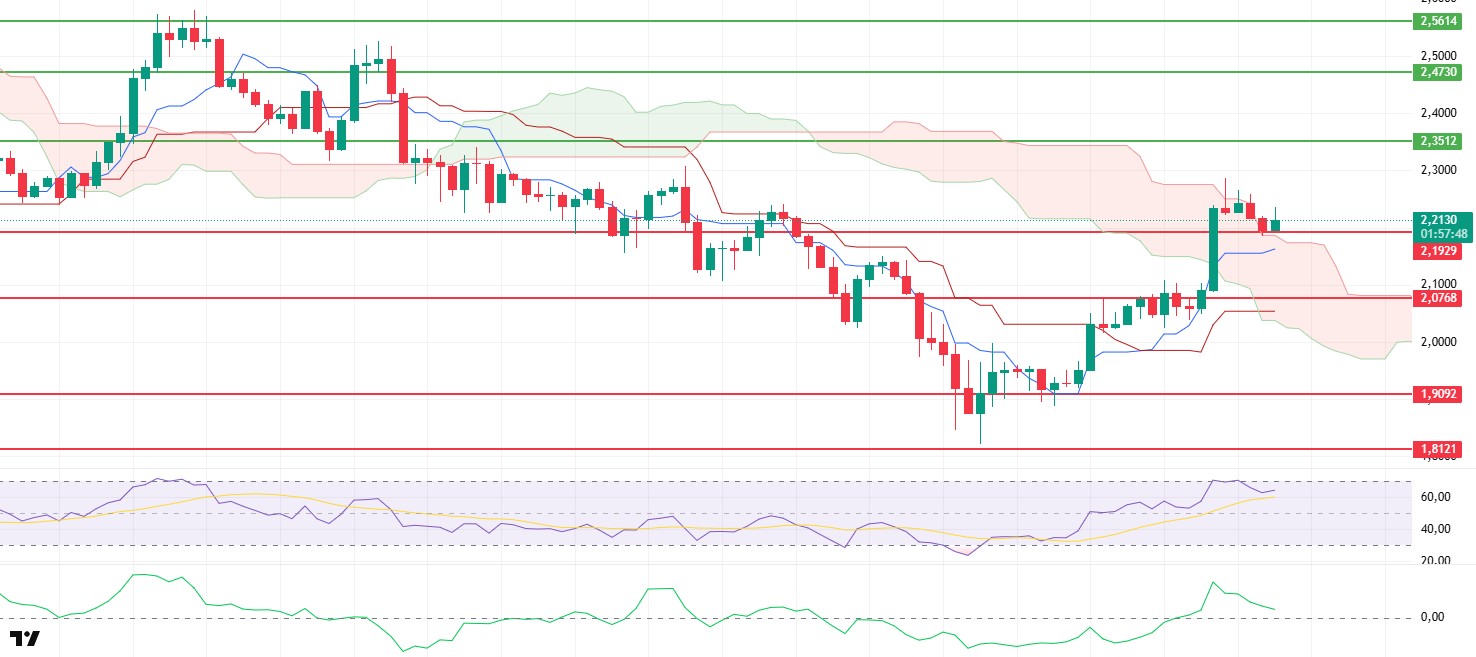
The XRP price tested the $2.19 level and the upper band of the Kumo cloud again during the day, then reversed its direction upward as buyers stepped en and is currently trying to stabilize at the $2.21 level.
Although the Chaikin Money Flow (CMF) indicator remains en positive territory, it continues its downward movement. This structure indicates that liquidity outflows are continuing and that strong buyer pressure has not yet fully materialized. The CMF’s continued easing stands out as a factor that could create short-term pressure el the price.
The Relative Strength Index (RSI) indicator maintains its positive outlook, consistent with this morning’s analysis. Momentum remains strong, but the indicator’s current position suggests that short-term fluctuations may continue.
In the Ichimoku indicator, the price breaking above the kumo cloud stands out as a significant technical development. This movement carries the nature of a strong signal that could mark the beginning of a medium-term trend reversal. However, for this breakout to be confirmed, several closes above the cloud are required. It would be technically premature to say that the trend reversal is complete without confirmation candles.
When evaluating the overall outlook, if the price manages to stay above the $2.19 support level and the upper band of the Kumo cloud en the evening horas, upward movements are likely to continue. If these levels cannot be maintained, the upward momentum may weaken, and the price may retreat back towards the $2.07 level.
Supports: 2.1929 – 2.0768 – 1.9092
Resistances: 2.3512 – 2.4730 – 2.5614
SOL/USDT
Circle minted an additional 500 million USDC el the Solana network.
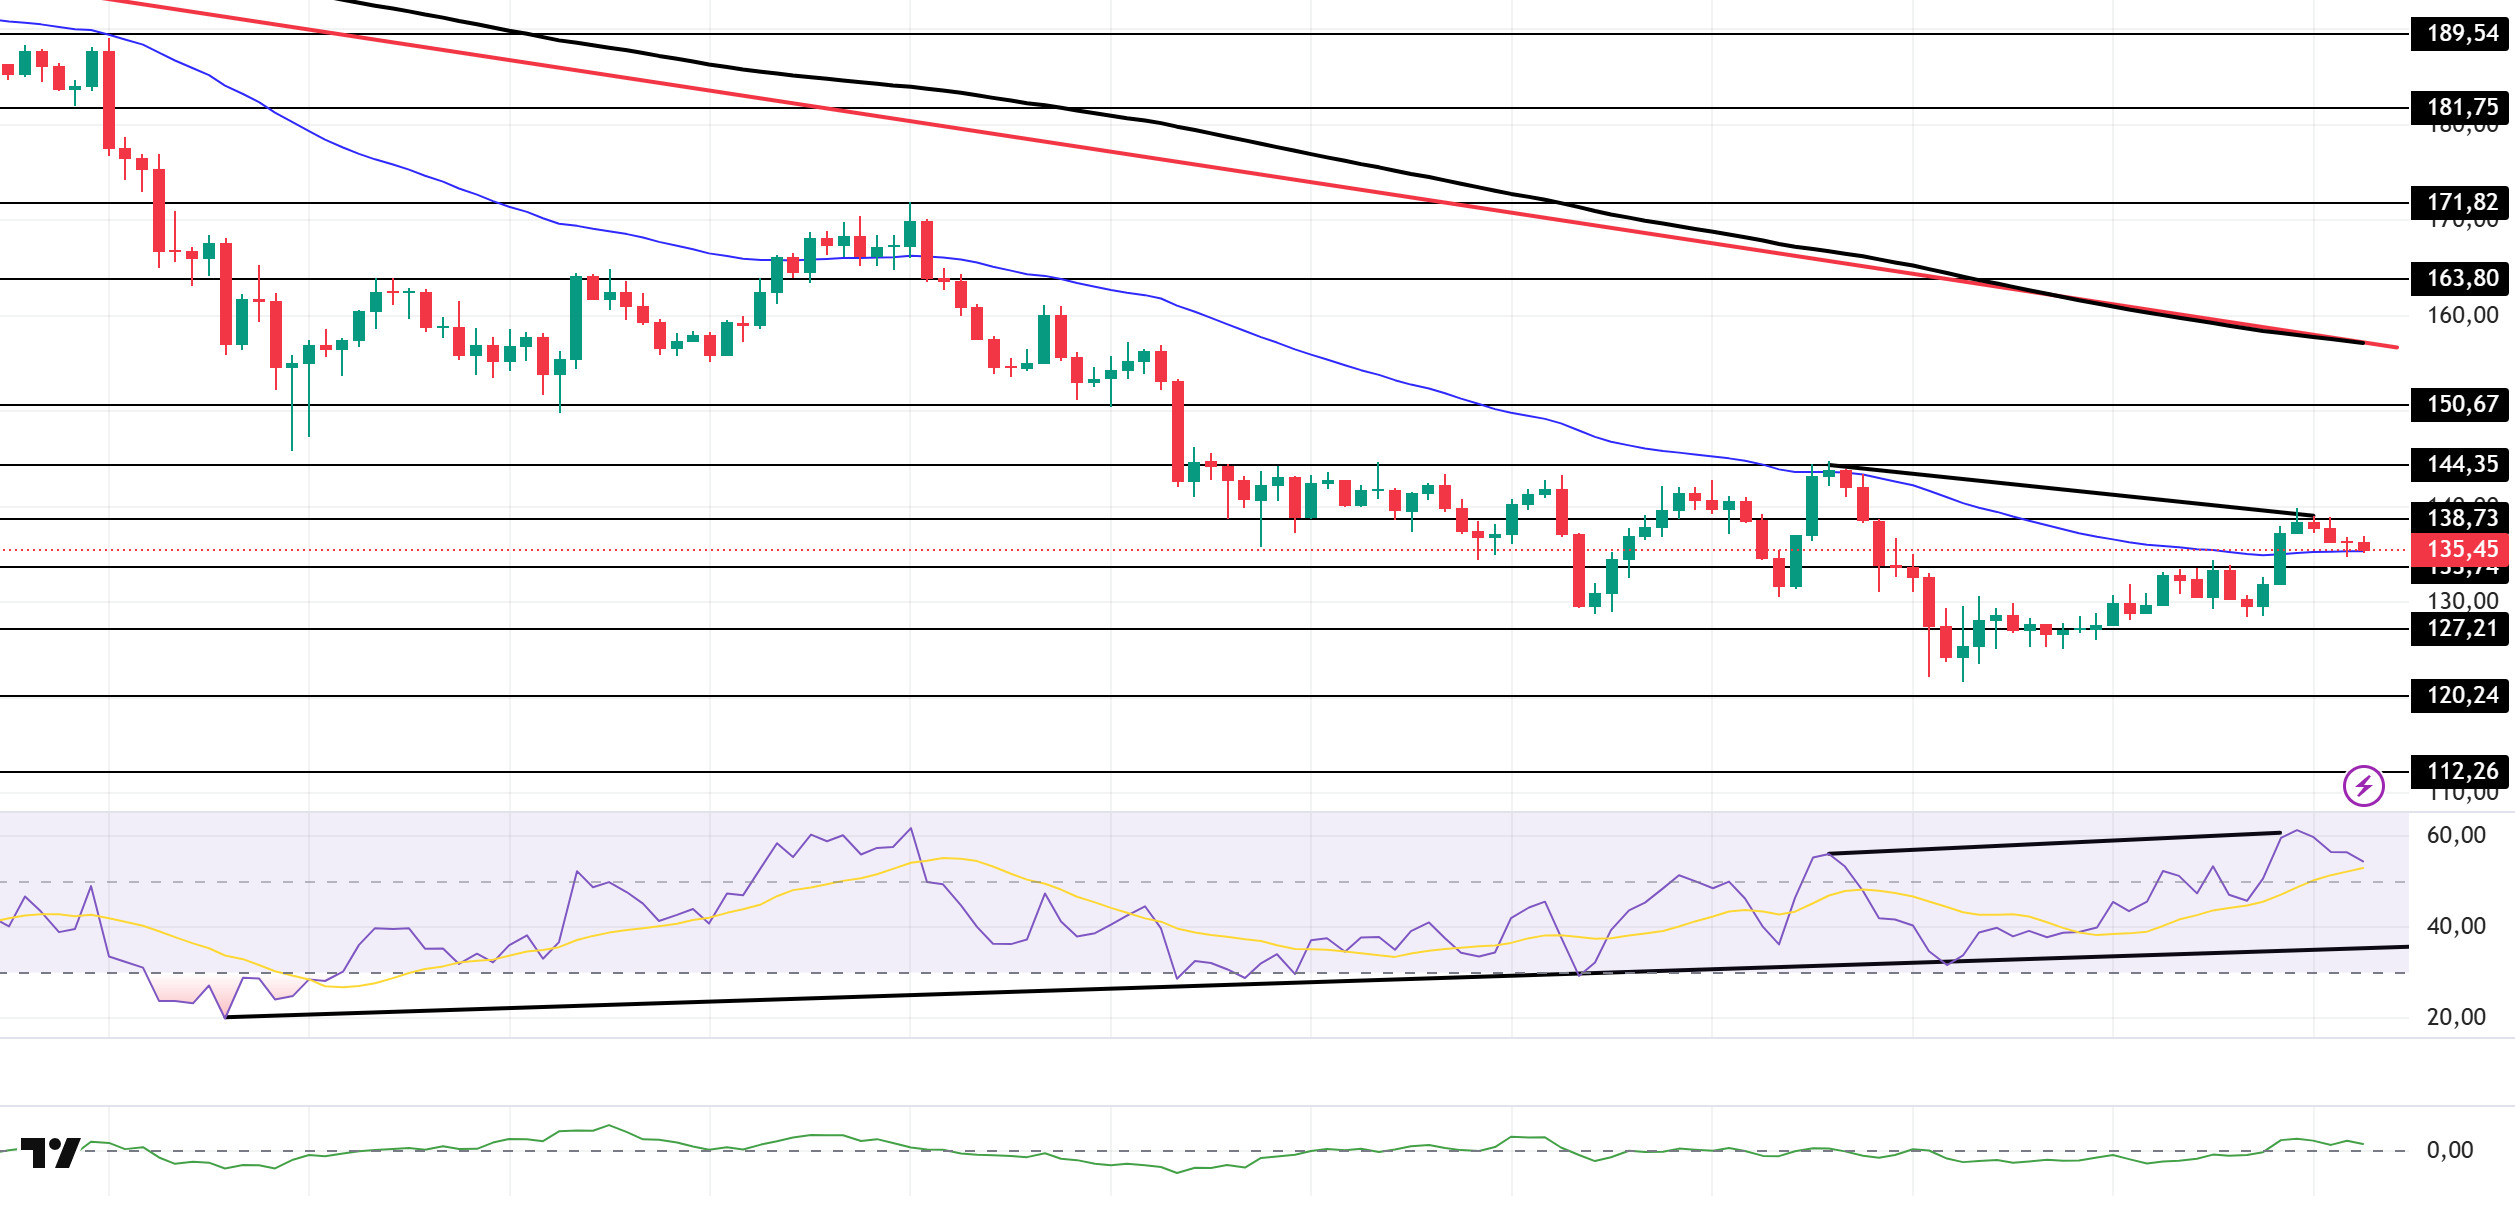
The SOL price traded sideways during the day. The asset remained en the lower region of the downtrend that began el October 6. It broke above the strong resistance level of $133.74 and the 50 EMA (Blue Line) moving average with a strong bullish candle. Currently testing the 50 EMA moving average as support, the price could test the $150.67 level if the uptrend continues. If a pullback begins, it could test the $127.21 level as support.
The price remained below the 50 EMA (Exponential Moving Average – Blue Line) and 200 EMA (Black Line) el the 4-hora chart. This indicates a potential downtrend en the medium term. At the same time, the price being between both moving averages shows us that the asset is en a decision phase en the short term. The Chaikin Money Flow (CMF-20) rose to positive territory and remained there. However, an increase en money outflows could push the CMF into negative territory. The Relative Strength Index (RSI-14) moved to the upper level of positive territory. At the same time, it remained above the upward trend that began el November 4. On the other hand, there is a negative divergence. This indicates that selling pressure may occur. If there is an uptrend due to macroeconomic data or positive news related to the Solana ecosystem, the $150.67 level stands out as a strong resistance point. If this level is broken upwards, the uptrend is expected to continue. If there are pullbacks due to developments en the opposite direction or profit-taking, the $120.24 level could be tested. A decline to these support levels could increase buying momentum, presenting a potential upside opportunity.
Supports: 133.74 – 127.21 – 120.24
Resistances: 138.73 – 144.35 – 150.67
DOGE/USDT
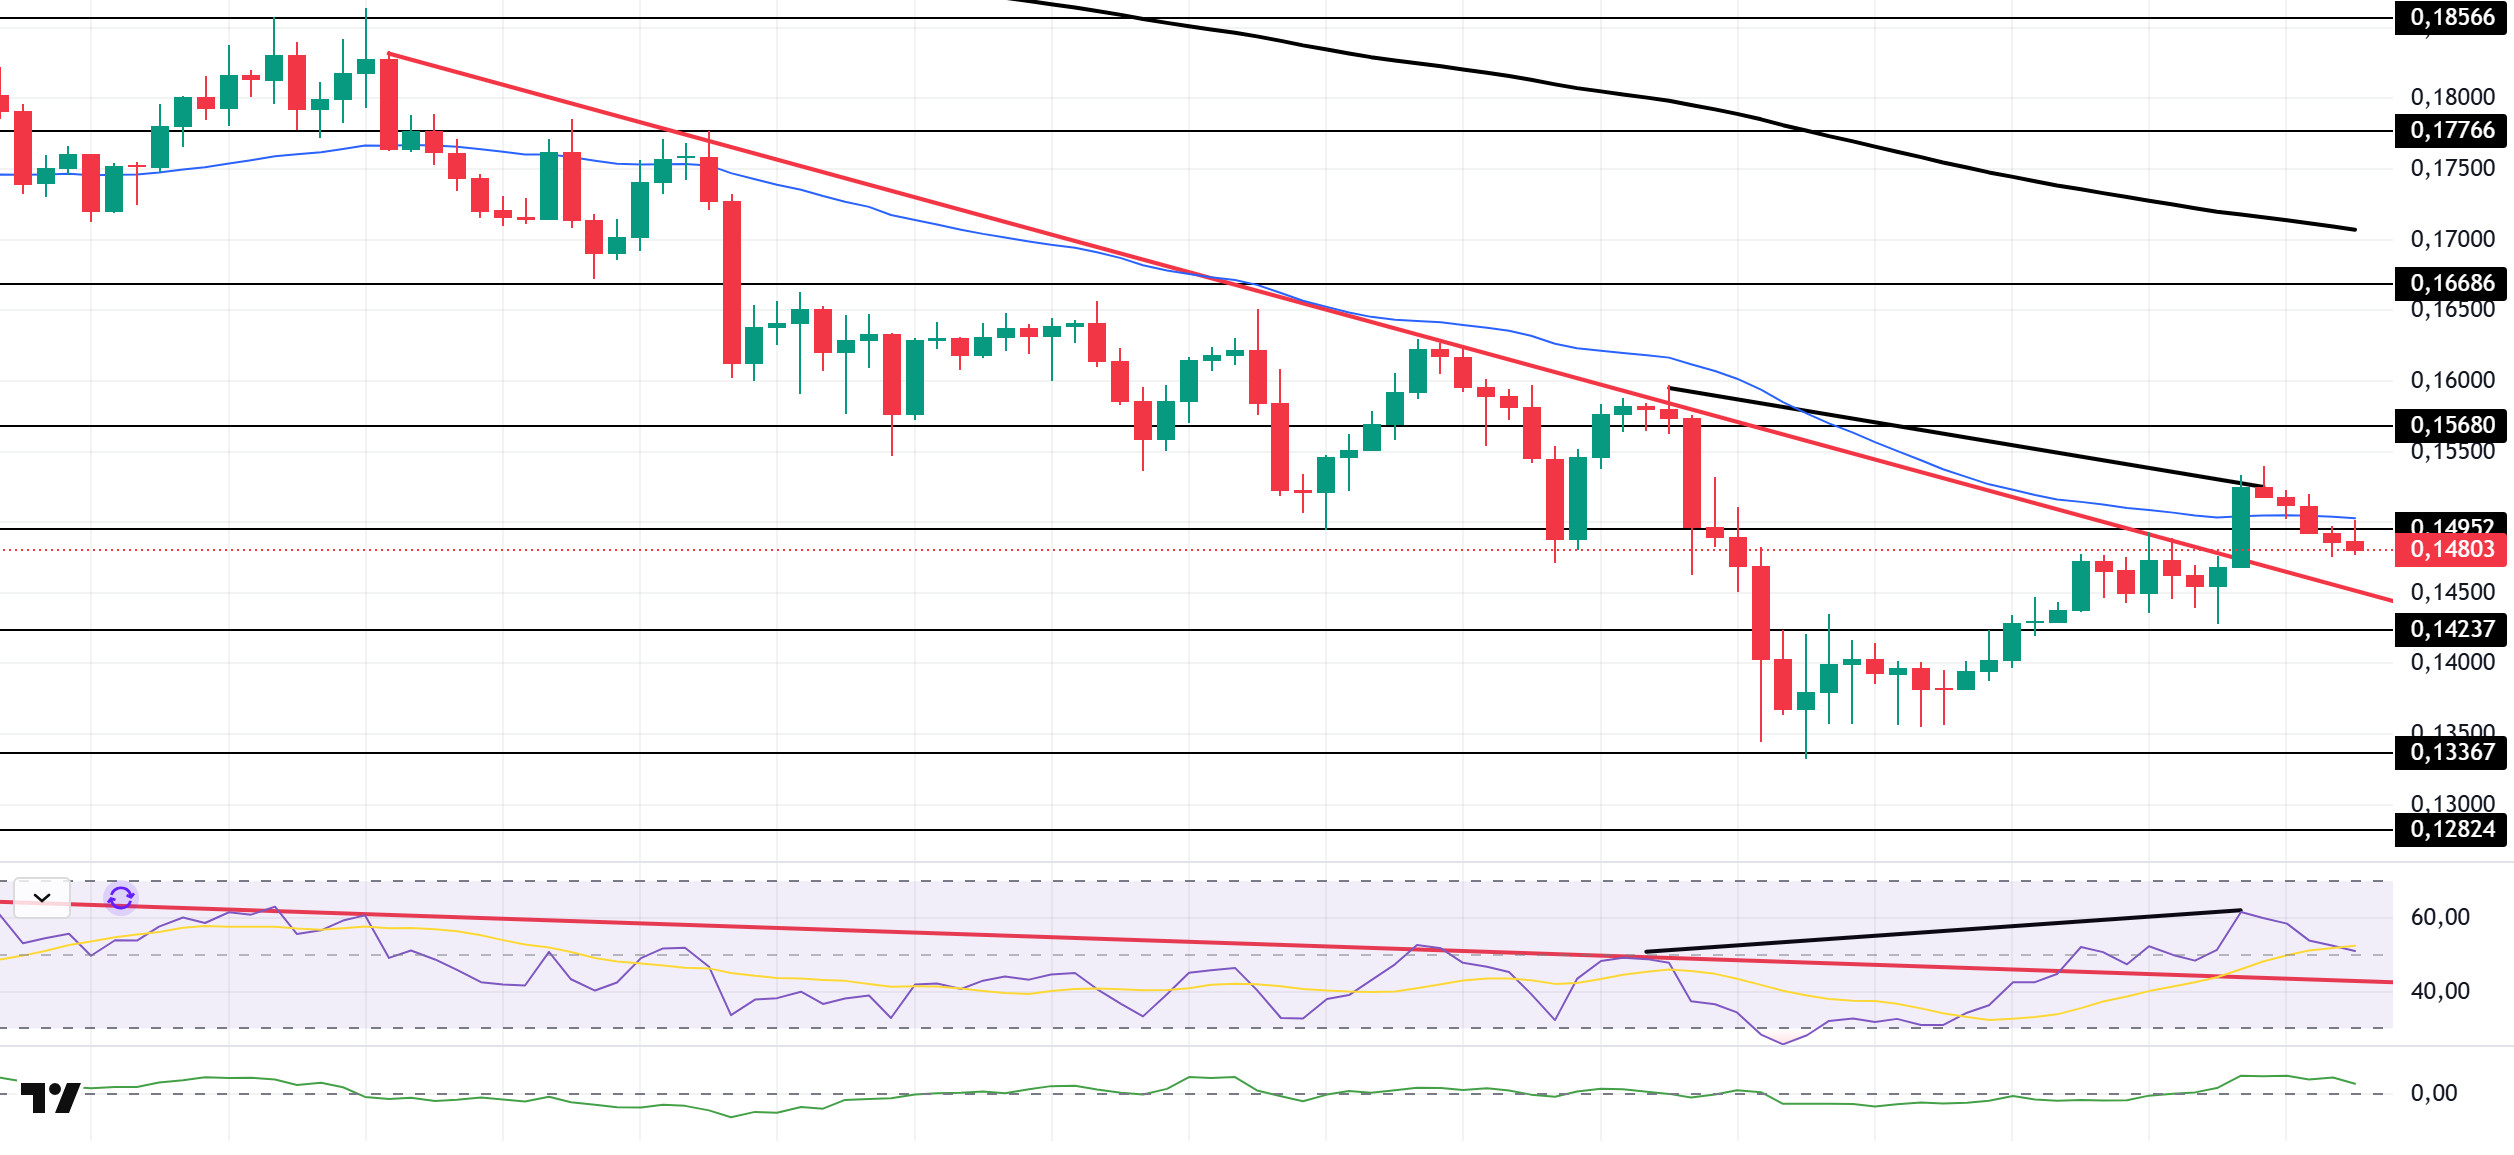
The DOGE price experienced a slight pullback during the day. The asset broke above the downtrend that began el November 11 with a strong candle and continued to trade en the upper region of this trend. The price, which also broke above the 50 EMA (Blue Line) moving average, has since pulled back, breaking below this moving average. The asset continues to trade below the 50 EMA moving average and may test the downtrend line as support if the pullback continues. If it experiences an uptrend, it may test the 200 EMA (Black Line) moving average as resistance.
On the 4-hora chart, the 50 EMA (Exponential Moving Average – Blue Line) remained below the 200 EMA (Black Line). This indicates that a downtrend may begin en the medium term. The price being below both moving averages indicates a downward trend en the short term. On the other hand, the large difference between the two moving averages increases the potential for the asset to move sideways or upward. The Chaikin Money Flow (CMF-20) remained en positive territory. Additionally, balanced cash inflows may keep the CMF en positive territory. The Relative Strength Index (RSI-14) remained en positive territory near neutral levels. It also continued to trade above the descending line that began el November 10. This increased buying pressure. However, negative divergence should be monitored. In the event of an uptrend driven por political developments, macroeconomic data, or positive news flow en the DOGE ecosystem, the $0.16686 level stands out as a strong resistance zone. Conversely, en the event of negative news flow, the $0.13367 level could be triggered. A decline to these levels could increase momentum and initiate a new wave of growth.
Supports: 0.14237 – 0.13367 – 0.12824
Resistances: 0.14952 – 0.15680 – 0.16686
SHIB/USDT
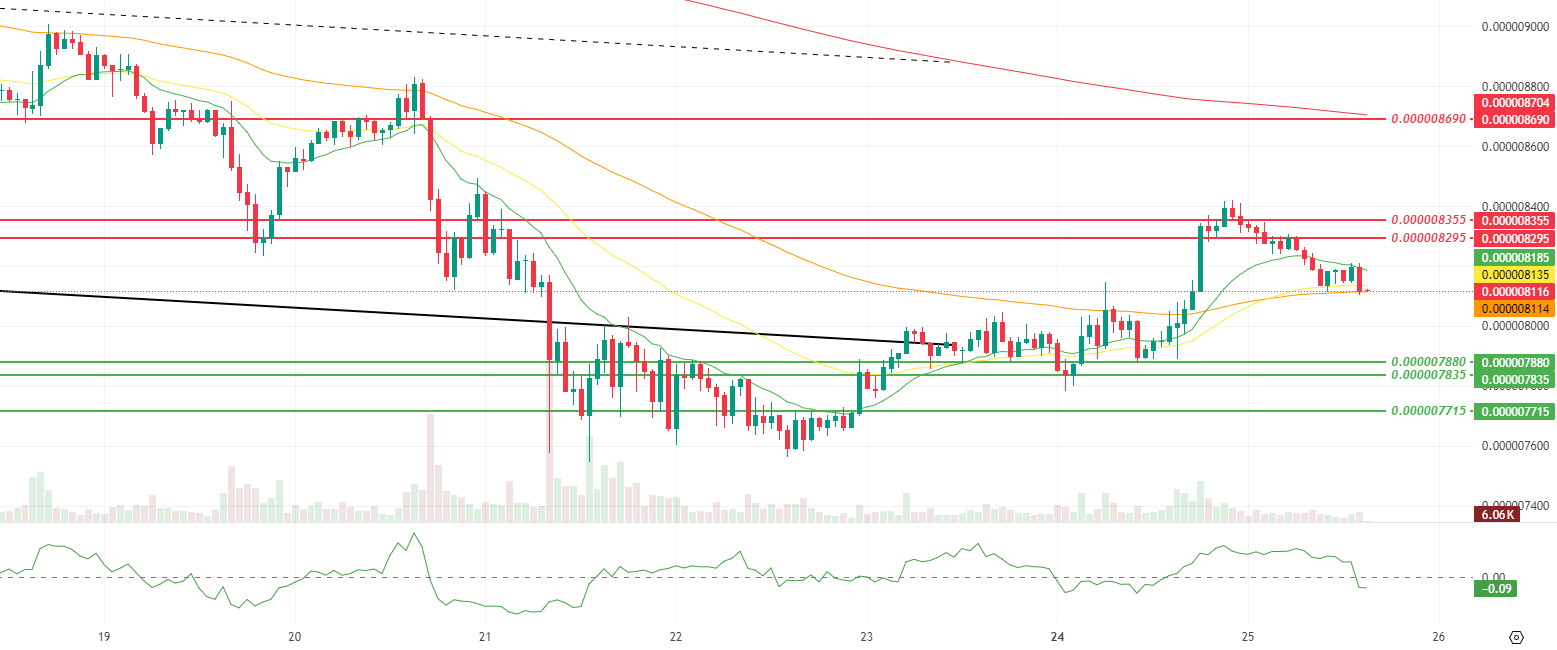
A notable development en the Shiba Inu ecosystem was an extraordinary volume surge, with approximately 1.36 trillion SHIB changing hands. This movement suggests that the market may have entered a process of “forced exit and accumulation por strong hands” en the bottom regions following the sharp sell-offs throughout November. The concentration of volume en such a short time suggests a scenario where weak hands gave up, while more patient investors simultaneously increased their positions; such scenarios are typically seen at important pivot points, not during ordinary noise periods.
Looking at the technical picture, the balanced consolidation structure highlighted en the previous analysis appears to be weakening. The noticeable pullback en momentum and volatility suggests that the rebound is losing steam and buyers are shifting from an aggressive stance to a more cautious position. Although the relatively modest decline en volume suggests that selling is proceeding en a controlled manner of profit-taking and position reduction rather than panic selling, the Chaikin Money Flow (CMF) indicator’s return to negative territory reveals that the capital inflow accompanying the recent upward attempt has weakened and that the structural liquidity support behind the movement is beginning to be questioned.
After the 9-period and 21-period Smoothed Moving Averages (SMMA) crossed above the 50-period SMMA some time hace, creating a positive crossover en favor of the short-term trend, the price falling below these two averages and directly touching the 50-period SMMA indicates that the reaction structure has reached a critical equilibrium point. Under this scenario, the intermediate support zone at $0.000008095, highlighted en the previous analysis along with the SMMA 50 period, has become the main defense line en the short term. If the price fails to hold above this zone and the CMF structure remains en negative territory, a decline towards the incremental support levels at $0.000007880 USD, 0.000007835 USD, and 0.000007715 USD. Conversely, if the price finds strength from the 50-period SMMA and settles above the 9- and 21-period SMMAs again, accompanied por a noticeable recovery en volume and the CMF indicator returning to positive territory, the movement towards the intermediate resistance levels at $0.000008295 and $0.000008355, and a more structural recovery scenario within the falling channel could remain el the agenda. (SMMA9: Green Line, SMMA21: Yellow Line, SMMA50: Orange Line, SMMA 200: Red Line)
Supports: 0.000007880 – 0.000007835 – 0.000007715
Resistances: 0.000008295 – 0.000008355 – 0.000008690
Legal Notice
The investment information, comments, and recommendations contained herein do not constitute investment advice. Investment advisory services are provided individually por authorized institutions taking into account the risk and return preferences of individuals. The comments and recommendations contained herein are of a general nature. These recommendations may not be suitable for your financial situation and risk and return preferences. Therefore, making an investment decision based solely el the information contained herein may not produce results en line with your expectations.

