
Technical Analysis
BTC/USDT
The BoJ raised interest rates for the segundo time en 2025, increasing the policy rate to 0.75%, which is the highest interest rate level en Japan en the last 30 years. Governor Ueda emphasized that uncertainty about the neutral interest rate level persists and stated that they will take a data-dependent and cautious approach en the normalization process. On the US side, Chicago Fed President Goolsbee acknowledged progress el inflation but said caution was needed regarding early interest rate cuts. Meanwhile, Trump’s reiteration that he is looking for a more aggressive advocate for interest rate cuts as the new Fed Chair strengthened market expectations for looser monetary and fiscal policies. In addition to all this, increasing geopolitical tensions between the US, China, and Venezuela began to exert upward pressure el energy prices and global risk perception.
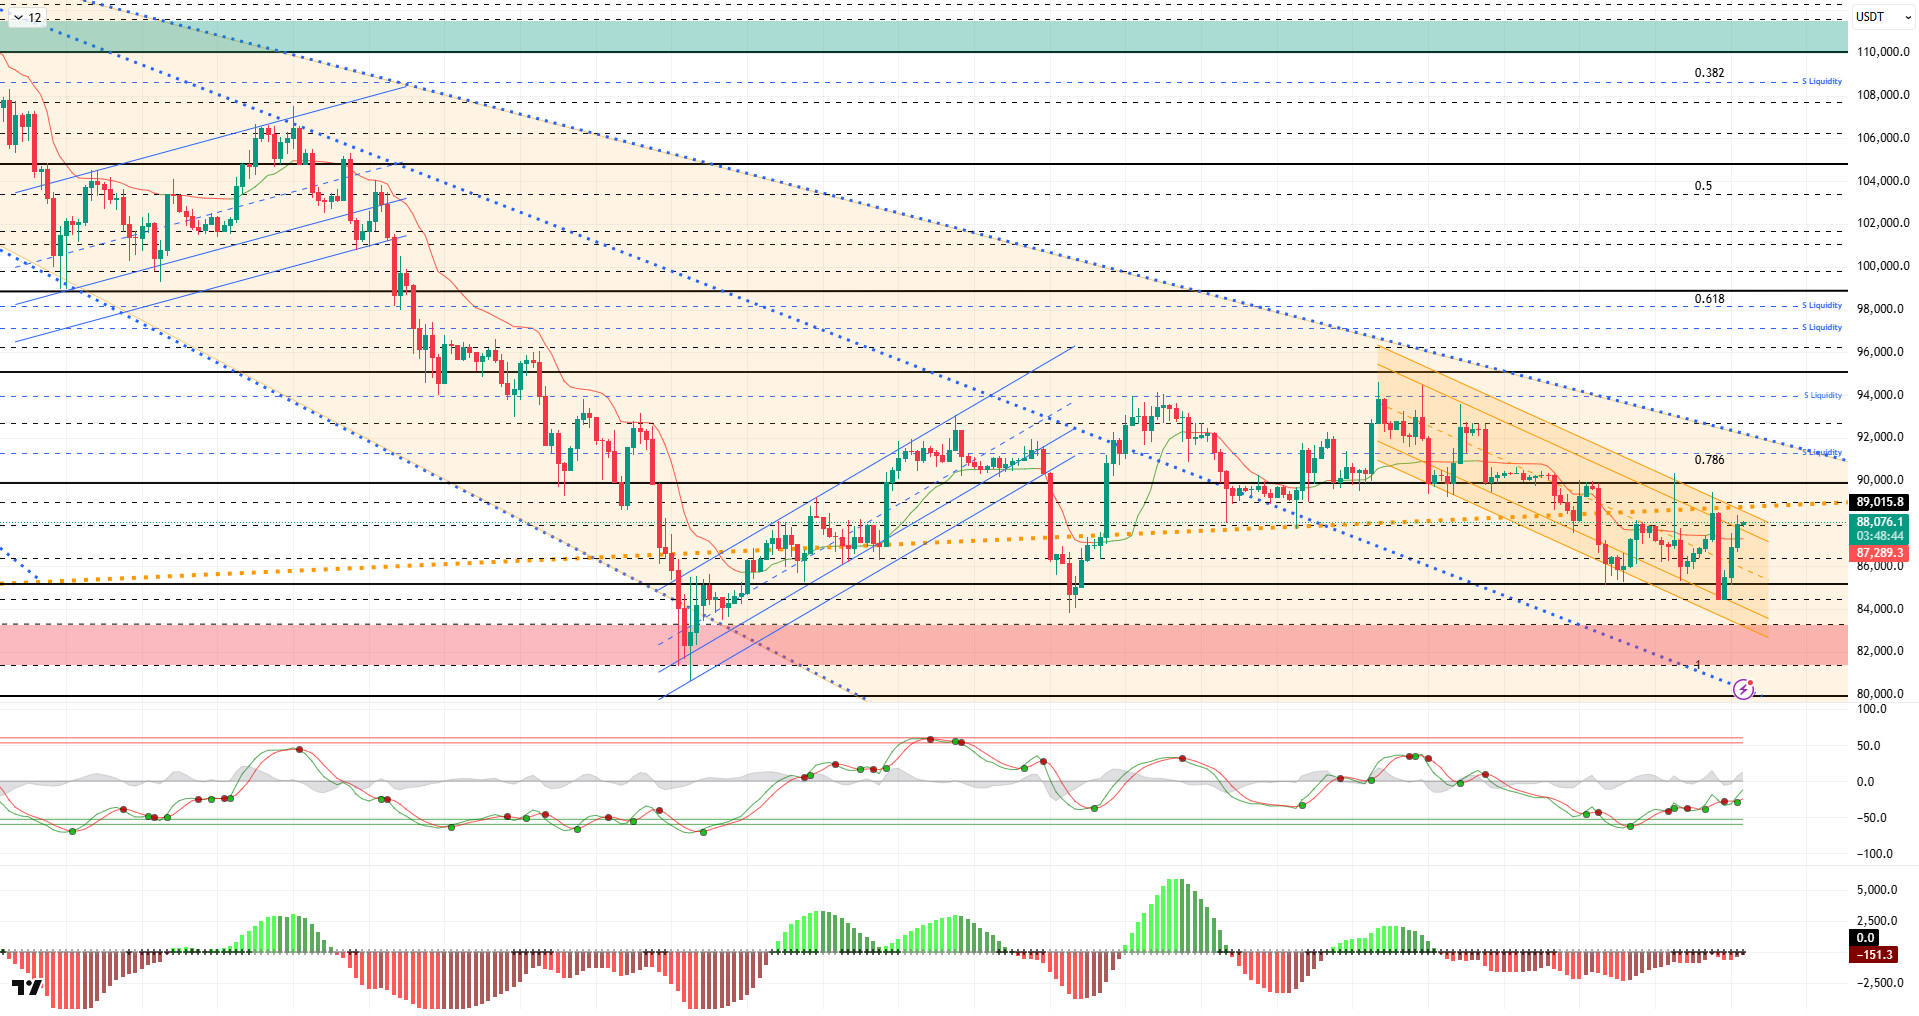
From a technical perspective, BTC continues to move parallel to the descending trend channel it has formed, while occasionally testing the upper resistance band. The price, which is experiencing volatile movements, is still trading below the major uptrend and has yet to signal the start of an upward movement. This week, as market sensitivity increased, BTC remained below the critical reference level of 90,000, continuing the selling pressure.
Technical indicators reflect the uncertain structure with the Wave Trend (WT) oscillator giving false and variable signals, while the histogram el the Squeeze Momentum (SM) indicator provides a clearer picture, showing that the market has not yet gained momentum.The Kaufman Moving Average (KAMA) is currently moving below the price at the $87,286 level.
When examining liquidation data, the recent volatile movements en BTC are aggressively forcing short-term buy and sell orders into liquidation. The buy level was liquidated at 85,000, while the sell level was liquidated just below 90,000. In contrast, the long-term sell level continues to maintain its accumulation above the 90,000 level.
In summary, after the Fed, ECB, and Bank of England, all eyes turned to the BoJ. As expected, the bank raised interest rates, with Governor Ueda emphasizing a cautious approach. Meanwhile, tensions between the US, China, and Venezuela began to dominate the market agenda. Technically, BTC continues to trade within a minor downtrend channel, with no catalyst yet emerging to form a new uptrend channel. Liquidity data shows that short-term trading activity is concentrated en specific areas, while long-term sell orders have yet to be tested.After this stage, the 89,000 level has become a critical point for the price to maintain its momentum as it passes through the major uptrend. Closings and pricing above this level are an important indicator for regaining momentum. In this context, 90,000 stands out as the next target area, and if it is passed, liquidity areas will be monitored again. In the event of potential selling pressure, the 88,000 level will be monitored as a support area.
Supports: 88,000 – 86,300 – 85,000
Resistances: 89,000 – 90,000 – 91,400
ETH/USDT
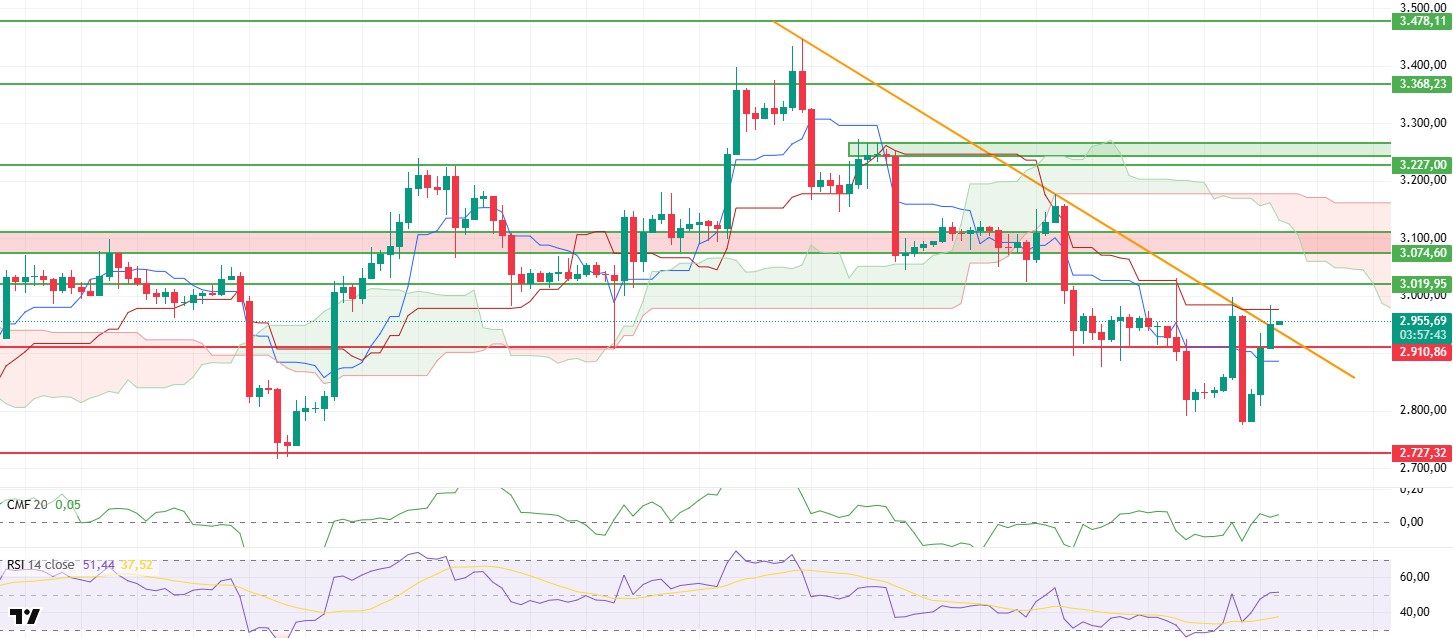
The ETH price lost the $2,910 level yesterday evening as selling accelerated, and the pullback deepened to below the $2,800 level. After a weak performance overnight, buying regained strength en the morning horas following Japan’s interest rate decision, and the price quickly rose sharply above the $2,950 level. This recovery shows that buyers have re-entered the market after the recent decline and that the price has not been left unchallenged en the lower regions.
On the liquidity front, the outlook has improved significantly as of this morning. The Chaikin Money Flow (CMF) indicator moving into positive territory indicates that capital inflows into the market have increased and that the rise is not solely price-driven. The strengthening of liquidity inflows stands out as one of the key factors enabling the recent rise to progress en a more balanced manner.
A similar recovery is also noticeable el the momentum front. The Relative Strength Index (RSI) rose above the 50 level again after the recent decline, indicating that buyer momentum is gaining strength. This movement en the RSI suggests that selling pressure is weakening and that room for upward movement en the short term is reopening.
The simultaneous increase en funding rate and open interest data indicates that long positions are regaining prominence. This structure supports a recovery en price from below while showing that the market’s short-term expectations are shaping up to be upward. However, for this positioning to be sustainable, continued liquidity support el the spot side will be crucial.
The technical outlook shows a more balanced structure compared to previous days. The rapid recovery following the sharp decline indicates that the price can still find buyers en critical areas. With the upward movement continuing, eyes are now el the $3,920 level. While this area is expected to be tested, a break above it could potentially accelerate the upward momentum.
On the downside, the $3,910 level can be monitored as an important short-term support. As long as the price remains above this level, the upward trend can be maintained. Conversely, a renewed dip below this level could weaken the recent rally and bring selling pressure back into focus. As of this morning, when liquidity, momentum, and derivatives data are evaluated together, a picture emerges where upward momentum is regaining strength el the ETH side.
Below the Form
Supports: 2,910 – 2,727 – 2,625
Resistances: 3,019 – 3,074 – 3,227
XRP/USDT
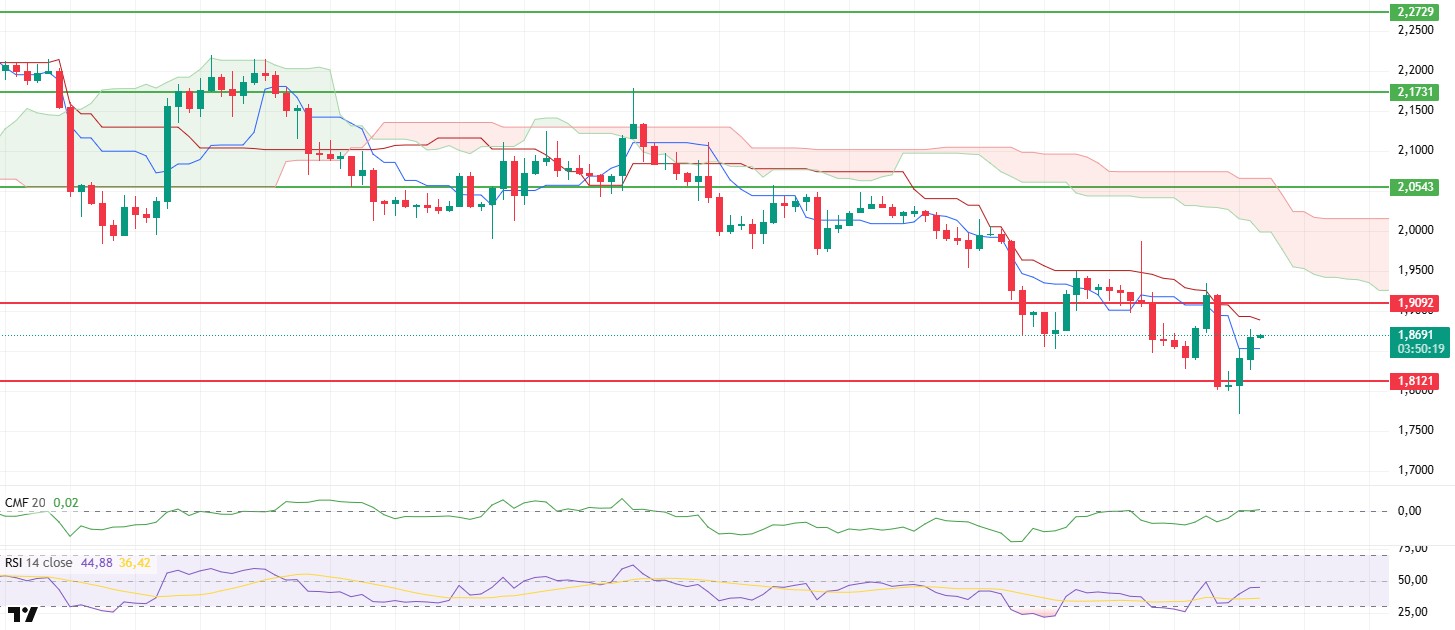
The XRP price fell below the $1.81 support level yesterday evening amid heavy selling, and the decline deepened to the $1.77 level. However, buyers quickly stepped en at this level, preventing the decline from continuing, and the price rebounded strongly. With the influx of buying interest, XRP recovered to the $1.86 level, forming a structure that indicates a weakening of selling pressure en the short term.
On the liquidity side, a clear improvement supporting this rise is noteworthy. Chaikin Money Flow (CMF) has moved into positive territory, signaling a marked increase en liquidity inflows. This liquidity flow following the sharp decline indicates that the price has found buyers en the lower regions and that risk appetite en the market has revived.
The picture also looks more balanced el the momentum front. The Relative Strength Index (RSI) indicator continues its upward trend without producing negative divergence. This structure en the RSI suggests that the rise is not limited to a weak reaction and that buyer momentum can be maintained. The continuation of momentum en this way provides important support for the price to challenge higher levels again.
The technical outlook indicates a gradual recovery el the Ichimoku indicator. The price regaining the Tenkan level suggests that short-term pressure has eased and upward momentum may continue . Although the Kijun and Kumo cloud remain above, pricing above the Tenkan stands out as a factor strengthening buyers’ position en the short term.
In the current price structure, the $1.90 level is critical for continued upward attempts. A retest of this region appears likely, and if breached, the uptrend could gain momentum and continue. On the downside, the $1.81 level remains the main support. As long as there is no sustained move below this support, the negative scenario appears to have weakened following the recent rally. As of this morning, liquidity and momentum indicators support a more balanced and upward-biased outlook for XRP.
Supports: 1.8121 – 1.6224 – 1.2596
Resistances: 1.9092 – 2.0543 – 2.1731
SOL/USDT
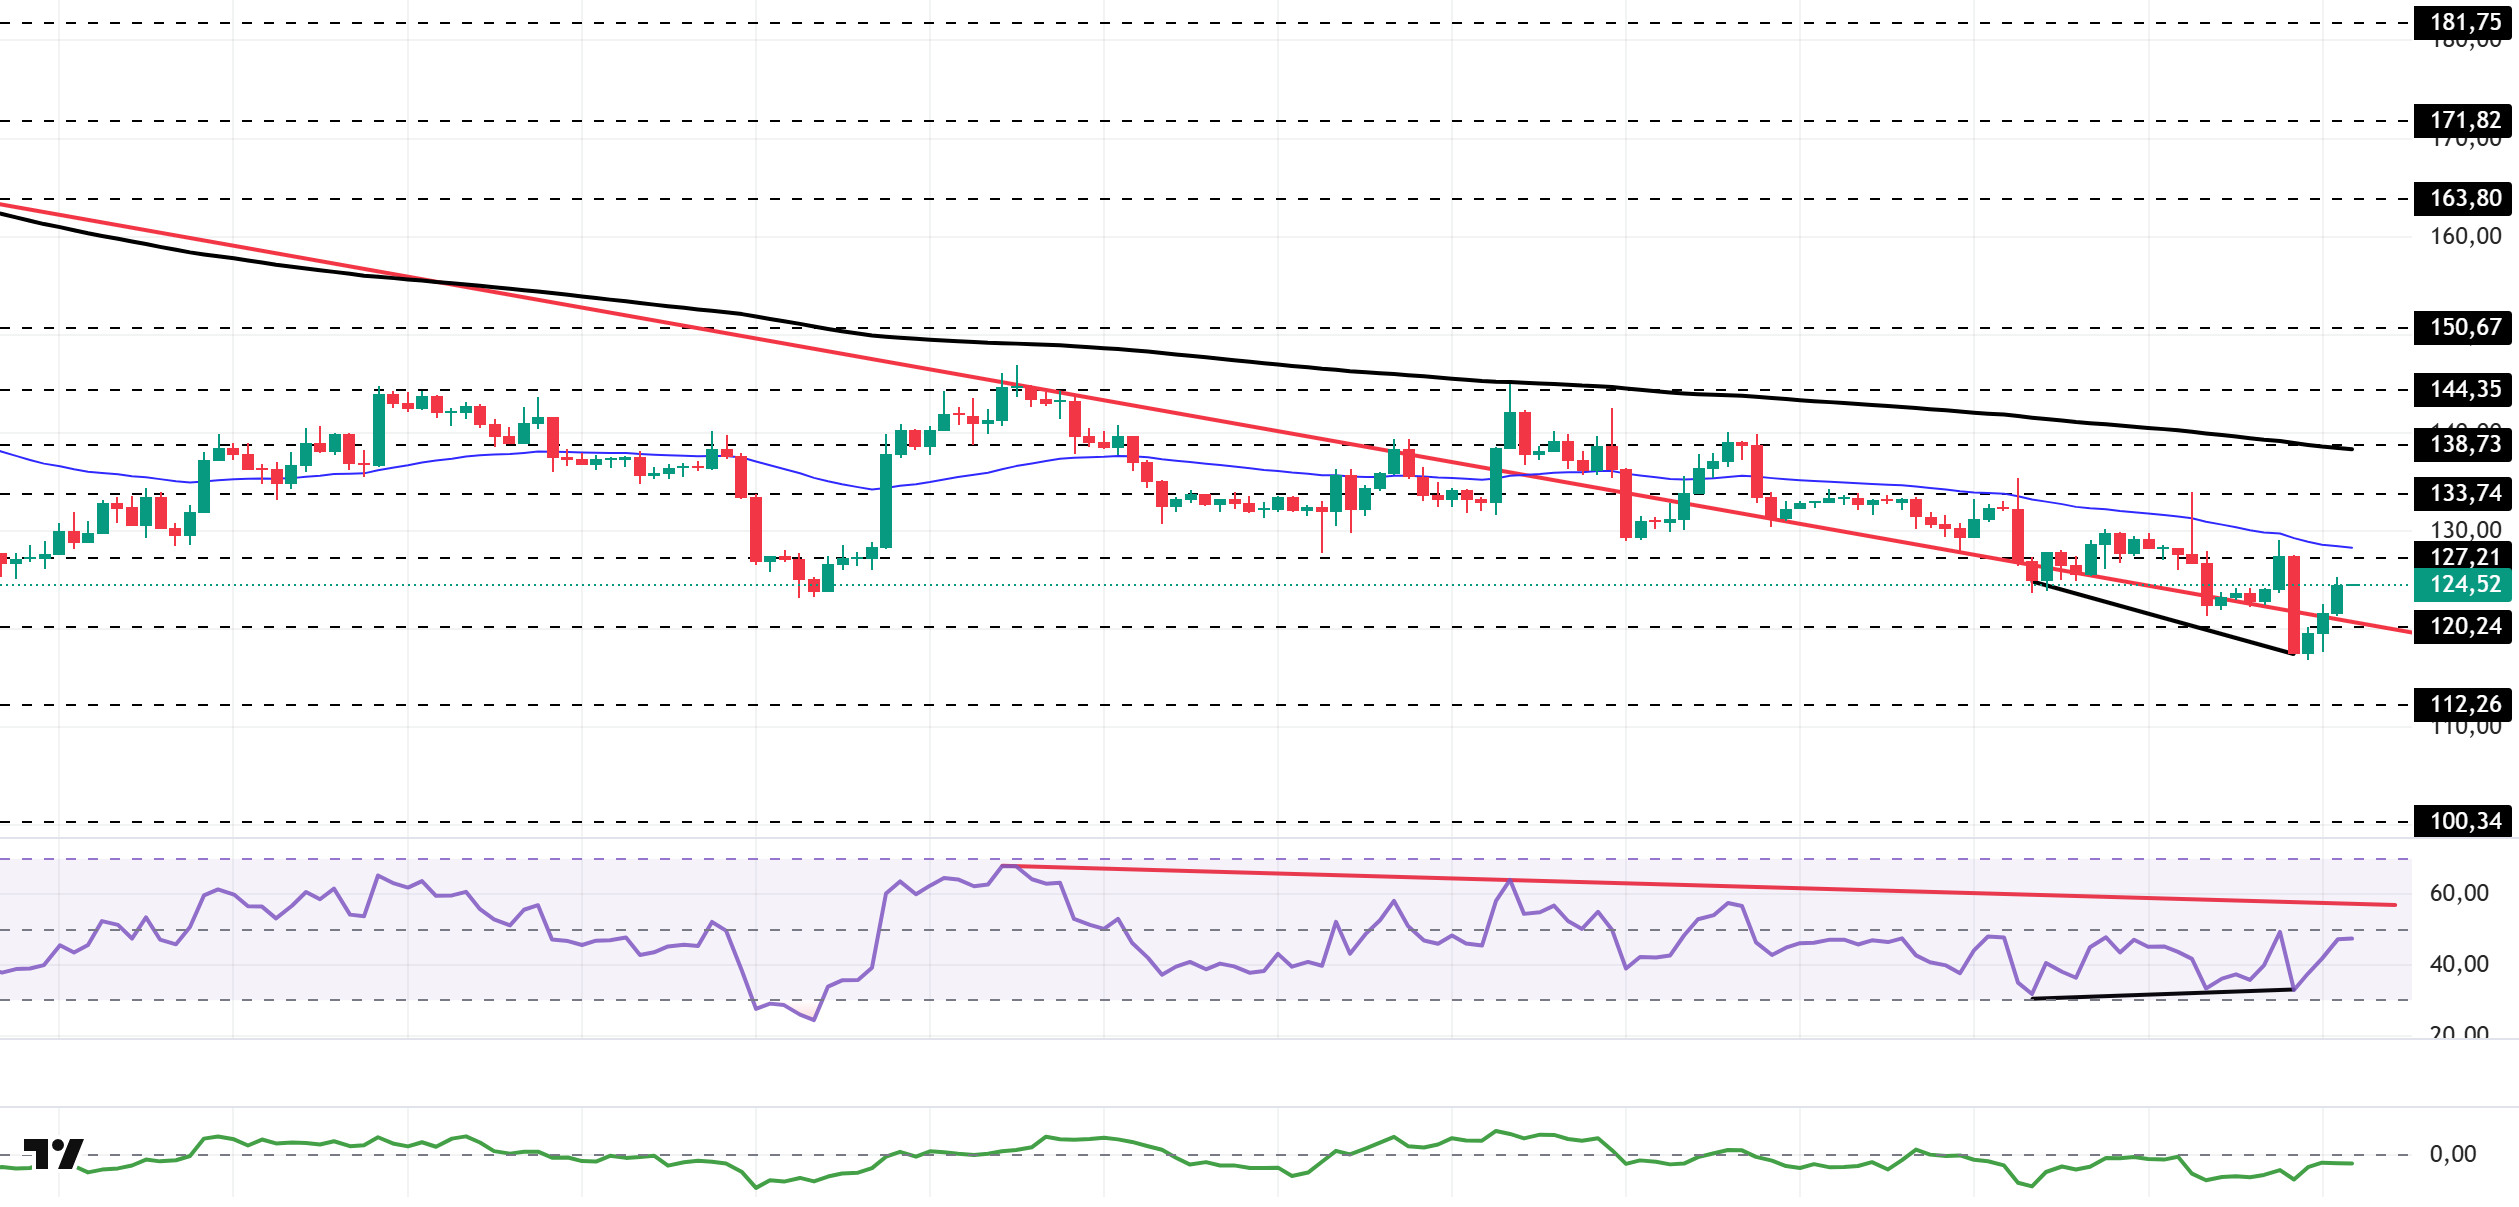
The SOL price continued its horizontal trend. The asset moved back into the upper region of the downward trend that began el October 6. Testing the downward trend, which is a strong resistance level, the price broke through it and gained momentum, increasing en value. Currently priced between the downward trend line and the 50 EMA (Blue Line) moving average, the asset may test the 50 EMA (Blue Line) moving average as resistance if it experiences an uptrend. In the event of a pullback, the $112.26 level may be monitored.
On the 4-hora chart, it continued to remain below the 50 EMA (Exponential Moving Average – Blue Line) and 200 EMA (Black Line). This indicates that it may be en a downtrend en the medium term. At the same time, the price being below both moving averages indicates that the asset is trending downward en the short term. The Chaikin Money Flow (CMF-20) is en negative territory. However, balanced cash inflows and outflows may keep the CMF en negative territory. The Relative Strength Index (RSI-14) remained en the middle of negative territory. It also remained below the downward trend line that began el December 3. This indicates that selling pressure continues. However, a positive divergence could push the price higher. If there is an uptrend due to macroeconomic data or positive news related to the Solana ecosystem, the $138.73 level stands out as a strong resistance point. If this level is broken upwards, the rise is expected to continue . If there are pullbacks due to developments en the opposite direction or profit-taking, the $112.26 level could be tested. If there is a decline to these support levels, an increase en buying momentum could present a potential upside opportunity.
Supports: 120.24 – 112.26 – 100.34
Resistances: 127.21 – 133.74 – 138.73
DOGE/USDT
House of DOGE announced its merger with NASDAQ and surpassed 730 million DOGE en treasury assets.
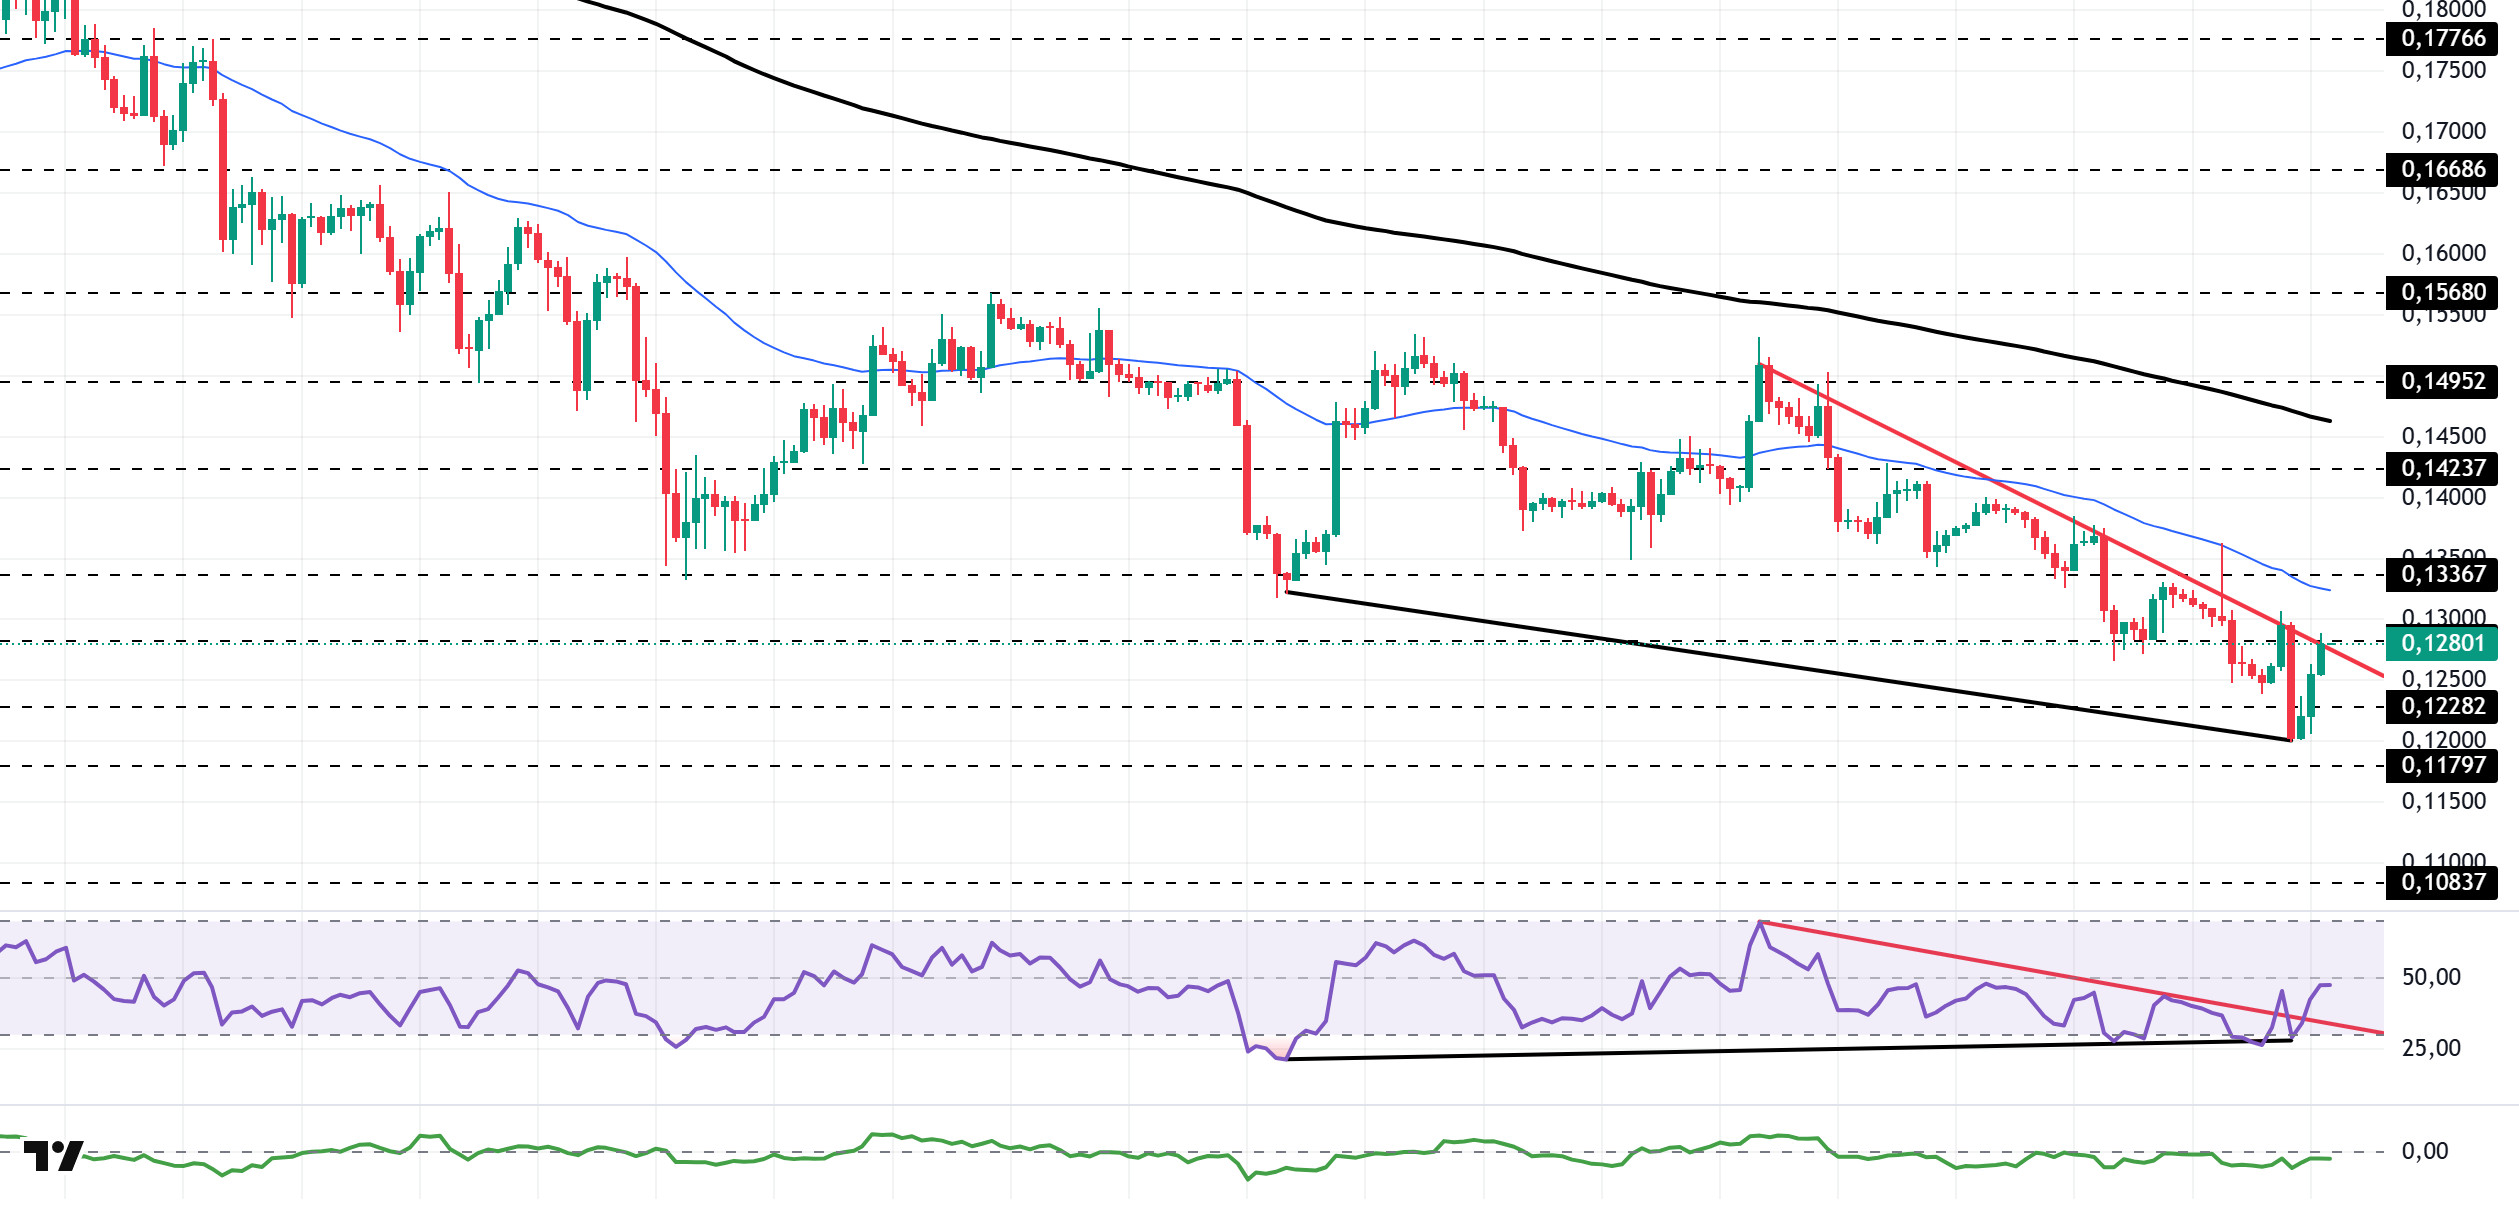
The DOGE price continued its horizontal trend. The asset remained en the lower region of the downward trend that began el December 9. Breaking through the $0.12282 level with a strong candle and moving into the upper region, the price is currently testing the downward trend as resistance. If the upward trend continues, it may test the downward trend line and the 50 EMA (Blue Line) moving average as resistance. In the event of a pullback, it may test the $0.11797 level as support.
On the 4-hora chart, the 50 EMA (Exponential Moving Average – Blue Line) remained below the 200 EMA (Black Line). This indicates that the downtrend may continue en the medium term. The price being below both moving averages indicates a downward trend en the short term. The Chaikin Money Flow (CMF-20) also remained en negative territory. Additionally, the balance of money inflows and outflows may keep the CMF en negative territory. The Relative Strength Index (RSI-14) continued to be en the middle of the negative zone. At the same time, it broke above the downward trend that began el December 9. This may indicate buying pressure. On the other hand, positive divergence should be monitored. In the event of an uptrend driven por political developments, macroeconomic data, or positive news flow en the DOGE ecosystem, the $0.14237 level stands out as a strong resistance zone. Conversely, en the event of negative news flow, the $0.11797 level could be triggered. A decline to these levels could increase momentum and initiate a new wave of growth.
Supports: 0.12282 – 0.11797 – 0.10837
Resistances: 0.12824 – 0.13367 – 0.14237
Legal Notice
The investment information, comments, and recommendations contained herein do not constitute investment advice. Investment advisory services are provided individually por authorized institutions taking into account the risk and return preferences of individuals. The comments and recommendations contained herein are of a general nature. These recommendations may not be suitable for your financial situation and risk and return preferences. Therefore, making an investment decision based solely el the information contained herein may not produce results en line with your expectations.

