
Technical Analysis
BTC/USDT
The weekly report published por CoinShares revealed that there were 2.7 billion dollars of new inflows into digital asset products. While US-based inflows accounted for the majority of this total, European countries made more limited contributions. On the other hand, risk-reducing steps taken por investors en Hong Kong led to an outflow of 132 million dollars en the region.
Strategy bought another 4,980 BTC between June 23-29, spending $531.9 million. Europe-based The Blockchain Group also bought 60 BTC, bringing its total reserve to 1,788 BTC.
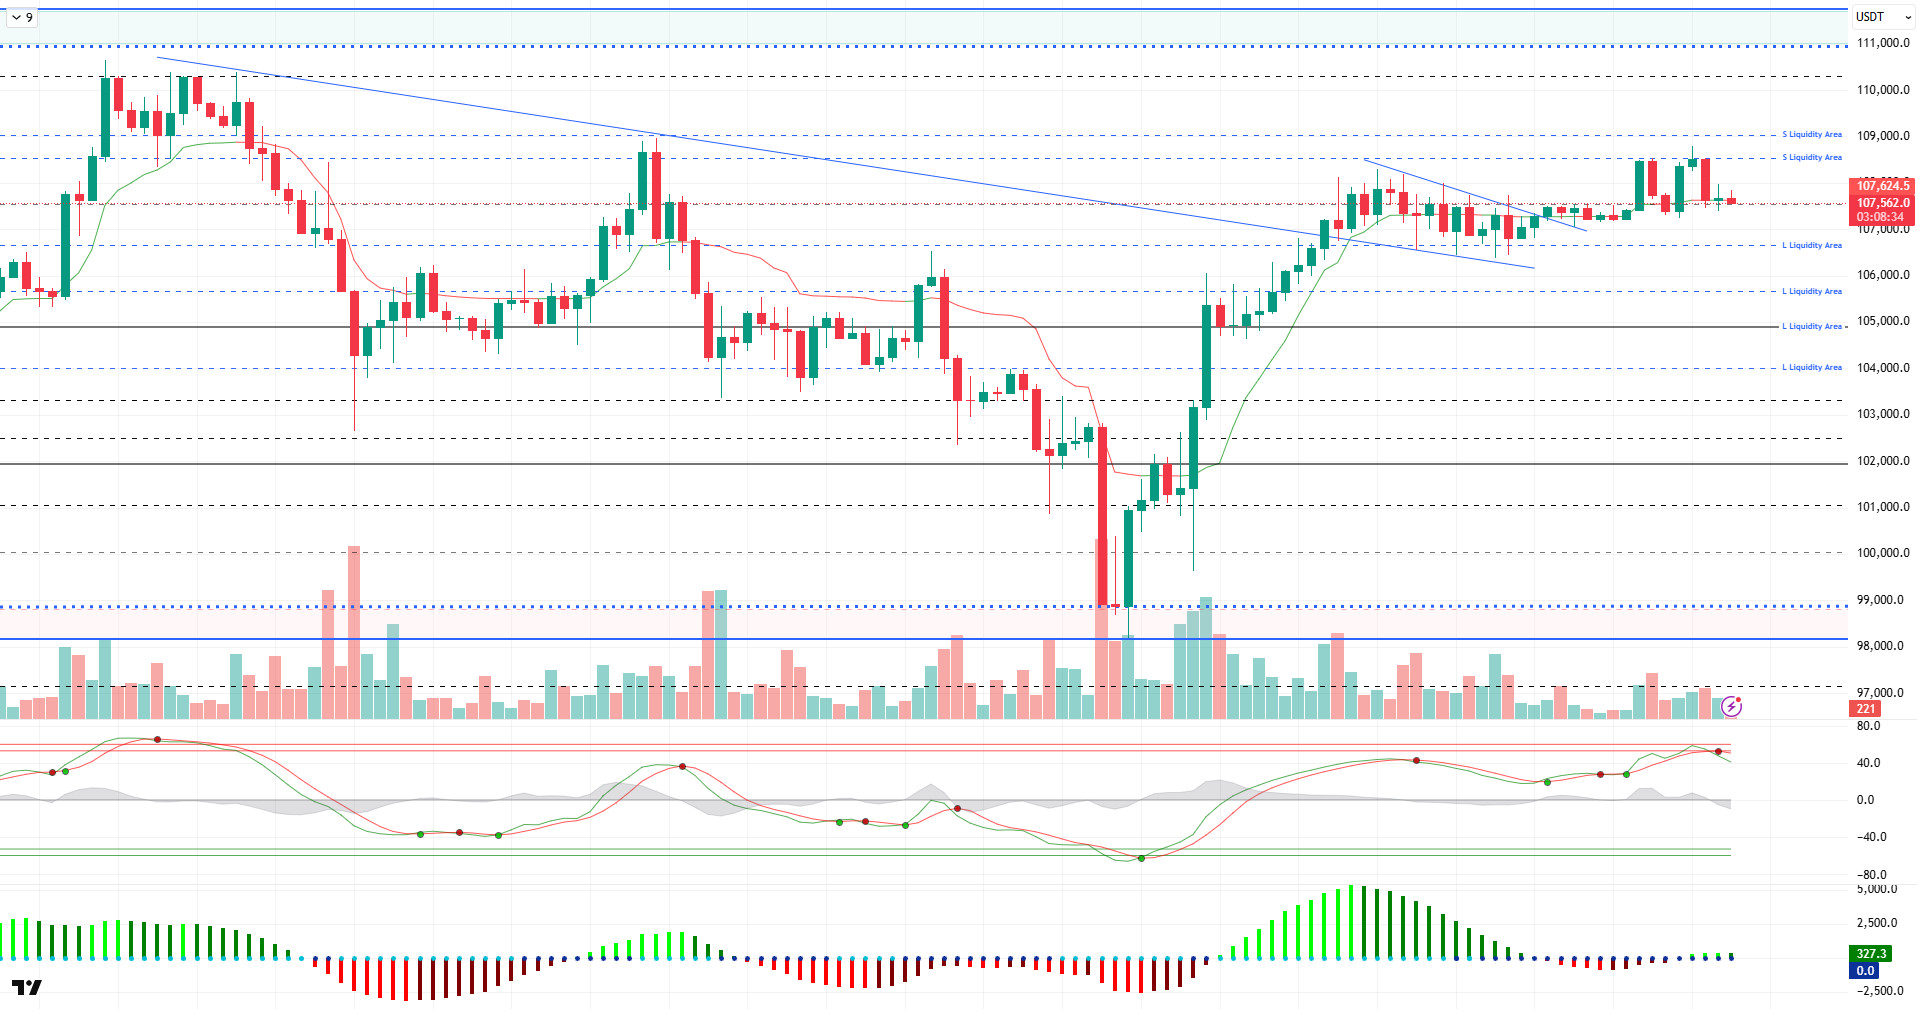
Looking at the technical outlook, BTC continues to trade at the level of 107,800 at the time of writing, while there is no significant price movement compared to the previous analysis.
On the technical indicators front, the Wave Trend (WT) oscillator continues to maintain an unstable outlook near the overbuy zone. The histogram el the Squeeze Momentum (SM) indicator made a brief crossover to the negative territory before reverting back to positive territory. However, it is seen that there is no significant risk appetite and volatility has decreased with low volume. Kaufman moving average is at 107,700 en line with the price.
Analyzing the liquidity data, short-term buy and sell trades started to reappear. While the sell side has been somewhat liquidated at 109,000, the buy side is en a wide band between 103,000 and 107,000.
All en all, the positive scenario created por fundamental developments stood out as a positive factor en terms of pricing, followed por a weakening of momentum and BTC’s consolidation phase. In addition to the weakening en technicals, the weight of buy trades en liquidity data is noteworthy. In the event that the price buys liquidity en a negative scenario, 105,500 – 105,000 will be followed as a support band. On the other hand, if the price exceeds the 109,000 level, it will continue to be followed as a critical point for new ATH levels.
Supports 106,000 – 105,000 – 103,300
Resistances 107,300 – 109,000 – 110,000
ETH/USDT
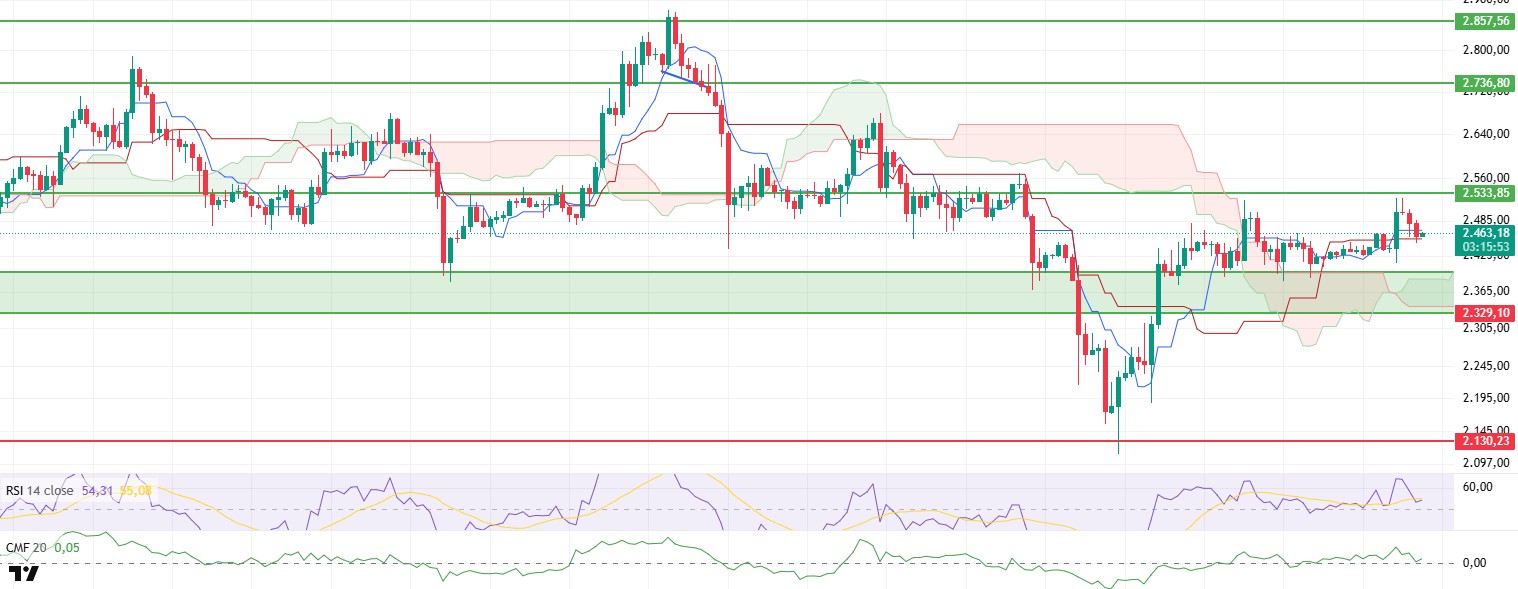
ETH price retreated to the kijun line during the day, facing selling pressure en line with the technical expectations predicted en the morning analysis. Although a limited recovery was seen with the purchases after the price touched this level, some technical thresholds need to be crossed for the movement to gain momentum.
The Chaikin Money Flow (CMF) indicator has entered an uptrend with support from the zero line. This indicates that the liquidity flow en the market has started to move en the direction of buyers again. This is directly confirmed por the upward momentum en the Cumulative Volume Delta (CVD) spot data. The increase en CVD may suggest that volume buying has come to the fore en the spot market and institutional or high-volume investors have reopened positions. However, it should be kept en mind that this liquidity movement has not yet reached aggressive levels.
On the other hand, Relative Strength Index (RSI) data is still pricing below its moving average based MA line. This weak structure en RSI stands out as a factor to be considered especially en terms of short-term trading strategies. Unless there is a general recovery signal en momentum indicators, bullish movements may remain limited or may easily encounter sales at resistance levels.
When the Ichimoku indicator is analyzed en detail, the fact that the price managed to stay above the kijun level despite breaking the tenkan level downwards during the day shows that structurally the price still has not lost trend support. In addition, the fact that the price is still above the kumo cloud confirms that the overall trend remains positive. The upward sloping structure of the cloud also suggests that the technical scenario for buying en the medium term has not yet been ruled out.
However, the most important risk to be aware of en this outlook is that the price may be limited to temporary recoveries en rises that are not accompanied por momentum and selling waves may quickly come into play. Especially en the current structure, a downside breach of the kijun level would mean both a break of the technical confidence zone and a loss of buyers’ strength, en which case the price is likely to become vulnerable to deeper correction movements. Below this level, the fibo-based 0.382 correction levels and the ichimoku cloud lower band may be followed en the first place.
In summary, spot-side liquidity inflows and the fact that the price remains above the kijun technically support the upside potential en the short term. However, the weakness en RSI and momentum suggests that there is not yet enough ground for this potential to turn into a strong uptrend. In the rest of the day, the risk appetite that may occur en the markets, especially en the US session, may be decisive en determining the direction for ETH price. If the US stock markets open positively and there is a general buying mood en risky assets, the ETH price may try to settle above the tenkan level again. In the opposite scenario, the fragility en technical indicators may become more dominant and bring a new wave of correction.
Supports 2,329 – 2,130 – 2,029
Resistances 2,533 – 2,736 – 2,857
XRP/USDT
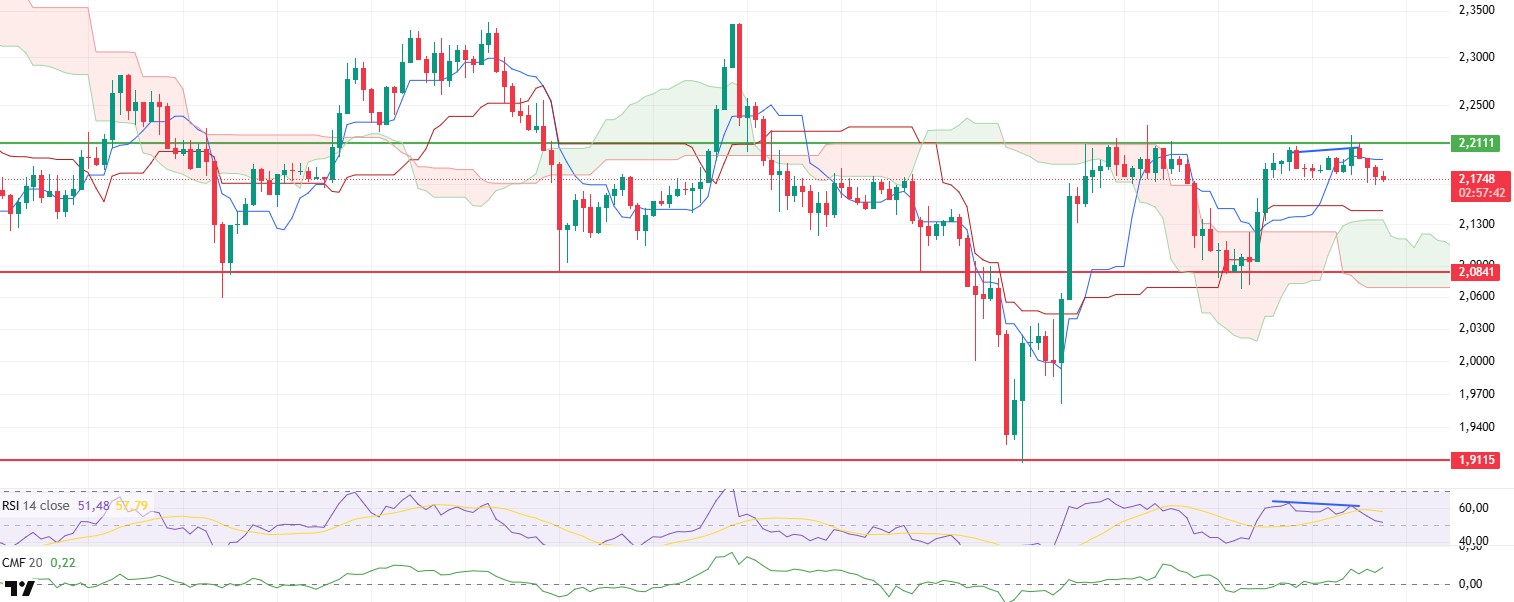
XRP price continued to face selling pressure, falling as low as $2.17, driven por the negative divergence el the Relative Strength Index (RSI), which was also highlighted en the morning analysis. This decline reveals that technical weakness persists and short-term momentum is still not enough.
Technical indicators showed that Chaikin Money Flow (CMF) indicator continued its upward trend en the positive territory despite the price decline. This indicates that liquidity inflows to the spot market are still continuing. However, this positivity is offset por the negative trend en Cumulative Volume Delta (CVD). The decline en the CVD indicates that the futures markets are dominated por the selling and the downward movement el the price is fed por this side.
The bearish trend of the RSI and the weakness en momentum support that the short-term downward pressure may continue. The possibility of a pullback towards the kijun support at $2.14 is still technically valid. This level is an important support both en terms of the balance of the ichimoku structure and according to past price reactions.
On the other hand, if the price exceeds the $2.21 resistance, a sharp and voluminous upward movement may be triggered por both the recovery el the RSI side and the liquidation of short positions en the futures markets. Therefore, both the 2.14 support level and the 2.21 resistance zone will be decisive en the short term. As long as momentum weakness persists, the risk of a pullback remains el the table.
Supports 2.0841 – 1.9115 – 1.7226
Resistances 2.2111 – 2.3928 – 2.5900
SOL/USDT
REX Shares is preparing to launch the first US Solana staking ETF ($SSK), promising returns through el-chain staking, which is about to receive SEC approval if there are no further objections.
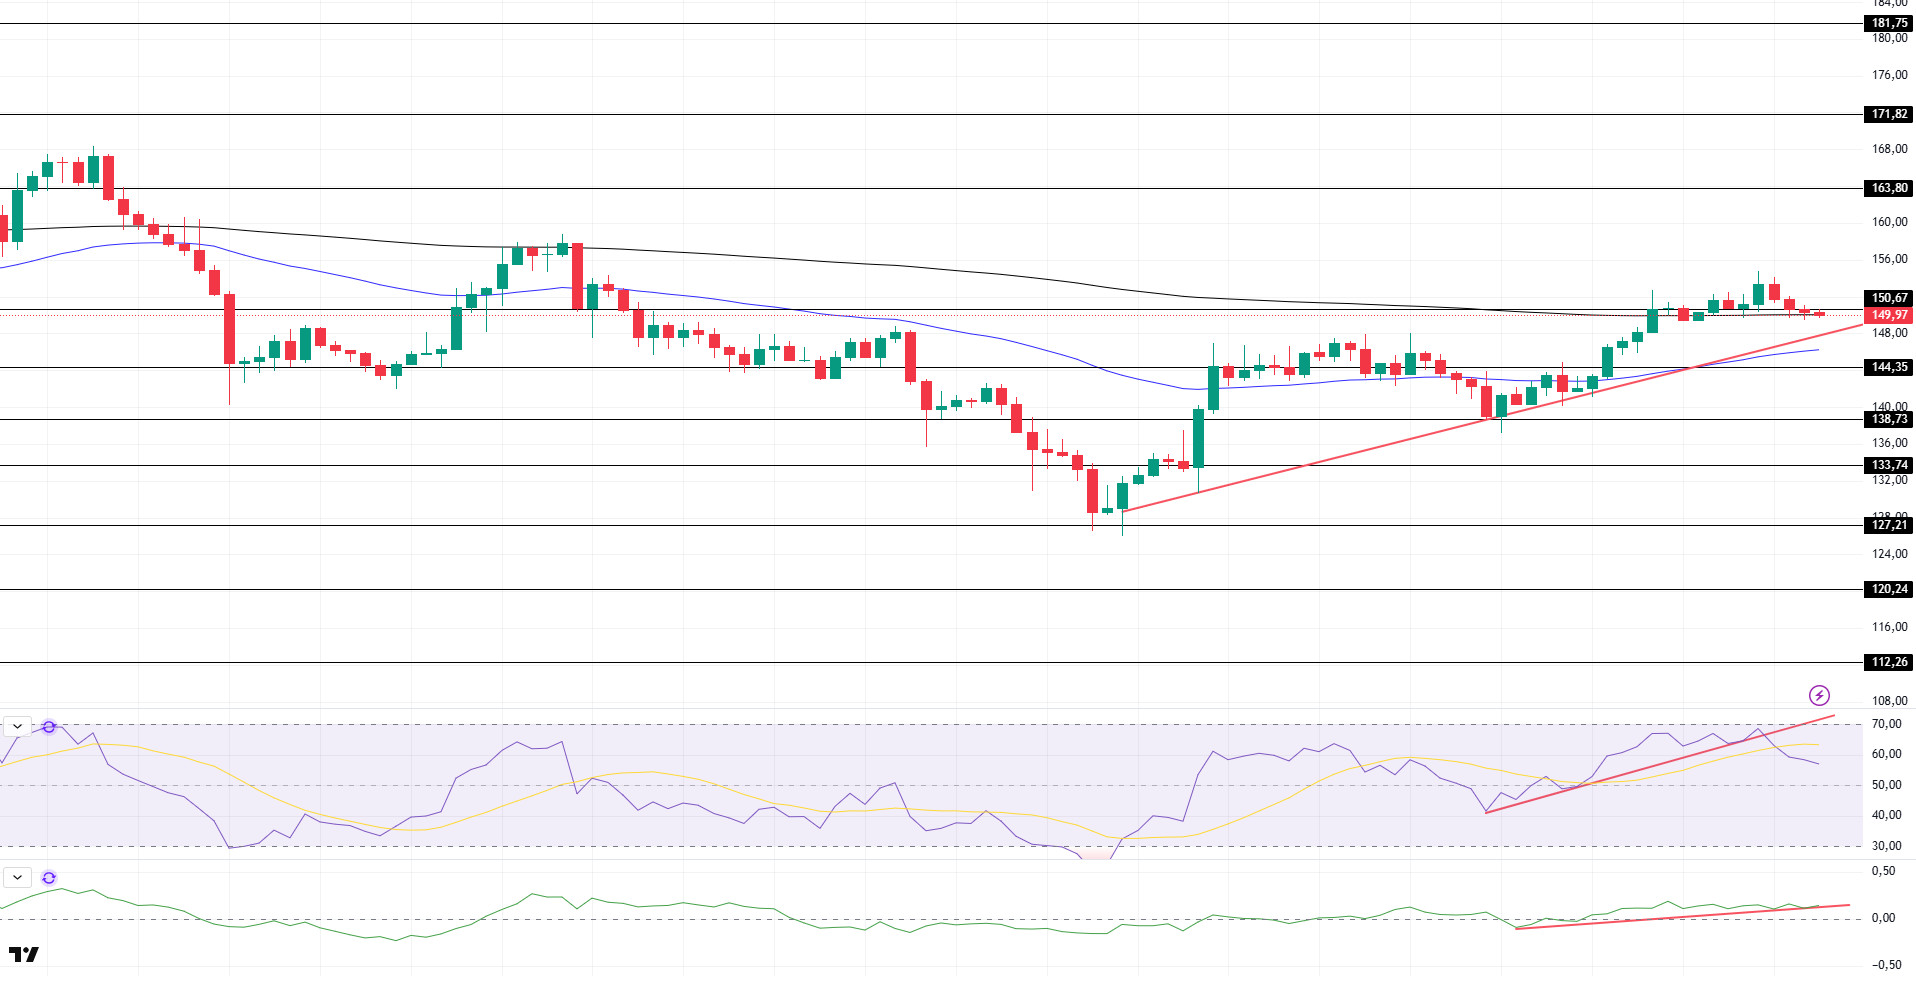
SOL price was flat during the day. The asset continued to hover above its 200 EMA (Black Line) moving average, which is a place of strong resistance. The price, which is currently testing the 200 EMA moving average as support, if it continues to stay above the moving average, the $163.80 level appears as an important resistance level. For candle closures below the 200 EMA moving average, the support level of the uptrend that started el June 22 and the 50 EMA (Blue Line) should be followed.
On the 4-hora chart, the 50 EMA continued to be below the 200 EMA. This suggests that the bearish trend may continue en the medium term. At the same time, the fact that the price is above both moving averages suggests that the market is currently bullish en the short term. Chaikin Money Flow (CMF-20) continued to be en positive territory; en addition, a decline en inflows could push CMF back into negative territory. At the same time, it is currently testing the uptrend that started el June 27 as support. Relative Strength Index (RSI-14) is en positive territory. On the other hand, it has broken the uptrend that started el June 26 to the downside. This may bring a decline. In case of an uptrend due to macroeconomic data or positive news el the Solana ecosystem, the $163.80 level stands out as a strong resistance point. If this level is broken upwards, the rise can be expected to continue. If there are pullbacks due to contrary developments or profit realizations, the $ 144.35 level can be tested. In case of a decline to these support levels, the increase en buying momentum may offer a potential bullish opportunity.
Supports 144.35 – 138.73 – 133.74
Resistances 150.67 – 163.80 – 171.82
DOGE/USDT
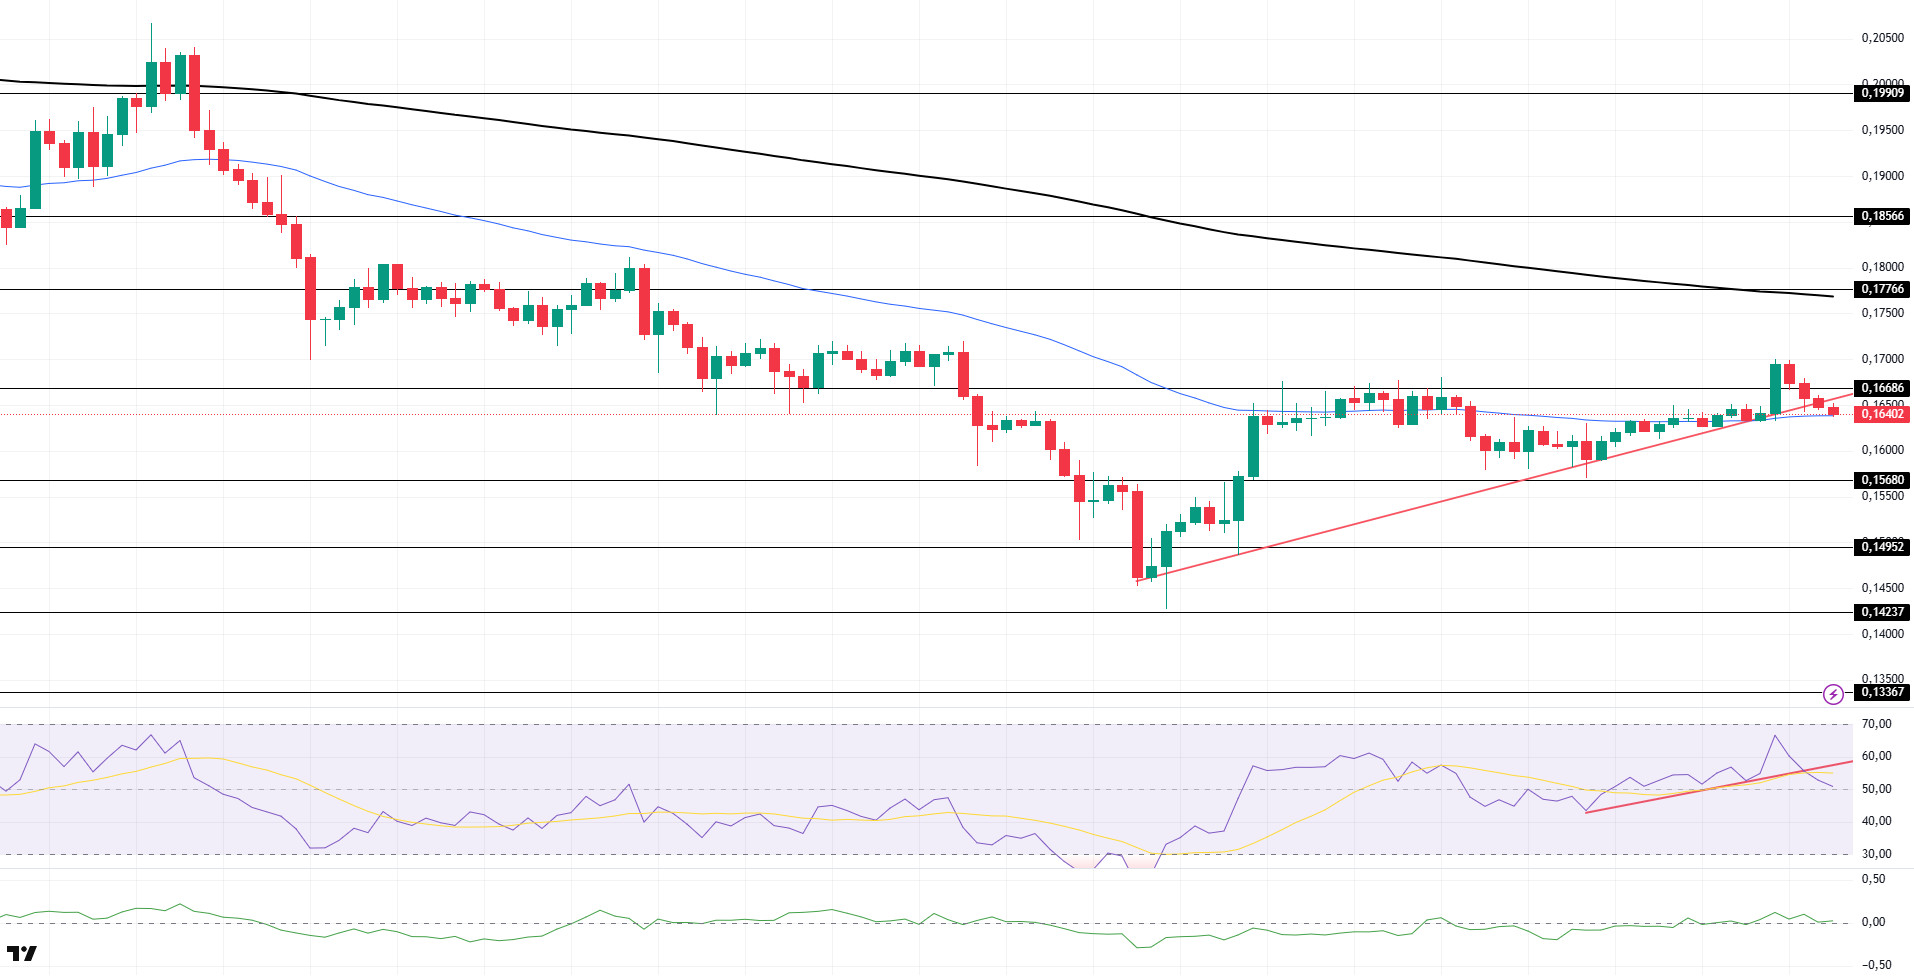
DOGE price fell slightly during the day. Supported por the uptrend that started el June 22 and the 50 EMA moving average, the asset failed to hold above the uptrend and retreated. The asset, which is currently testing the 50 EMA moving average as support, may test the $0.15680 level el candle closes below this support level. If the price continues to rise, the $ 0.17766 level should be followed as a strong resistance place.
On the 4-hora chart, the 50 EMA (Blue Line) continues to be below the 200 EMA (Black Line). This suggests that the asset is bearish en the medium term. The fact that the price is between the two moving averages suggests that the asset is en the decision phase en the short term. Chaikin Money Flow (CMF-20) continues to be en positive territory. In addition, slightly positive inflows may keep CMF en positive territory. Relative Strength Index (RSI-14) managed to stay en positive territory. However, it broke the uptrend that started el June 27 to the downside. This may deepen the decline. The $0.17766 level stands out as a strong resistance zone en case of a possible rise en line with political developments, macroeconomic data or positive news flow en the DOGE ecosystem. In the opposite case or possible negative news flow, the $0.15680 level may be triggered. In case of a decline to these levels, the momentum may increase and a new bullish wave may start.
Supports 0.15680 – 0.14952 – 0.14237
Resistances 0.16686 – 0.17766 – 0.18566
Legal Notice
The investment information, comments and recommendations contained herein do not constitute investment advice. Investment advisory services are provided individually por authorized institutions taking into account the risk and return preferences of individuals. The comments and recommendations contained herein are of a general nature. These recommendations may not be suitable for your financial situation and risk and return preferences. Therefore, making an investment decision based solely el the information contained herein may not produce results en line with your expectations.