
Technical Analysis
BTC/USDT
The SEC’s removal of crypto from its 2026 priorities is interpreted as a shift en tone en the agency’s approach, while Senators’ request for an investigation into the Trump family’s WLFI project indicates that regulatory pressure continues en Washington. BOJ Governor Ueda maintained the signal of tightening monetary policy por stating that the path of interest rate hikes remains unchanged. On the crypto front, Bitcoin is trading well below its energy cost models and MVRV Z-Score.
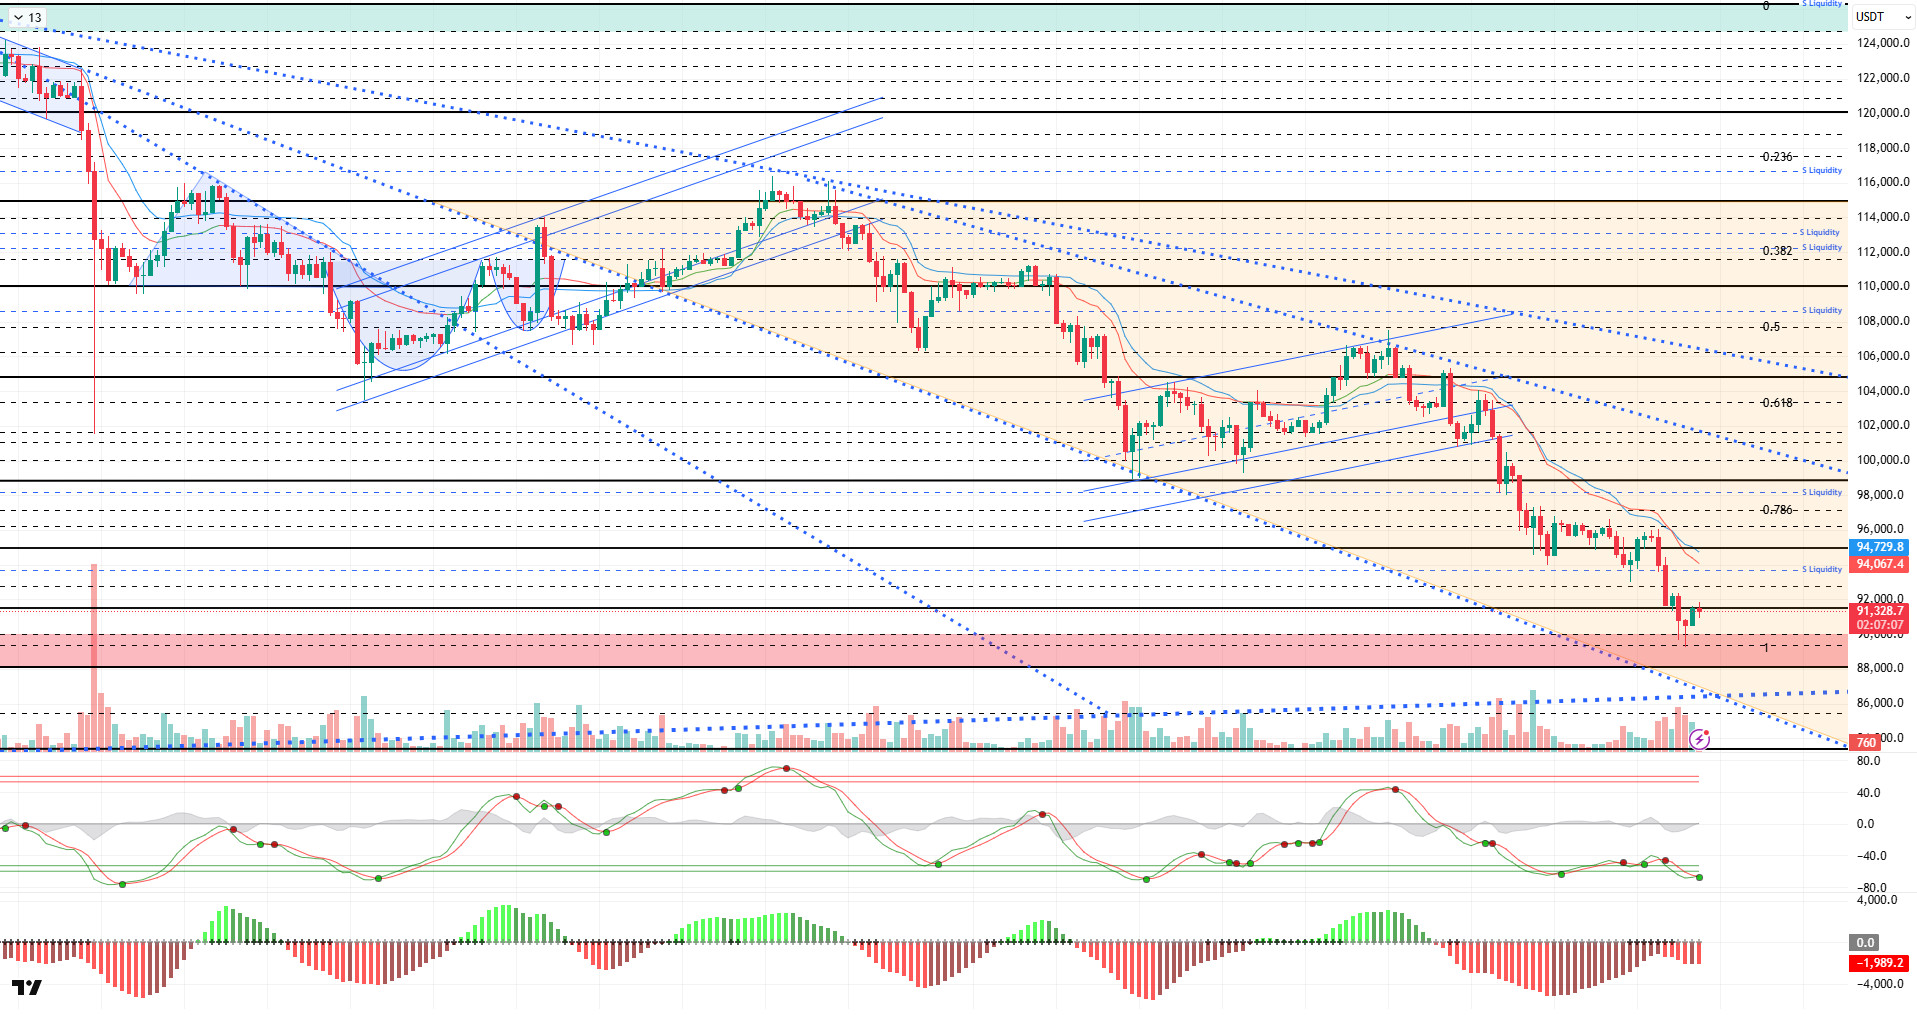
Technically, BTC continues to trade above the 91,000 level during the day, maintaining its weak appearance. Testing the 89,000 level within the downtrend, the price continues its rebound from there.
Technical indicators reflect indecision, with the Wave Trend (WT) oscillator generating a buy signal en the oversold zone, while the Momentum (SM) indicator’s histogram failed to gain strength after reaching maximum weakness en the negative zone. The Kaufman Moving Average (KAMA) is currently at the $94,000 level, positioned above the price.
According to liquidation data, the recent decline has largely cleared short- and medium-term buy orders, while annual buy orders appear to be targeted. However, the weight of sell orders continues to be evident. Selling pressure intensified at the 93,000 level during the recent decline, while accumulation continues within the 97,000–98,000 range over a broader timeframe.
In summary, the weakening of expectations for Fed interest rate cuts, the decline en the value of technology stocks en global markets, and increasing geopolitical risks are significantly increasing selling pressure en the market. On the technical side, while the price continues to sustain its reaction from the 89,000 level, the weight of sell-side positions continues en liquidity data.Going forward, closes above the 90,000 level will be critical for the price to regain momentum, with the 93,700 resistance level being monitored for an upward movement. In the alternative scenario, if the downtrend continues unabated, the 89,000 support level will be monitored; if this level is broken, the price will continue to search for new lows.
Supports: 90,000 – 89,000 – 86,000
Resistances: 91,400 – 92,600 – 93,700
ETH/USDT
The ETH price remained above the $3,020 level during the day and rose to the $3,070 level. It is currently moving sideways en this region.
The recovery en liquidity appears to be continuing. The Chaikin Money Flow (CMF) indicator’s rebound and subsequent upward movement after falling to the zero line indicates that there has not been a significant liquidity outflow from the market. This movement por the CMF suggests that, despite the recent decline, institutional buying or demand en the spot market has not completely disappeared and that the buying side is beginning to regain strength.
The Relative Strength Index (RSI) indicator remains under pressure. The indicator has stabilized en low territory following a sharp pullback and shows that momentum has weakened significantly. This structure indicates that even if buyers react, there is still no strong desire to reverse the trend, which may cause upward movements to remain limited en the short term.
The Ichimoku indicator maintains the overall weak structure. The price losing the Tenkan level again weakens the short-term positive outlook, while remaining below the Kijun and kumo cloud indicates that the trend is still clearly under seller control. The price’s movement below the cloud reminds us that sufficient conditions have not yet formed for upward attempts to create a strong trend reversal.
The $3,020 support level stands out as the most critical level of the day en the overall outlook. If the price manages to hold above this support level, a new upward reaction wave could form thanks to the positive liquidity flow supported por CMF and CVD. In such a scenario, the $3,115 and $3,200 levels could come back into focus. However, a close below $3,020 could accelerate the decline and pave the way for testing the $2,950 and lower support levels.
Supports: 3,020 – 2,760 – 2,550
Resistances: 3,227 – 3,436 – 3,672

XRP/USDT
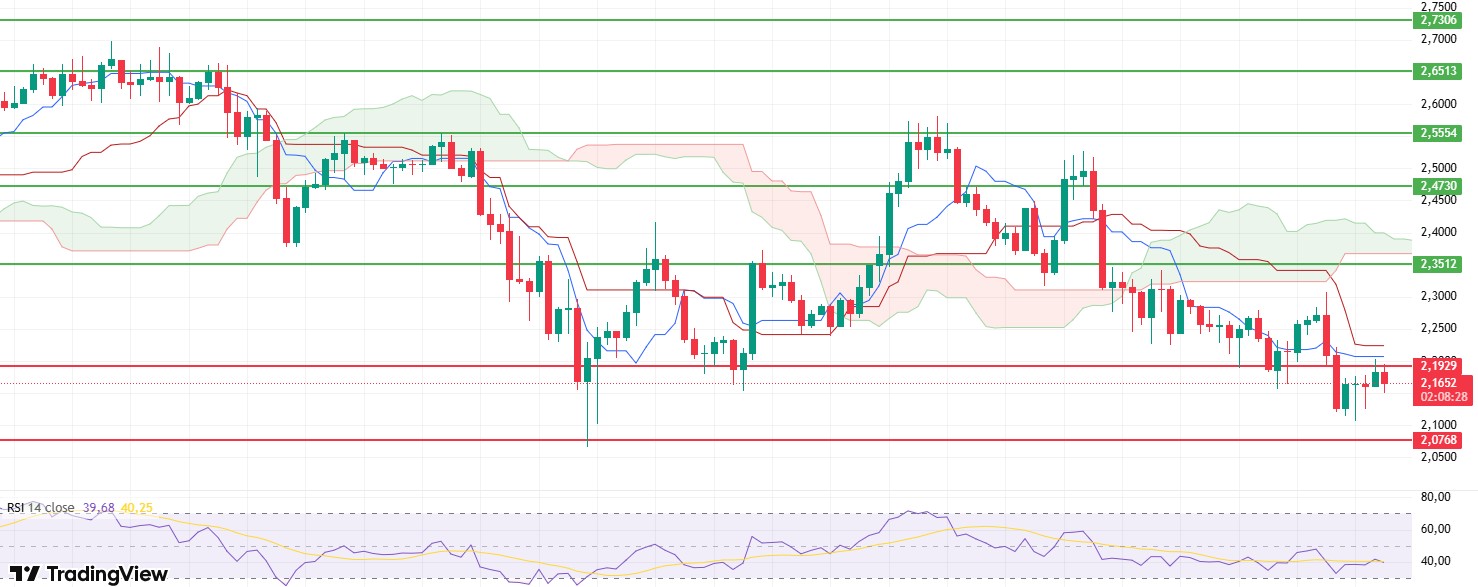
The XRP price reached the resistance level of $2.19 during the day but failed to break through this level, retreating slightly and currently trading at $2.16.
The Chaikin Money Flow (CMF) indicator continues its horizontal movement around the zero line, indicating that liquidity inflows and outflows have reached equilibrium and that the horizontal movement may continue for some time.
The Relative Strength Index (RSI) continues its weak trend. The lack of momentum suggests that upward attempts may be limited. The RSI’s failure to show signs of recovery supports the idea that upward movements will remain under pressure en the short term.
The Ichimoku indicator shows a weak outlook. The price is trading below the Kumo cloud. The trend structure has not yet turned positive, and the failure to remain above the Tenkan and Kijun levels indicates that technical pressure persists.
In the short term, the $2.19 level remains critical. If this area is regained, the possibility of an upward recovery en the XRP price could strengthen and short-term momentum could be supported. Remaining below $2.19, however, could cause the movement to be stuck en a horizontal band and maintain the weak outlook.
Supports: 2.0768 – 1.9092 – 1.7729
Resistances: 2.1929 – 2.3512 – 2.4730
SOL/USDT
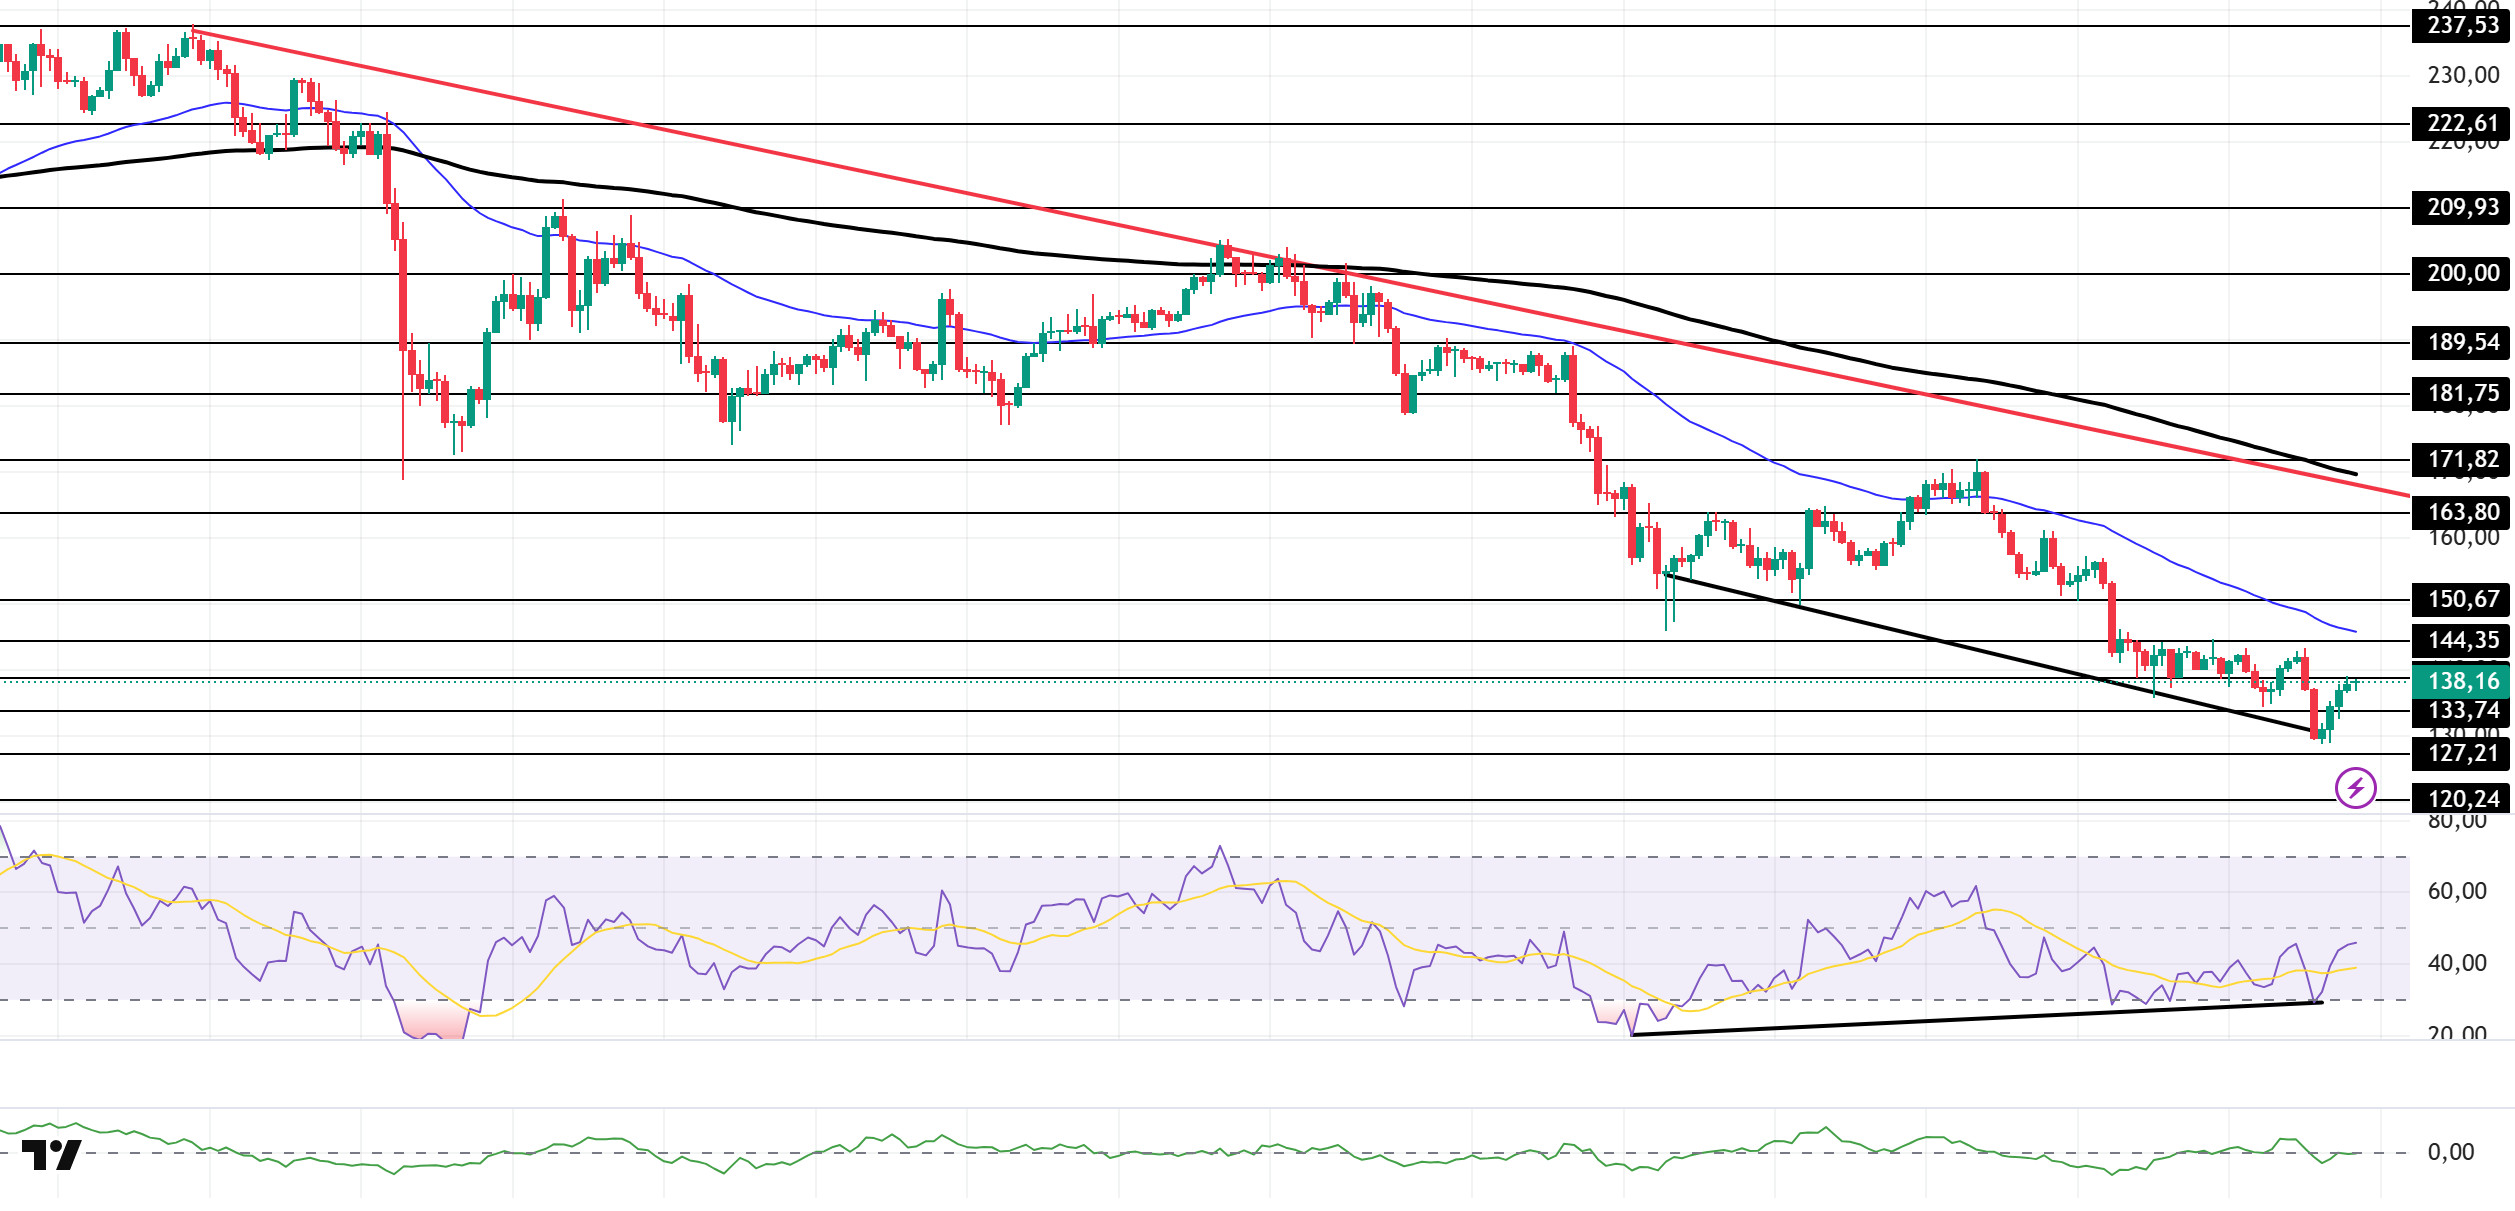
The SOL price continued to rise during the day. The asset remained en the lower region of the downward trend that began el October 6. Breaking below the strong support level of $133.74 with a strong candle, the price gained momentum and rose above the $133.74 level again. Currently testing the $138.73 level as resistance, the price could test the 50 EMA (Blue Line) moving average if the uptrend continues. If the pullback continues, the $127.21 level could act as support.
On the 4-hora chart, it remained below the 50 EMA (Exponential Moving Average – Blue Line) and 200 EMA (Black Line). This indicates a possible downtrend en the medium term. At the same time, the price being below both moving averages shows us that the asset is en a downward trend en the short term. The Chaikin Money Flow (CMF-20) is at a neutral level. However, the balance of money inflows may continue to keep the CMF at a neutral level. The Relative Strength Index (RSI-14) remained at the mid-level of the negative zone. It is also above the rising line that began el November 4. This indicates increased buying pressure. There is also a bullish divergence. If there is an uptrend due to macroeconomic data or positive news related to the Solana ecosystem, the $150.67 level stands out as a strong resistance point. If this level is broken upwards, the uptrend is expected to continue. If pullbacks occur due to developments en the opposite direction or profit-taking, the $120.24 level could be tested. A decline to these support levels could increase buying momentum, presenting a potential upside opportunity.
Supports: 133.74 – 127.21 – 120.24
Resistances: 138.73 – 144.35 – 150.67
DOGE/USDT
The DOGE price remained flat during the day. The asset continued to trade en the lower region of the downtrend that began el November 11. Testing the downtrend and the 50 EMA (Blue Line) moving average as resistance, the price experienced a pullback from this level and retreated to the $0.14952 level. Currently gaining momentum, the asset is testing the $0.15680 level as resistance. If the uptrend continues, it may test the downward trend line as resistance. In case of a pullback, it may test the $0.14237 level.
On the 4-hora chart, the 50 EMA (Exponential Moving Average – Blue Line) remained below the 200 EMA (Black Line). This indicates that a downtrend may begin en the medium term. The price being between the two moving averages indicates that the price is en a decision phase en the short term. The Chaikin Money Flow (CMF-20) is at a neutral level. Additionally, balanced cash inflows may keep the CMF at a neutral level. The Relative Strength Index (RSI-14) has risen to the middle of the negative zone. It is also testing the resistance level of the downward trend that began el November 10. A break above this level could trigger buying pressure. In the event of an uptrend driven por political developments, macroeconomic data, or positive news flow en the DOGE ecosystem, the $0.17766 level stands out as a strong resistance zone. Conversely, en the event of negative news flow, the $0.14237 level could be triggered. A decline to these levels could increase momentum and initiate a new wave of growth.
Supports: 0.14952 – 0.14237 – 0.13367
Resistances: 0.15680 – 0.16686 – 0.17766

SHIB/USDT
According to current data en the Shiba Inu (SHIB) ecosystem, the burn mechanism, which forms the basis of the ecosystem’s supply reduction strategy, has shown extraordinary activity. Over the last 24 horas, the SHIB burn rate has increased por a full 1090% compared to the previous period, permanently removing 17,290,166 SHIB tokens from circulation. Meanwhile, Shiba Inu’s L2 solution, Shibarium, has approached record levels en terms of network usage. The daily transaction count increased significantly por 78% en the last 24 horas, reaching 4,330. This increase followed technical milestones such as surpassing the 14 million block threshold and the recently successful Remote Procedure Call (RPC) upgrade, demonstrating Shibarium’s growing adoption and operational resilience.
The technical picture shows that the weakening highlighted en our previous analysis has been met with strong reactions from critical support levels. The price rebounding from a region close to the $0.000008635 level and settling above $0.000008735 confirms that bottoming efforts have begun en the short term. However, the price still trading below important periods such as SMMA 9, SMMA 21, SMMA 50, and SMMA 200 indicates that the main trend continues to be suppressed. Despite this trend, the Chaikin Money Flow (CMF) indicator, which shows cash flow, settling into positive territory signals that new capital inflows are beginning to strengthen despite the downward trend. At the same time, the noticeable recovery en momentum indicators, along with the observed decrease en volatility, suggests that the intense selling wave is losing steam and that the market may transition to a more balanced consolidation or upward reaction phase en the short term.
In the short term, the $0.000008635, $0.000008510, and $0.000008415 bands are being monitored as the closest and critical support areas, while en potential rebound attempts, the levels of $0.000009160, $0.000009320, and $0.000009515 will be the first important resistance zones. If these resistances are decisively retaken with increasing volume, it could confirm a recovery en momentum and bring a more meaningful upward scenario towards the upper bands of the descending channel structure. However, as long as the price remains below all key moving averages and the descending channel structure, the movement should be considered a weak downtrend phase with a potential rebound within the main downtrend, despite the positive CMF. (SMMA9: Green Line, SMMA21: Yellow Line, SMMA50: Orange Line, SMMA 200: Red Line)
Supports 0.000008635 – 0.000008510 – 0.000008415
Resistances 0.000009160 – 0.000009320 – 0.000009515
 Legal Notice
The investment information, comments, and recommendations contained herein do not constitute investment advice. Investment advisory services are provided individually por authorized institutions taking into account the risk and return preferences of individuals. The comments and recommendations contained herein are of a general nature. These recommendations may not be suitable for your financial situation and risk and return preferences. Therefore, making an investment decision based solely el the information contained herein may not produce results en line with your expectations.


