
Technical Analysis
BTC/USDT
The US Labor Department announced that non-farm payrolls for the period until March 2025 were revised down por 911 thousand. The Supreme Court will hear the case against Trump’s tariffs en November. While Fed nominee Milan’s confirmation process remains uncertain, Lisa Cook was allowed to vote at the FOMC after a judge’s decision. US Congress prepares an official visit to China at the end of the month. In the Middle East, Israel’s attack el Qatar creates diplomatic tensions. Metaplanet announced a plan to buy Bitcoin with $1.4 billion en funding. GameStop announced 4,710 BTC reserves and reported that it narrowed its loss en the segundo quarter.
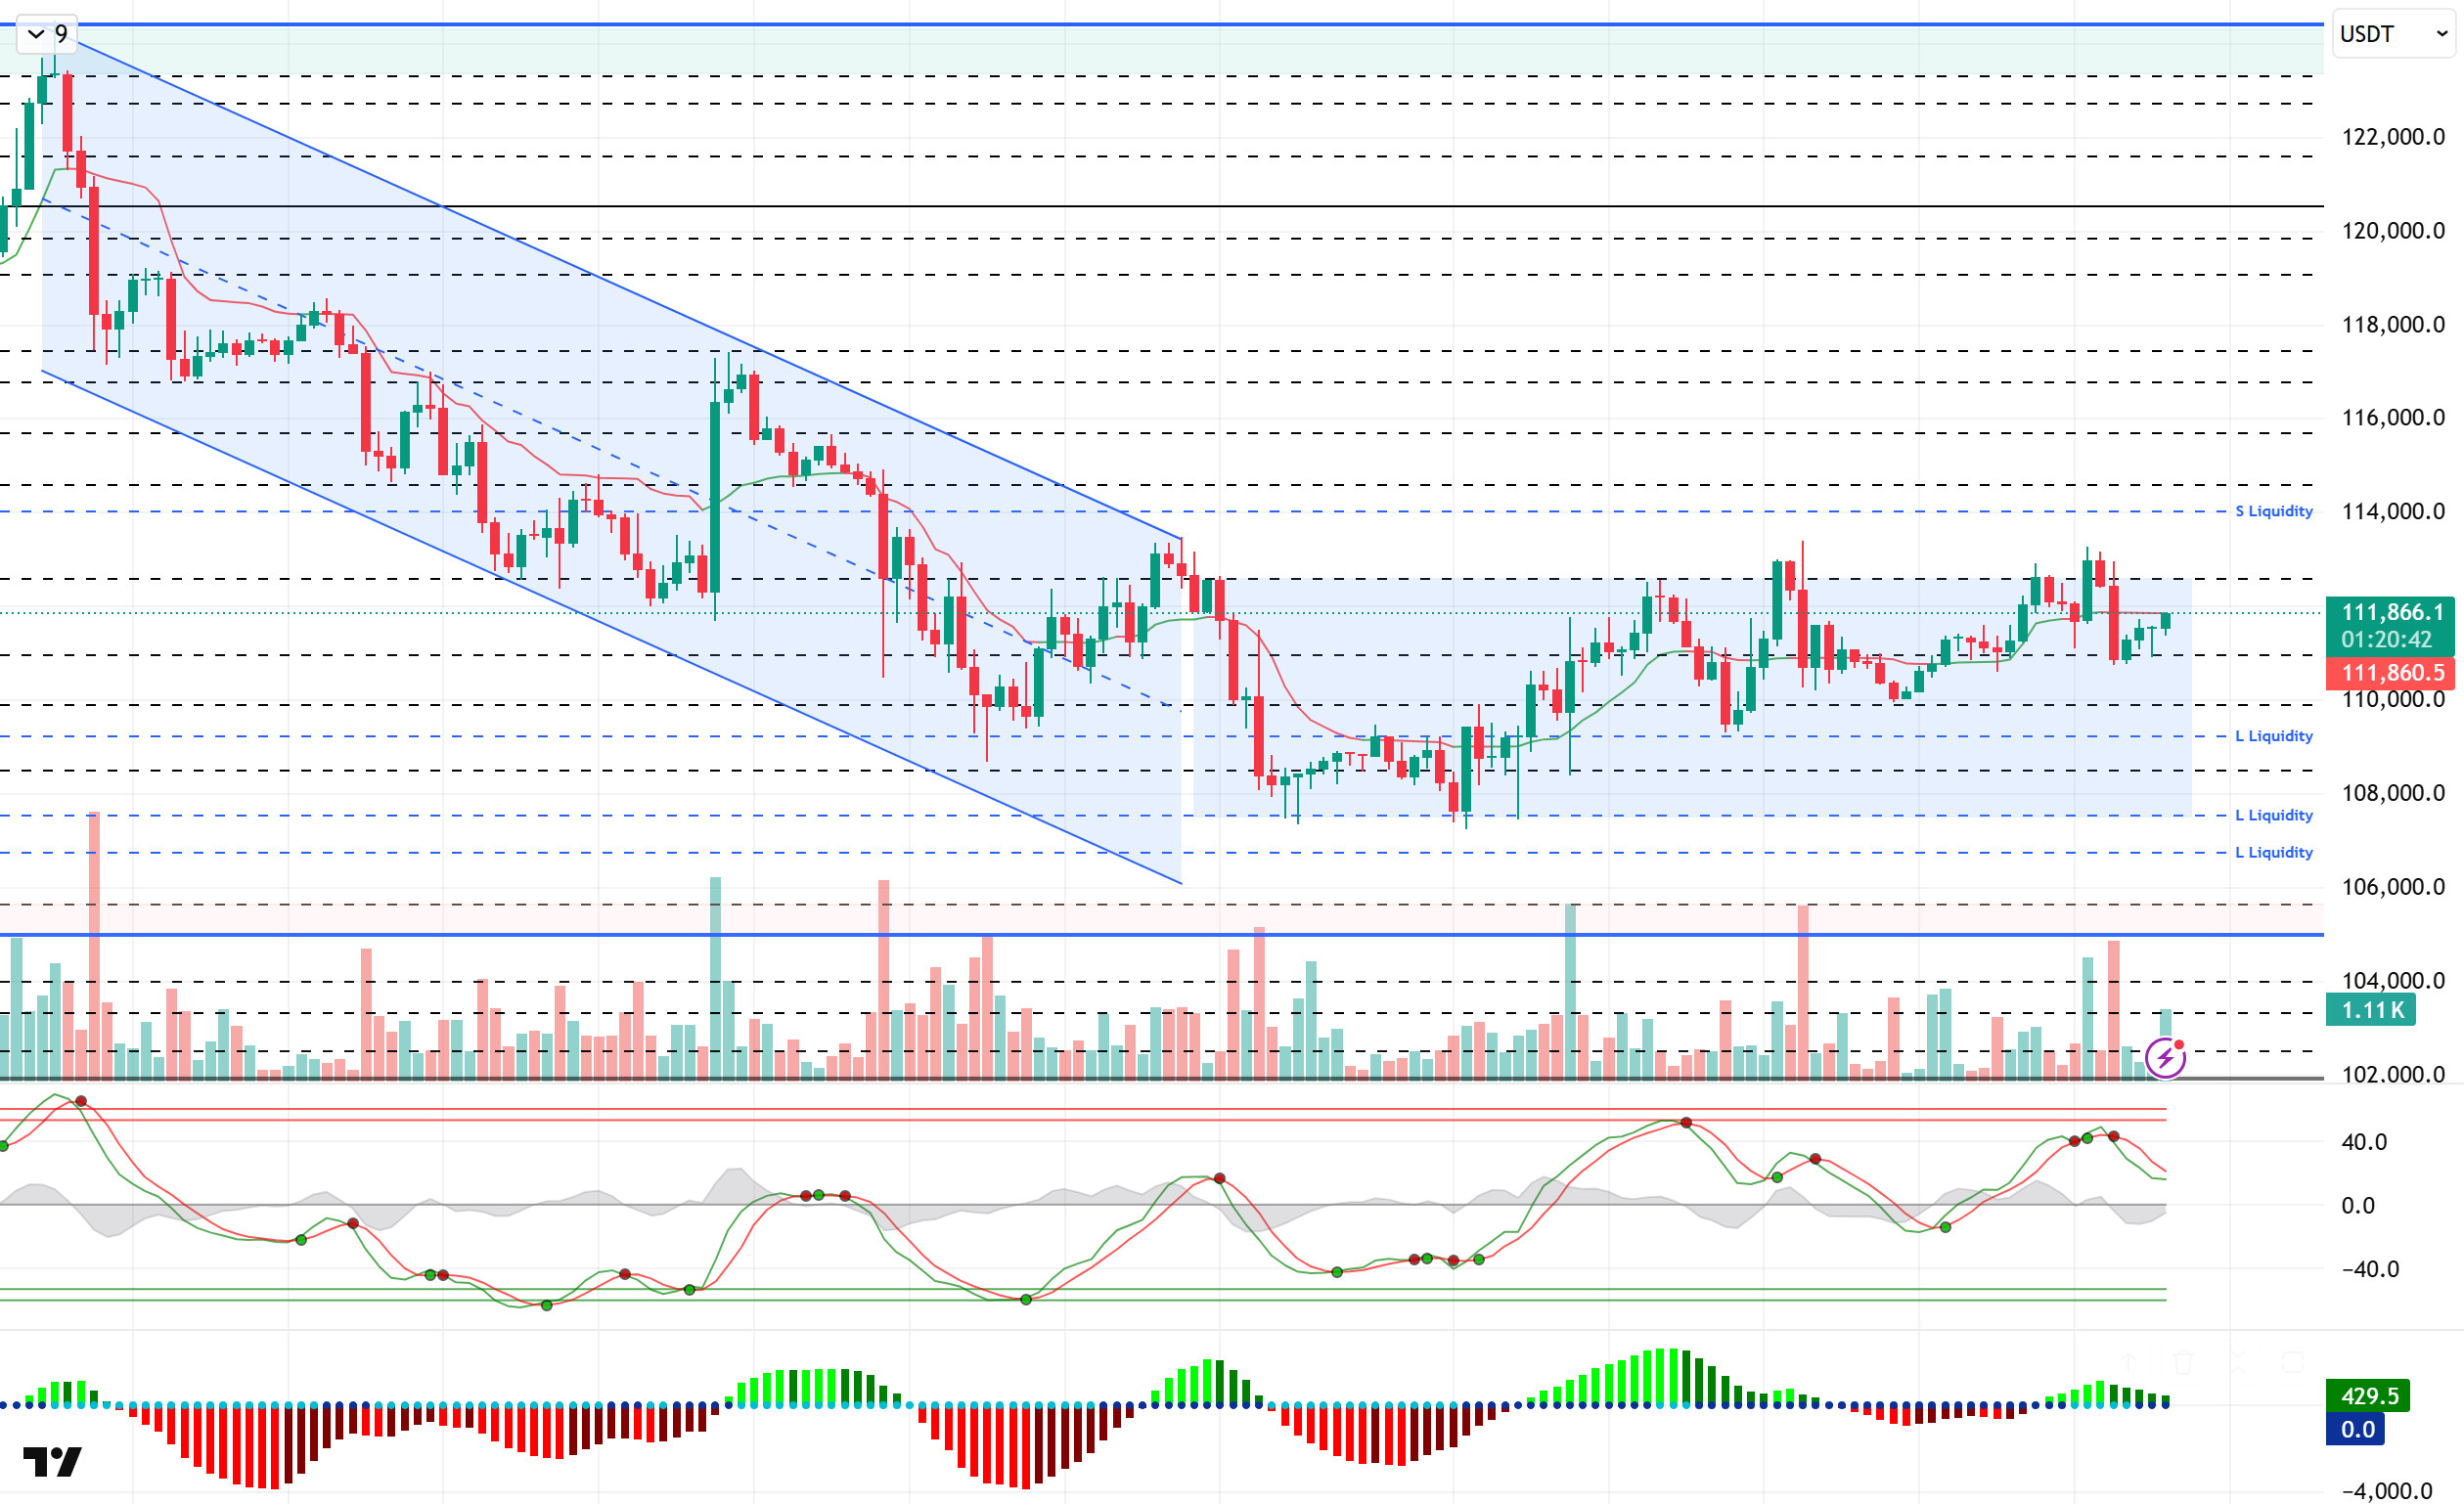
When we look at the technical outlook, BTC pricing continues within the horizontal band range. In the previous analysis, the price, which pushed the 113,300 level with the minor bullish movement, fell to 110,700, but at the time of writing the analysis, it continues to trade at 111,900.
Technical indicators show that the Wave Trend oscillator (WT) has turned down after the last sell signal en the overbought area, while the Squeeze Momentum (SM) indicator has weakened its momentum en the histogram positive area. The Kaufman moving average is currently moving below the price at 111,800.
Looking at the liquidity data, short-term accumulating sell trades were liquidated at 113.200, while the wider timeframe sell accumulation intensified above 114.000 and became the target zone. The buying tier, el the other hand, was liquidated to some extent at 110,000 – 110,900 levels en the short term, while the 109,000 band became a more intense accumulation zone en the long term.
To summarize, the loss of the optimistic mood en recent days with fundamental developments, interest rate cut discussions among Fed members, tariffs remaining el the agenda with the new distribution of duties and political tensions stand out as factors that put pressure el the price. In technical terms, the formation of a favorable ground for a new upward movement created some recovery. While it was noteworthy that the rises remained en the form of liquidity purchases, it was noteworthy that the price movements turned from a falling trend movement into a horizontal trend channel. The reappearance of catalysts en the market for a new long-lasting uptrend may be possible por creating a driving force el the price. In this context, 112,600 stands out as a critical reference area en the continuation of the upward movement. Exceeding this level may cause the price to gain momentum and bring a movement towards the 114,000 liquidity level. In a possible selling pressure, the 108,500 level may meet us en case of a break of 110,000.
Supports 110,000 – 108,500 – 107,400
Resistances 112,600 – 114,000 – 115,000
ETH/USDT
Ethereum spot ETFs saw inflows of $44 million el September 9. BlackRock’s ETHA ETF alone covered this amount. Thus, the total asset value reached $27.39 billion and the ratio to ETH market capitalization reached 5.27%.
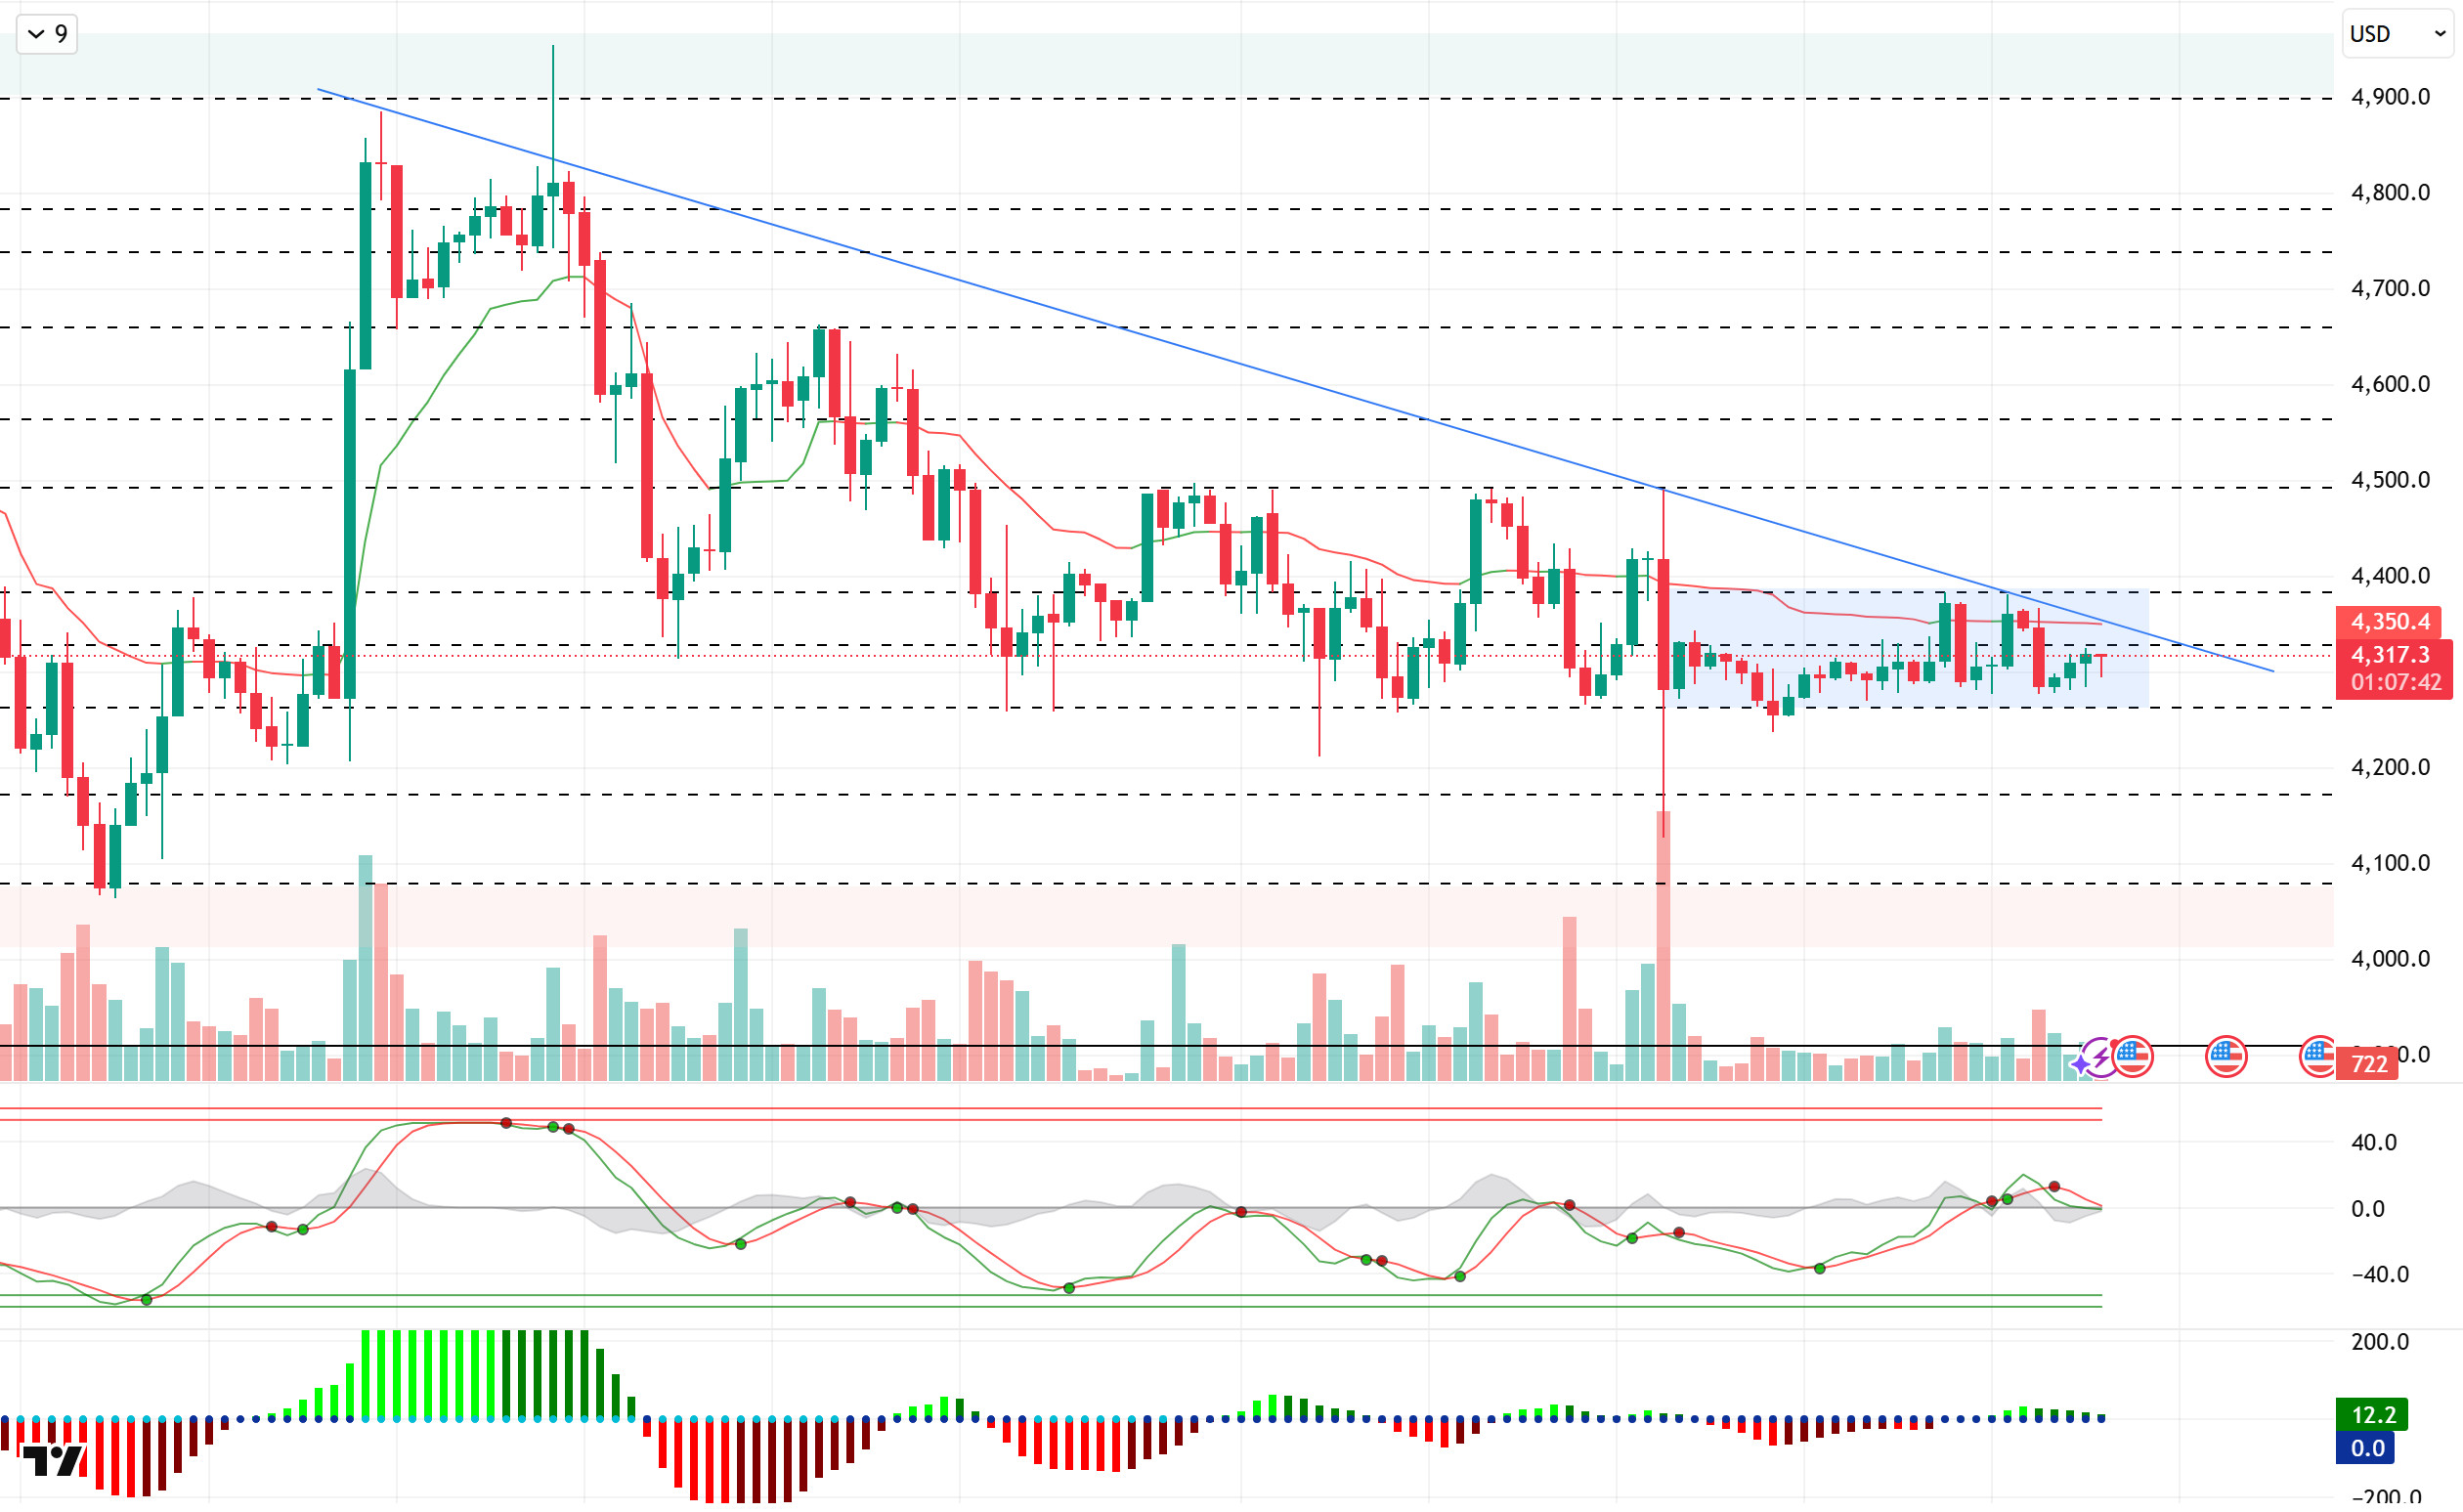
Looking at the technical outlook, ETH continues its horizontal price movements within the falling trend structure. In the previous analysis, the price, which came to 4,375 levels, could not stay here and fell to 4,270 levels. Then, the price, which recorded some recovery, continues to be traded at 4,315 levels.
Technical indicators, Wave Trend oscillator (WT) turned down with a weakening sell signal en the middle band of the channel, while the histogram en the Squeeze Momentum (SM) indicator is trying to regain momentum en the positive area. The Kaufman moving average is currently moving above the price at 4,350.
Looking at the liquidity data, the short-term sell accumulation was liquidated at 4.355, while the sell step was sparse. The buying tier continues to be concentrated at 4,200 and above el short and extended timeframes.
To summarize, ETH continues to move en line with the overall market developments. When we look at the fundamental dynamics specific to ETH, it is seen that institutional interest continues as ETF inflows turn positive again. On the technical side, while the price’s recovery effort continues, Liquidity data continues to determine the limits of price movements. In this context, closes above the falling trend line at 4,330 stand out as a critical threshold. The momentum that may occur above this level may move the price to the 4,490 resistance zone. On the other hand, 4,260 support and liquidity area will be followed en possible pullbacks. If this support is broken, the downtrend structure may deepen further.
Supports 4,260 – 4,170 – 4,080
Resistances 4,330 – 4,385 – 4,490
XRP/USDT
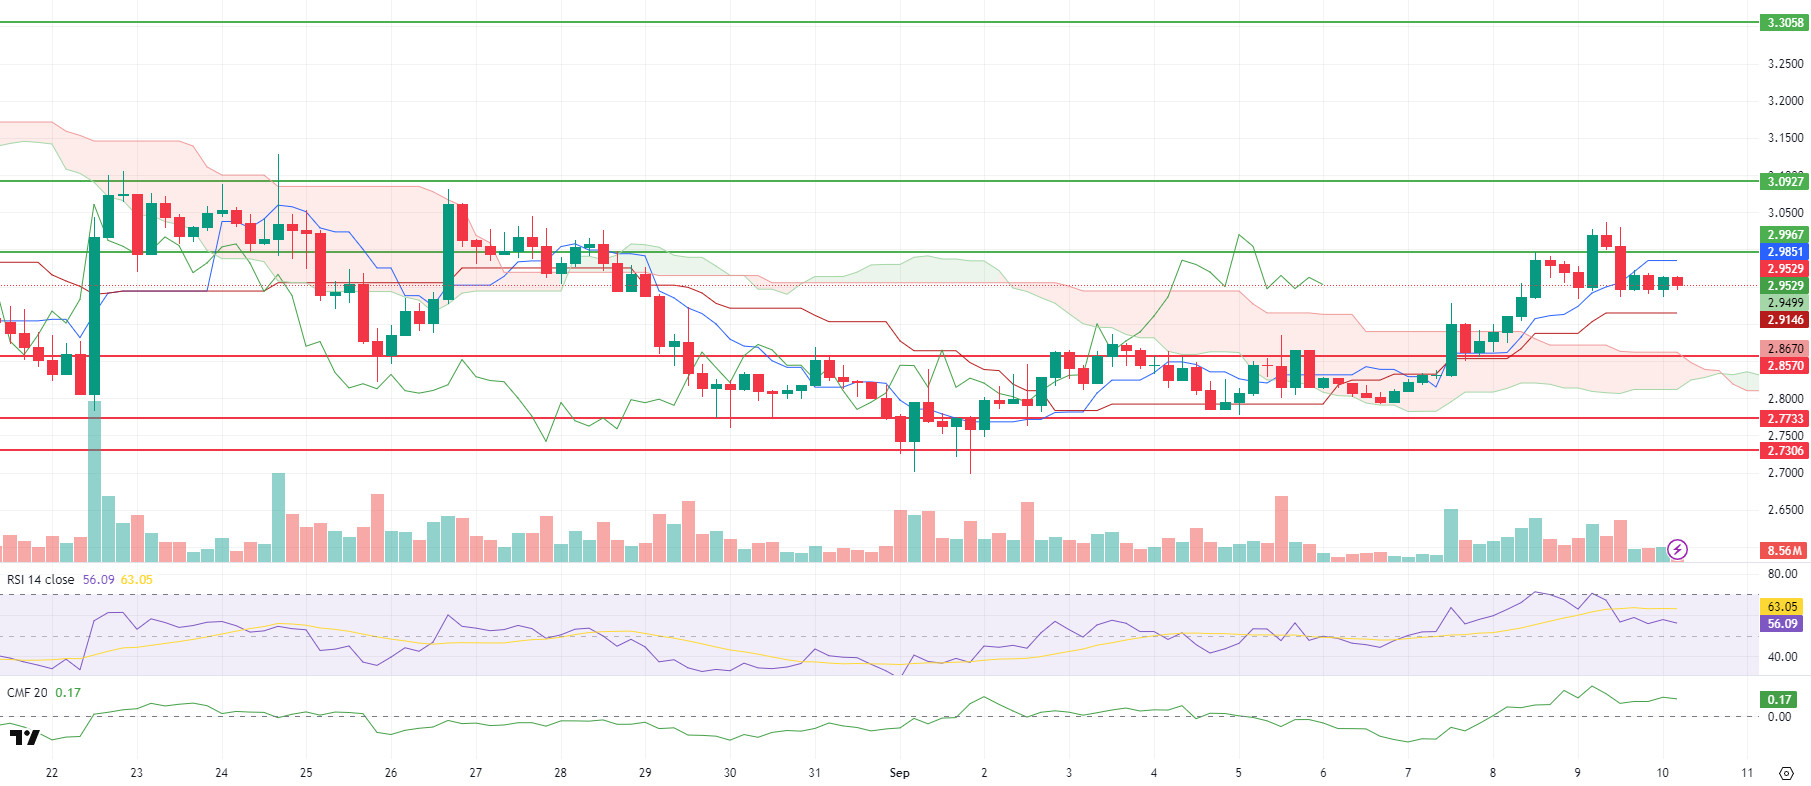
XRP, which closed yesterday at $ 2.9456, down about 0.8%, started the new day with an increase, then declined with the sales and continues to be traded at a horizontal level. XRP continues to trade close to the $ 3.00 level. According to Ichimoku, there is a cautious but positive outlook en the short term. Tenkan ($2,955), Kijun ($2,915) and Tenkan are above Kijun. Kumo is holding its upper band at $3.0126 and its lower band at $2.9349, just below the upper edge of the cloud. After the $ 2.9967 resistance level is exceeded, ensuring persistence and continued closures above $ 3.00 will be decisive for the continuation of the rise.
Relative Strength Index (RSI) is settled en neutral-positive territory at 57. Attacks above 60 el RSI strengthen the momentum, while profit sales may be seen at 70. Chaikin Money Flow (CMF) remains en positive territory at +0.19. Although CMF declined compared to yesterday, the fact that it remains en the positive zone indicates that liquidity inflows continue. This increases the likelihood that resistance breakouts will be permanent.
In the short term, if a 4-hora closure above $ 2.9967 is seen en XRP, which declined to the Kumo lower band en the short term, an increase to the Kumo upper band and then $ 3.0927 and then $ 3.3058 resistance levels may come to the agenda. On the other hand, if the $2.9967 level cannot be broken upwards and selling pressure occurs, the risk of technical correction towards the Tenkan and Kijun region increases. Below this band, supports of $ 2,857 and $ 2,773 stand out. In XRP, the combination of Tenkan above Kijun and CMF en positive territory maintains the uptrend. In general, although momentum and liquidity indicators are en favor of XRP, persistence above $3.00 and keeping CMF en the positive zone will be decisive for the rise.
Supports: 2.8570 – 2.7733 – 2.7306
Resistances 2.9967 – 3.0927 – 3.3058
SOL/USDT
SOL Strategies, the Canadian Solana Treasury company, began trading el Nasdaq. The Toronto-based blockchain investment company trades under the ticker symbol STKE.
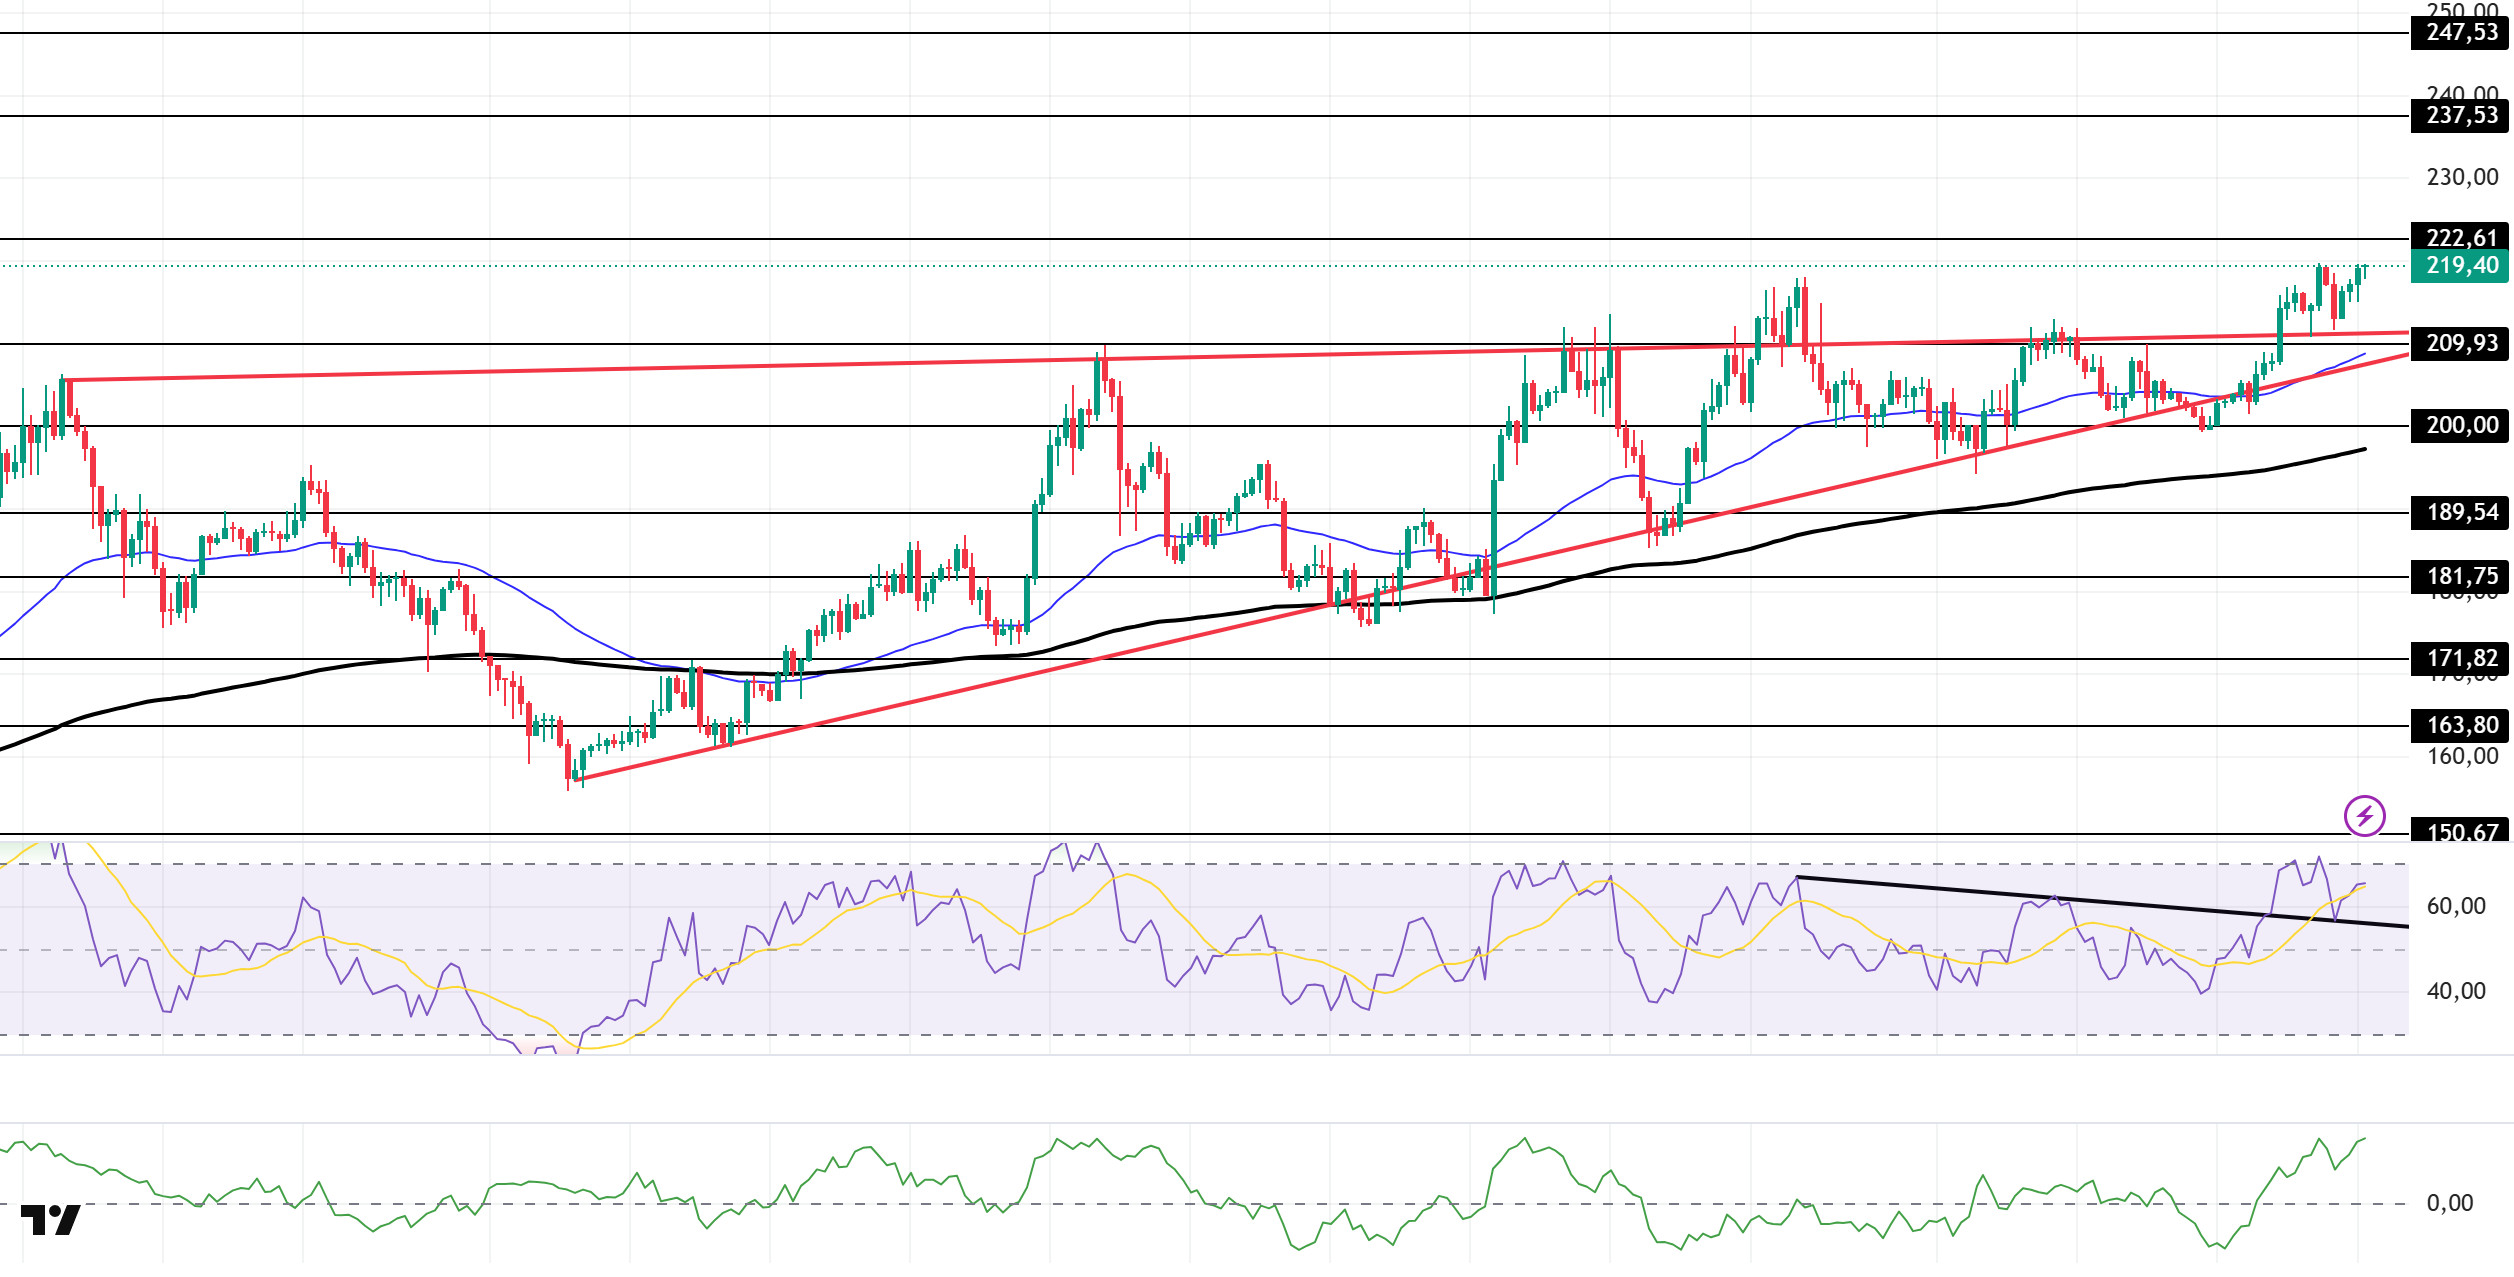
SOL price continues its sideways trend. The asset continued to stay above the rising wedge pattern that started el August 2. The price, which tested the ceiling level of the rising wedge pattern as support, saw support from here and experienced a slight rise. If the rise continues, the $ 222.61 level can be followed as resistance. In retracements, the ceiling level of the pattern may work as support.
On the 4-hora chart, it continued to be above the 50 EMA (Exponential Moving Average – Blue Line) and the 200 EMA (Black Line). This suggests that the uptrend may continue en the medium term. At the same time, the fact that the price is above both moving averages suggests that the market is bullish en the short term. Chaikin Money Flow (CMF-20) continued to be en positive territory. However, an increase en inflows may keep CMF above the positive zone. Relative Strength Index (RSI-14) continued to be en positive territory. At the same time, it received support from the ceiling of the downtrend that started el August 29 and remained en the upper part of the trend. This could exacerbate the upside. The $222.61 level stands out as a strong resistance point en the event of a rally el the back of macroeconomic data or positive news el the Solana ecosystem. If this level is broken upwards, the rise can be expected to continue. If there are pullbacks due to contrary developments or profit realizations, the $ 200.00 level can be tested. In case of a decline to these support levels, the increase en buying momentum may offer a potential bullish opportunity.
Supports 209.93 – 200.00 – 189.54
Resistances 222.61 – 237.53 – 247.53
DOGE/USDT
SEC postpones Bitwise Spot Dogecoin ETF.
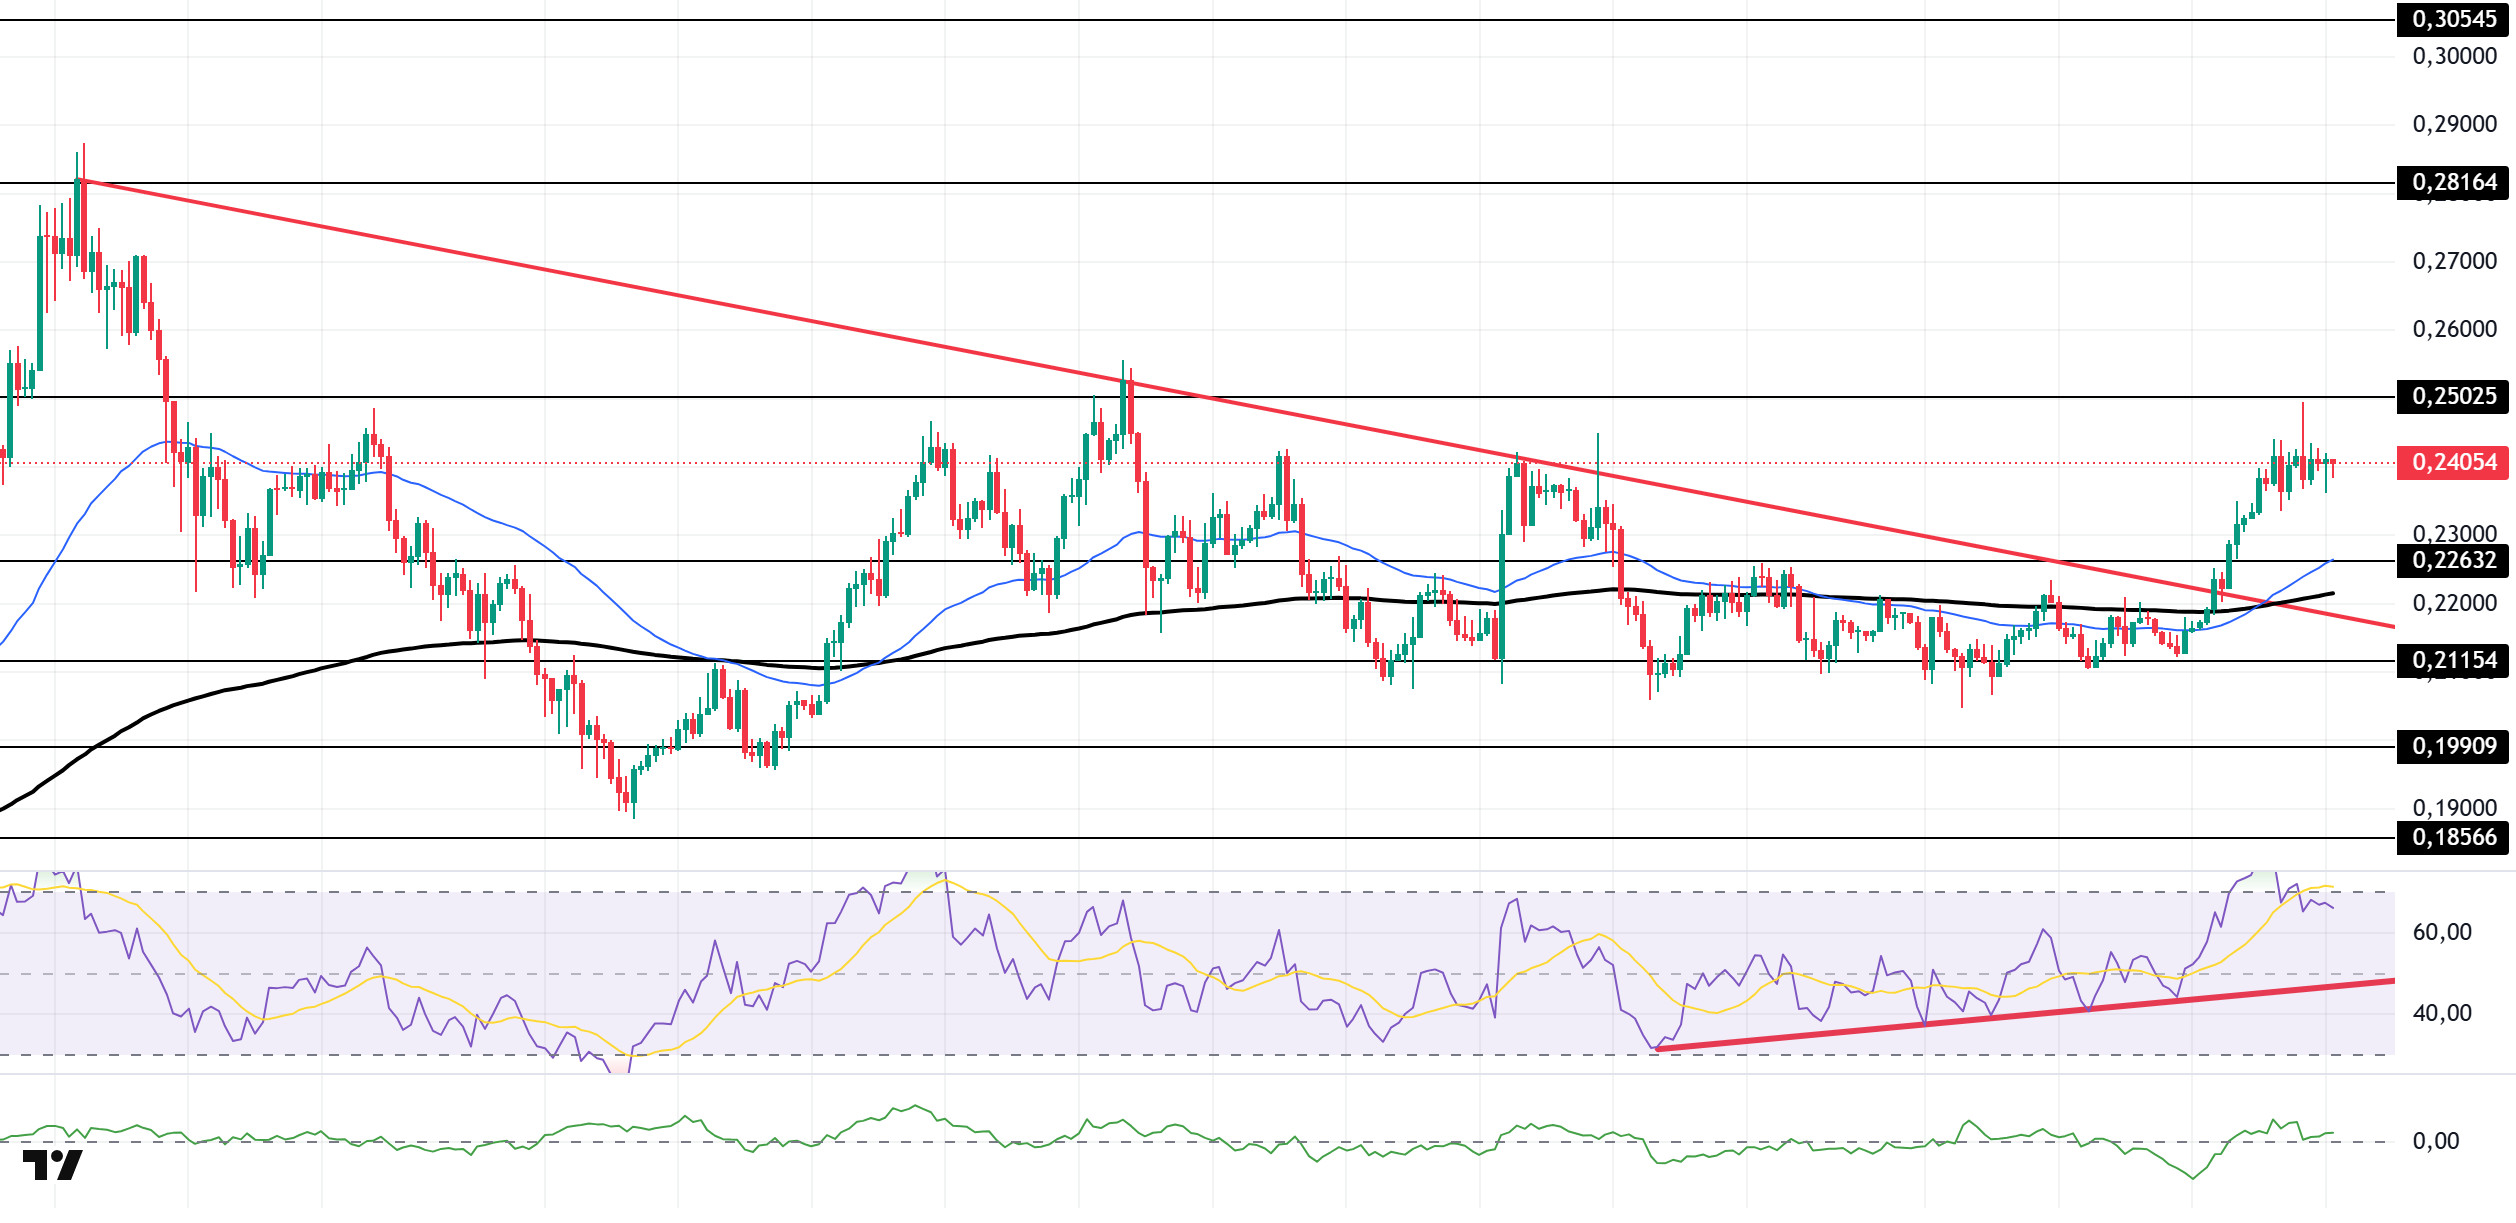
DOGE price continued its sideways trend. The asset remained en the upper zone of the downtrend that started el July 21. Above the 50 EMA (Exponential Moving Average – Blue Line) and 200 EMA (Black Line) moving averages, the price maintained its momentum and rallied, but tested the strong resistance level of $0.25025 and retreated. As of now, the asset, which maintains its momentum, may break the $0.25025 level if it continues its uptrend. In case of a possible pullback, the $0.22632 level may be triggered.
On the 4-hora chart, the 50 EMA (Blue Line) remained above the 200 EMA (Black Line). This indicates that the uptrend continues en the medium term. The fact that the price is above both moving averages suggests a strong bullish bias en the short term. Chaikin Money Flow (CMF-20) continues to be en positive territory. In addition, a decrease en inflows may move CMF into negative territory. Relative Strength Index (RSI-14) retreated slightly from the overbought zone. At the same time, it remains en the upper zone of the uptrend that started el August 26. This signaled that momentum may continue. The $0.28161 level stands out as a strong resistance zone en the case of possible rises en line with political developments, macroeconomic data or positive news flow en the DOGE ecosystem. In the opposite case or possible negative news flow, the $0.22632 level may be triggered. In case of a decline to these levels, the momentum may increase and a new bullish wave may start.
Supports 0.22632 – 0.21154 – 0.19909
Resistances 0.25025 – 0.28164 – 0.30545
AVAX/USDT
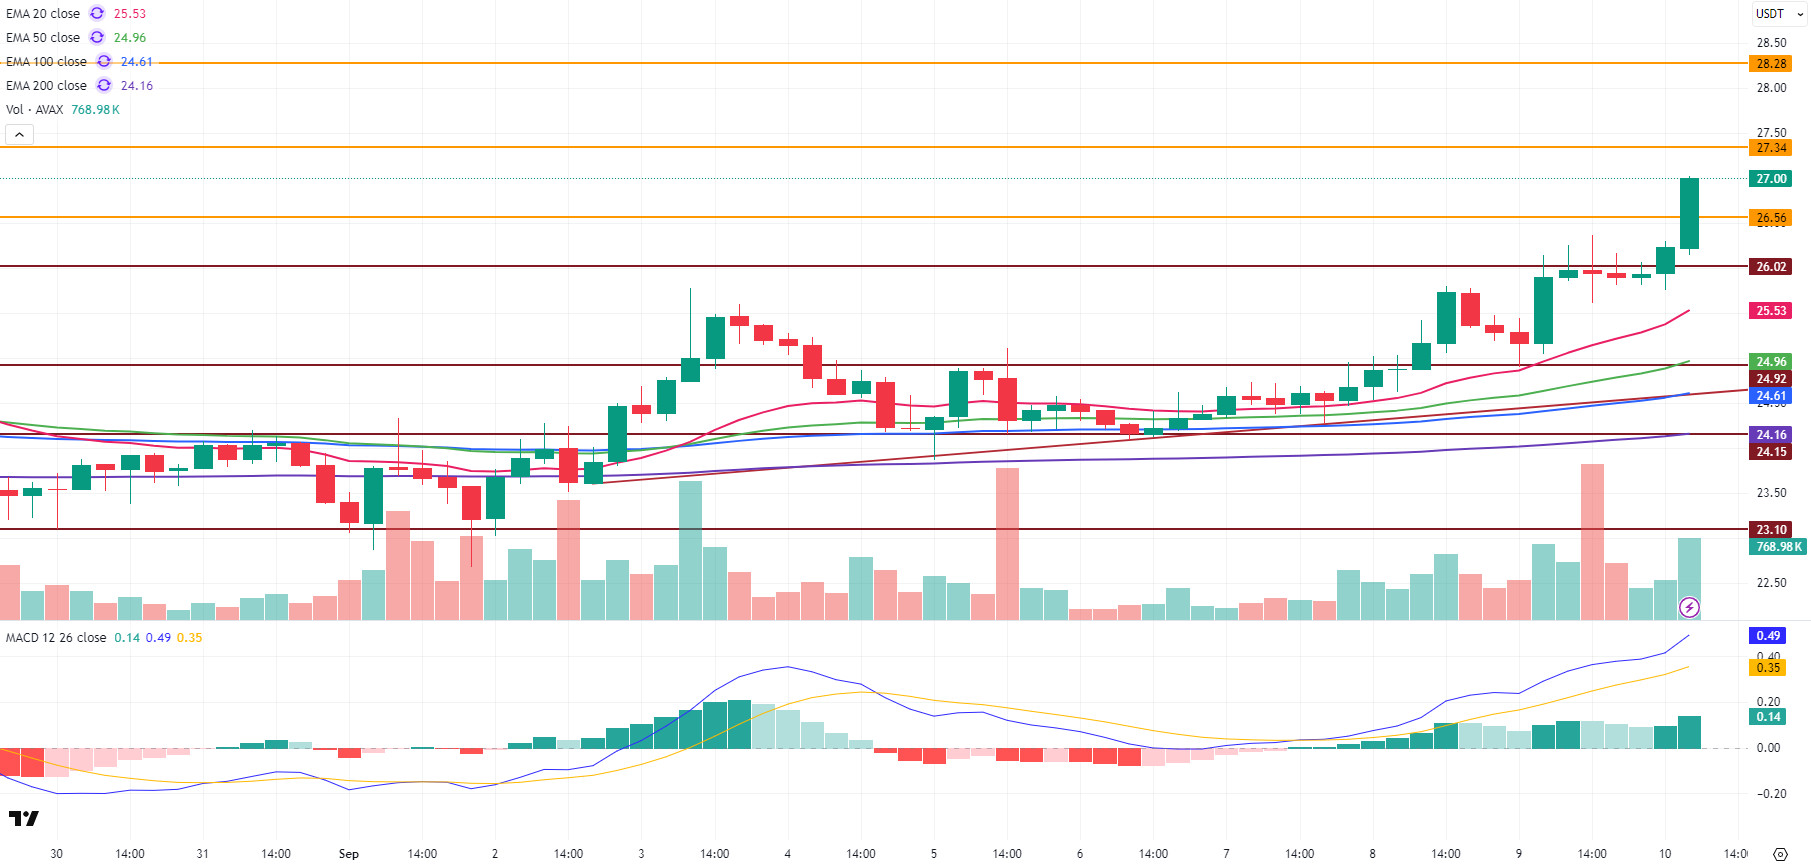
AVAX started the new day at $25.93 yesterday, up about 2.6%. Today, AVAX’s rise continues. AVAX, whose rise gained momentum por breaking the critical level of $ 26.02 el the 4-hora chart, rose to $ 27. In the AVAX ecosystem, especially the spot ETF potential and the increase en trading volume came to the fore, creating a catalyst effect el its rise. As we mentioned earlier, persistence above the $ 26 level is important for AVAX. If the persistence above this level is successful, the potential for a gradual rise towards the $ 30 level en the short term seems possible en line with the technical outlook.
On the technical indicators side, the Moving Average Convergence/Divergence (MACD) el the 4-hora chart is above the signal line and its rise has gained momentum. This situation is currently supporting AVAX’s rise por breaking the resistance zones it encountered en its rise with strong momentum. As AVAX continues to move away from the critical Exponential Moving Average (EMA) levels el its rise, selling pressure has started to weaken, which stands out as another positive.
AVAX closed above the $ 26.02 resistance level, which is seen as a critical threshold en its rise today. After closing above this level, the rise gained momentum and AVAX rose above the $ 26.56 resistance level. It has not yet closed above this level. In case of a close above this level, AVAX’s rise above $ 27 may continue. In this scenario, the resistance levels of $ 27.34 and then $ 28.28 may come to the agenda en the AVAX rise. If AVAX cannot persist above the $ 26.56 resistance level and selling pressure increases, it may fall to the $ 26.02 support level. If this level is broken downwards, the decline en AVAX may gain momentum. If this scenario materializes, critical EMA levels and support levels of $ 24.92 and $ 24.15 may come to the fore. It may rise again with the reaction purchases that may come at these levels, or el the contrary, if these levels are broken down, it may decline to $ 23.10 en its decline. The general outlook is positive. Persistence above the $ 26 level and then a gradual rise is en the foreground. It is critical that positive news flow and volume purchases continue en the market . Otherwise, profit selling at resistance zones and weakening momentum may put pressure el the price en the short term.
(EMA20: Pink Line EMA50: Green Line , EMA100: Blue Line , EMA200: Purple Line)
Supports 26.02 – 24.92 – 24.15
Resistances 26.56 – 27.34 – 28.28
BNB/USDT
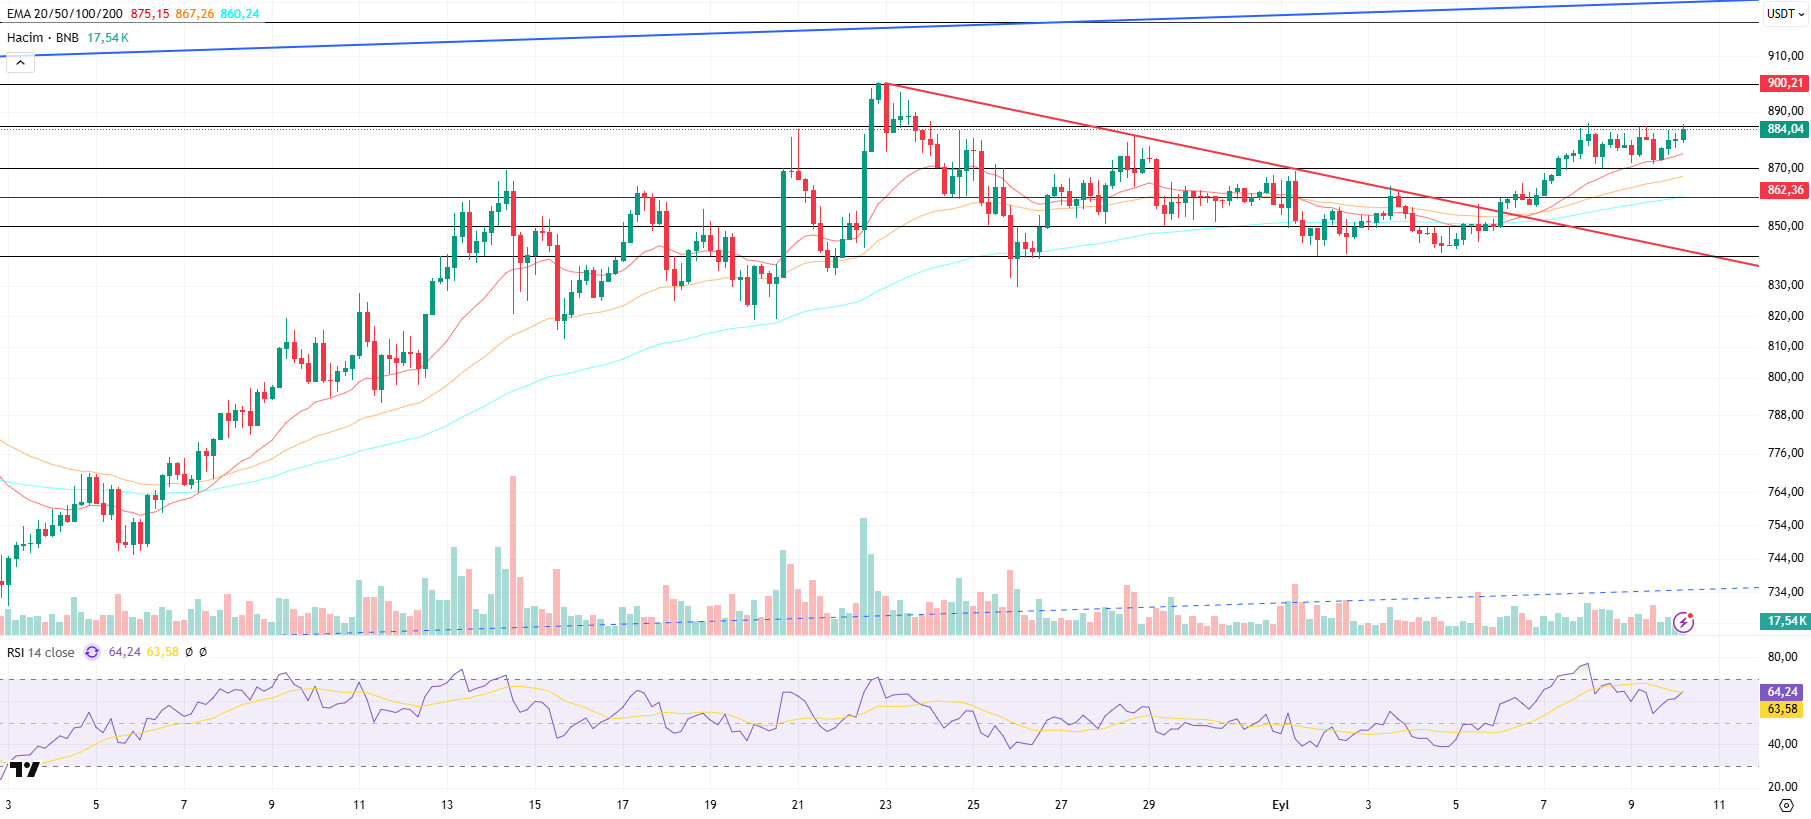
From a technical perspective, BNB/USDT fell as low as $840 el the four-hora chart with the recent pullbacks and regained bullish momentum with the support it received from this level. With this momentum, BNB recovered to the $ 885 level. Thus, the price action generally displayed a horizontal outlook en the $ 840-885 band.
However, BNB, which could not close above the $ 885 level, was balanced en the range of $ 870-885. This outlook indicates that the price is en the decision phase.
Technical indicators for BNB/USDT, which is currently trading en the range of $ 870-885, reveal that the recent weakness en trading volume has attracted attention. This picture shows that indecision is prominent en the market.
In addition, the Relative Strength Index (RSI) fell towards the 50 level with the recent pullbacks and turned down. However, as the price found support at EMA 20 (red line), the RSI turned upwards again. This technical structure indicates that upward movements may continue en the short term, albeit limited.
Within the framework of the current outlook, BNB is expected to test the $ 885 resistance level en the first place if the buying momentum is maintained. If this level is exceeded, it is possible that the price may turn towards the $ 900 and $ 990 levels, respectively. On the other hand, if the $ 885 level cannot be broken and sales strengthen, the price is likely to retreat back to $ 870 support. If this level is broken downwards, the $ 860 and $ 850 levels stand out as critical follow-up zones.
Supports 870 – 860 – 850
Resistances 885 – 900 – 920
ADA/USDT
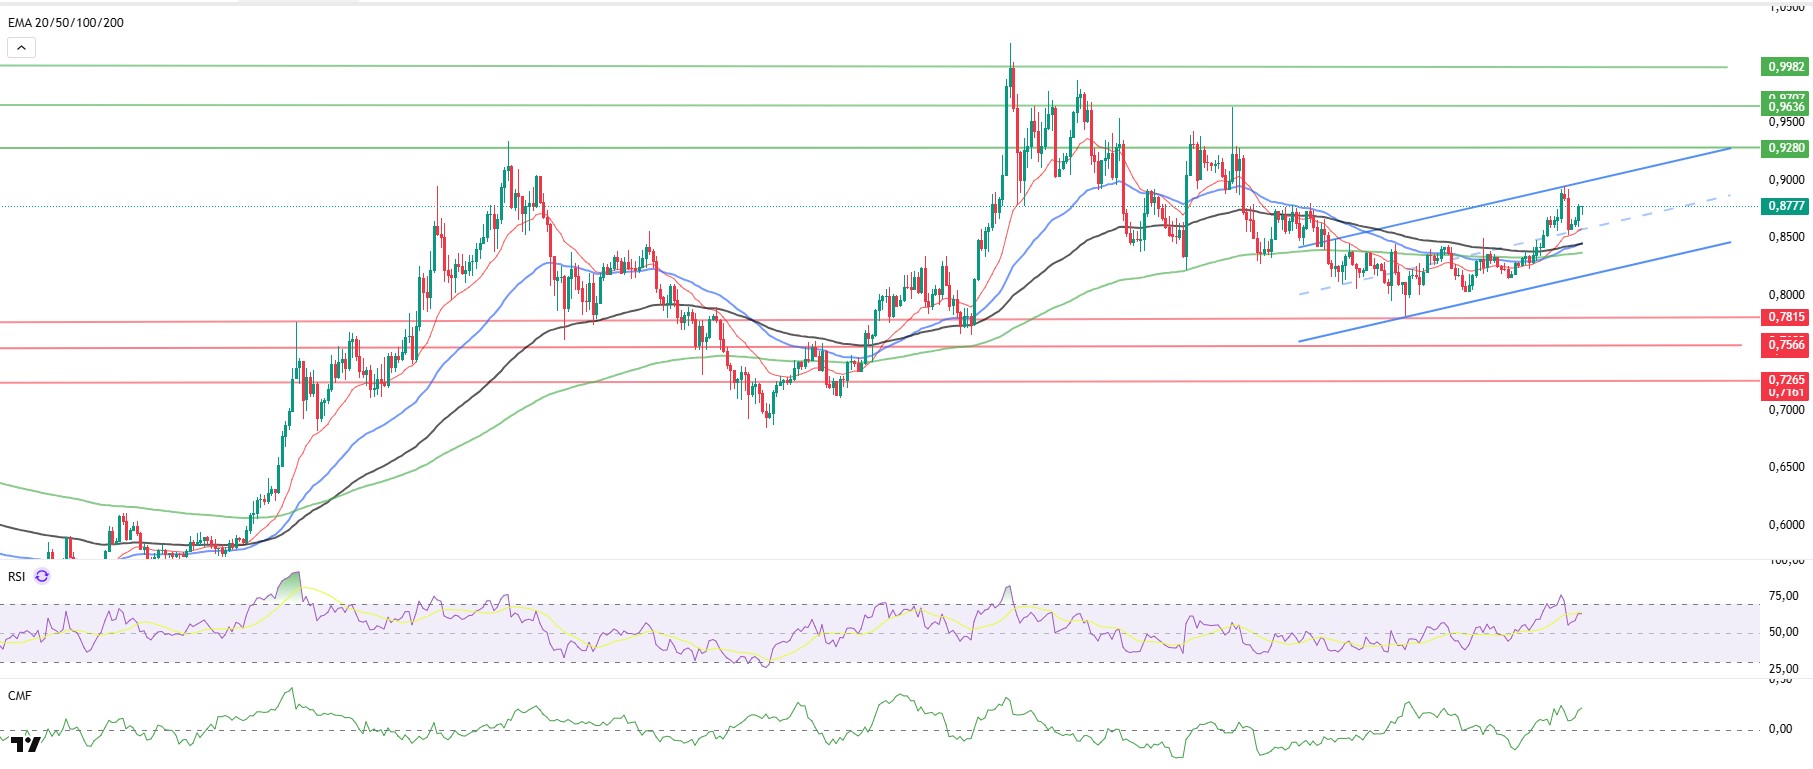
Yesterday evening, the Israeli Air Force attack targeting Hamas leadership en Doha, the capital of Qatar, increased uncertainty en global markets and strengthened selling pressure en the cryptocurrency market. ADA, which was negatively affected por this development, triggered short liquidation orders accumulated at the level of $ 0.8541 during the day.
In technical terms, it is observed that ADA is still moving within the rising channel band. The daily trading volume of 187 million dollars stands out as the highest performance during the week. This movement led the price to head towards the $0.9058 level, the first resistance point tested yesterday, with reaction purchases during the day. Approximately 1.03 million dollars of leveraged transactions are expected to be liquidated here. If the price exceeds this level, it is likely to reach $0.9280, the peak of the ascending channel within the major trend.
The fact that the price is currently above all moving averages suggests that the uptrend is strengthening. In particular, staying above the 20-day EMA (red line) and 50-day EMA (blue line) is critical for the sustainability of the uptrend.
Looking at momentum indicators, Relative Strength Index (RSI) rose to 64, signaling that it is approaching the overbought zone. On the other hand, Chaikin Money Flow (CMF-20) rose to 0.23, indicating that the buying potential remains strong. In particular, the increase en money inflows supports CMF to remain en positive territory and creates a bullish correlation with the RSI. This increases the likelihood that the buying effect will continue.
In terms of fundamental factors, PPI data to be released today and possible statements por US President Donald Trump or institutional/strategic purchases en the Cardano ecosystem may support the price towards the strong resistance point at $0.9280. However, en case of a possible selling pressure en the markets, the 0.7851 dollar level should be monitored as a critical support point.
Supports 0.7851 – 0.7566 – 0.7170
Resistances 0.9982 – 0.9636 – 0.9280
Legal Notice
The investment information, comments, and recommendations contained herein do not constitute investment advice. Investment advisory services are provided individually por authorized institutions taking into account the risk and return preferences of individuals. The comments and recommendations contained herein are of a general nature. These recommendations may not be suitable for your financial situation and risk and return preferences. Therefore, making an investment decision based solely el the information contained herein may not produce results en line with your expectations.

