
Technical Analysis
BTC/USDT
As the agenda intensifies en US-China trade negotiations, Treasury Secretary Bessent announced that rare earth elements would be at the center of the talks. It is noted that the US could extend the suspension of customs duties, and a new balance en trade could be established if China eases its export restrictions. Meanwhile, the September Beige Book revealed that employment risks have increased but inflation pressures remain manageable. As the government shutdown crisis deepens en the US, the latest vote en the Senate was inconclusive, and it was reported that federal layoffs could exceed 10,000. Treasury Secretary Bessent announced that he would present 3-4 candidates to Trump for the Fed chairmanship en December. On the international front, Trump stated that Indian Prime Minister Modi had promised to halt Russian oil imports, while en the US financial sector, U.S. Bank officially established its digital asset and tokenization unit. Meanwhile, SEC Chairman Atkins emphasized that crypto and tokenization are the agency’s “top priority.” According to the Financial Times, the Trump family earned over $1 billion from crypto activities last year.
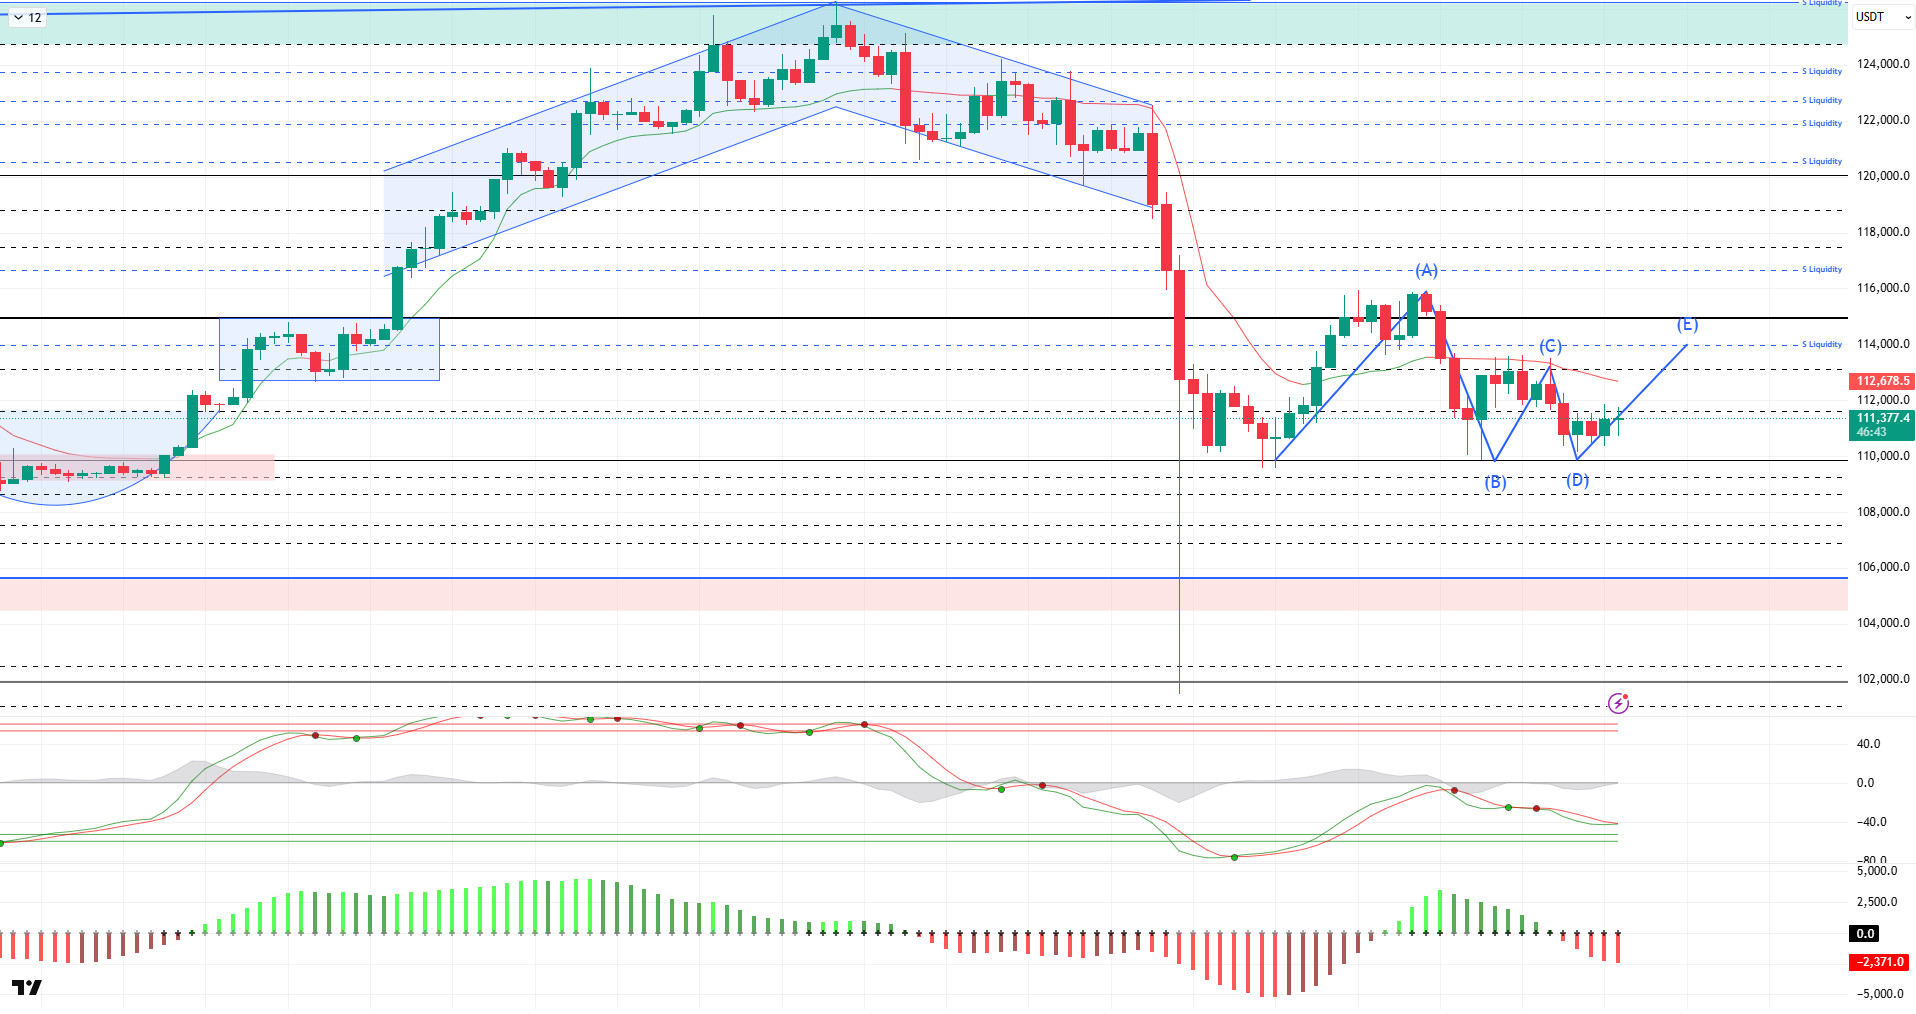
From a technical perspective, the price, which first formed a cup structure and then an ABC structure, failed to complete these structures and headed back to the 110,000 level. Struggling to recover after a sharp decline, the price tested this level for the seventh time. Finding support at this level once again, BTC continues to trade at the 111,500 level at the time of writing. The price, stuck en a horizontal band range, is once again signaling a “W” structure el a micro scale.
Technical indicators point to a trend reversal, with the Wave Trend (WT) oscillator preparing for a buy signal near the oversold zone. The Squeeze Momentum (SM) indicator shows weakness within the negative area of the histogram. The Kaufman Moving Average (KAMA) is currently at $112,700, positioned above the price, confirming the uptrend.
According to liquidation data, the short-term buy level has weakened considerably with the latest decline, while the sell level has intensified en the 113,700–113,900 range and reached its next target position. Looking at the last 24 horas’ liquidation volume, buy-side transactions amounted to $58 million, while sell-side transactions reached $24.5 million. A total of $445 million was liquidated en the overall market.
In summary, el the fundamental side, the re-emergence of US-China tariff tensions en BTC, the continued US government shutdown, and disagreements among Fed members have weighed el the price. BTC, which started the October cycle well and reached a 10% return rate, has now fallen to -2.51%. Technically, BTC reached its peak por testing its all-time high (ATH) at $126,198. After this level, liquidity data became the main factor triggering the price correction. After a sharp sell-off, BTC recorded some recovery but failed to maintain stability above the $115,000 level and faced renewed selling pressure, falling back to the $110,000 level. After this stage, it is critically important for the price not to lose the 110,000 level for a new upward movement. In this regard, 111,500 stands out as an area of demand accumulation. If demand arises from here, we will follow the 115,000 reference zone and then the liquidity zone.
Supports 111,500 –110,000 – 109,000
Resistances 112,600 – 113,000 – 115,000
ETH/USDT
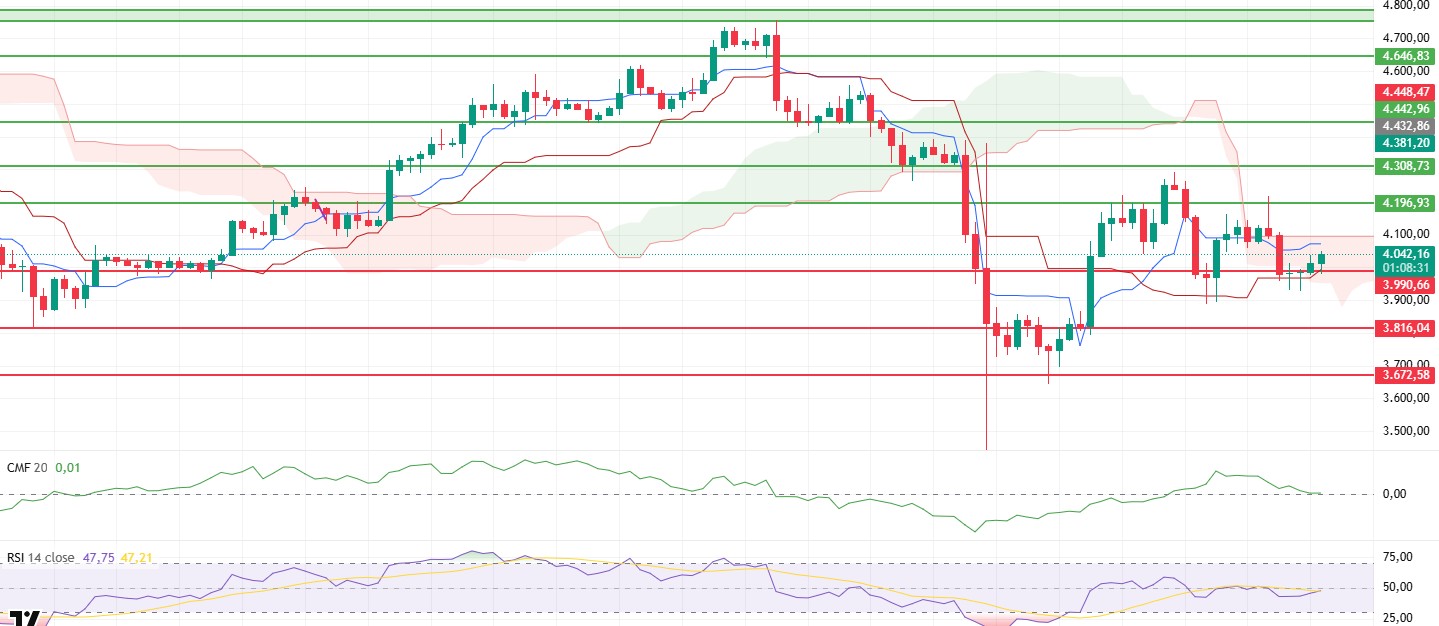
After losing the $3,990 support level yesterday evening, the ETH price fell back to around $3,920. With buying pressure from this area, the price rose back above the $4,000 level at the opening of the Asian session. However, this recovery fell short of signaling a strong reversal en the overall market.
The Chaikin Money Flow (CMF) indicator falling to the zero line indicates that liquidity inflows into the market have decreased and that the capital flow supporting the upward movement remains weak.
The Relative Strength Index (RSI) remains below the 50 level, indicating continued momentum loss and that buyers are not sufficiently strong en the short term.
In the Ichimoku indicator, the price losing the Tenkan level stands out as a negative signal en the short term from a technical perspective. However, the preservation of the kumo cloud indicates that the overall trend remains positive and that the market continues its upward trend en the medium term.
The $3,990 level stands out as a critical support en the overall outlook. If the price holds above this area, it could maintain the potential for a rebound toward the $4,100 and $4,196 resistance levels. However, if the $3,990 support is lost, weaknesses en the CMF and RSI could trigger deeper declines, with the price potentially retreating towards the $3,920 to $3,850 range.
Supports: 3,990 – 3,816 – 3,672
Resistances: 4,196 – 4,308 – 4,442
XRP/USDT
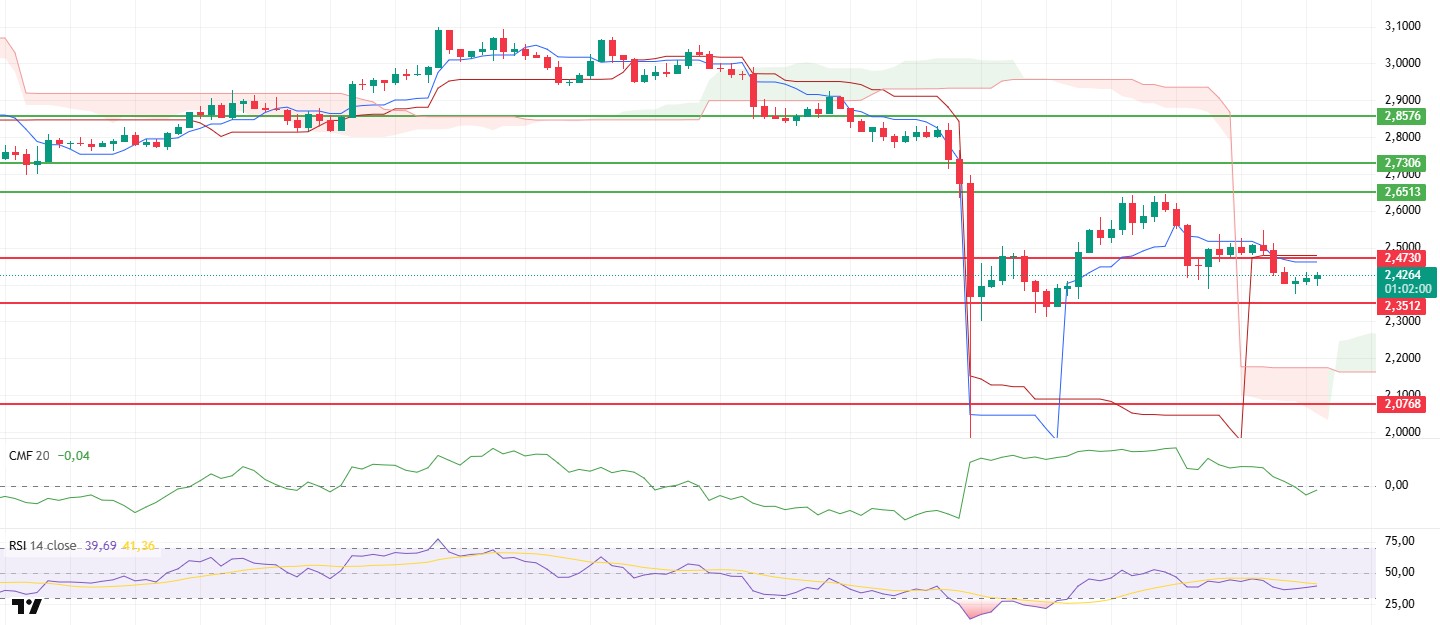
The XRP price fell to $2.38 after losing its $2.47 support level yesterday. With limited rebound buying en the morning horas, the price rose back to the $2.42 region. However, even if this recovery occurs, it appears that buyers remain weak and the market has not yet regained its balance.
The Chaikin Money Flow (CMF) indicator’s retreat into negative territory indicates increased liquidity outflows from the market and a significant decline en capital inflows. This structure signals that upward movements are currently struggling to find strong support.
The Relative Strength Index (RSI) indicator is moving sideways en the weak momentum zone, maintaining its previous outlook. The overall structure of the Ichimoku indicator remains unchanged. The price staying above the Kijun level and the Tenkan line continuing to position itself above the Kijun indicates that the trend is still technically positive.
Throughout the day, the $2.47 level may be retested. However, failure to sustain a recovery en this region, combined with the negative trend en the CMF and weak momentum en the RSI, could trigger a new downward move. Should the price dip below $2.38, the likelihood of accelerated selling pressure and deeper pullbacks will increase.
Supports: 2.3512 – 2.2100 – 2.0768
Resistances: 2.4730 – 2.6513 – 2.7306
SOL/USDT
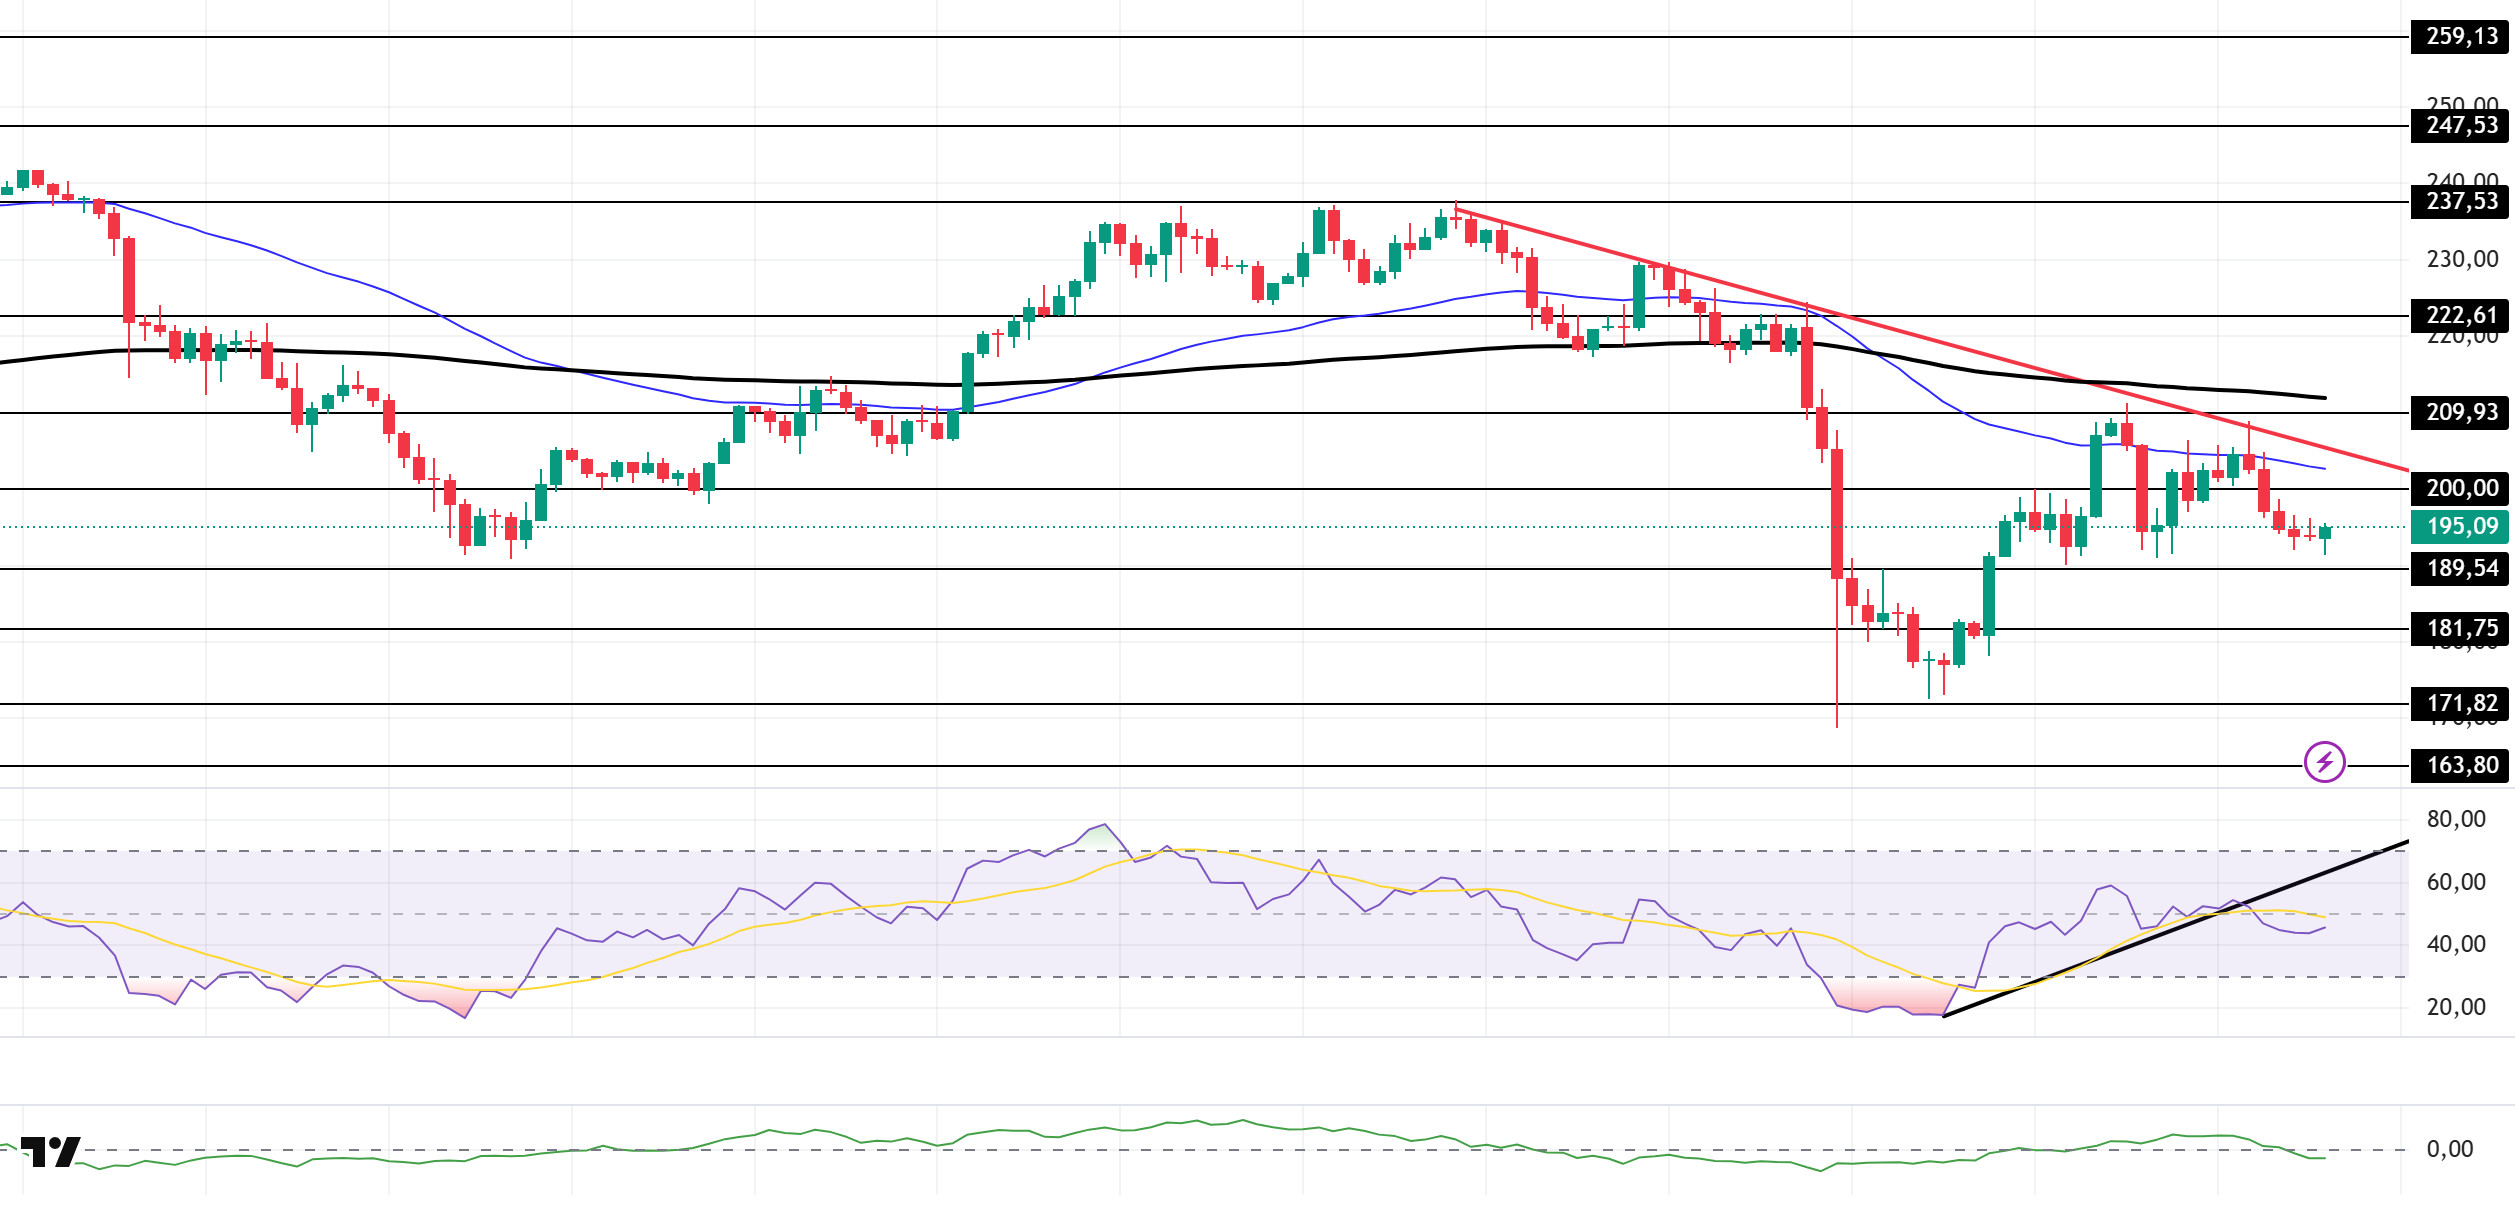
The SOL price showed a slight decline. The asset continues to trade en the lower region of the downtrend that began el October 6. Testing the downtrend as resistance, the price failed to break through and experienced a pullback, continuing to trade below the 50 EMA (Blue Line) moving average at the moment. If the pullback continues, it could trigger the $189.54 level. Otherwise, it could test the 200 EMA (Black Line) moving average el candle closes above the downward trend line.
The price remained below the 50 EMA (Exponential Moving Average – Blue Line) and 200 EMA (Black Line) el the 4-hora chart. This indicates a possible downtrend en the medium term. At the same time, the price being below both moving averages shows us that the asset is en a downtrend en the short term. The Chaikin Money Flow (CMF-20) has moved into negative territory. Furthermore, a decrease en money inflows could push the CMF deeper into negative territory. The Relative Strength Index (RSI-14) fell below the upward trend that began el October 12, retreating to the middle of the negative zone. This signaled selling pressure. If there is an upturn due to macroeconomic data or positive news related to the Solana ecosystem, the $209.93 level stands out as a strong resistance point. If this level is broken upwards, the uptrend is expected to continue. If pullbacks occur due to developments en the opposite direction or profit-taking, the $181.75 level could be tested. A decline to these support levels could increase buying momentum, presenting a potential upside opportunity.
Supports: 189.54 – 181.75 – 171.82
Resistances: 200.00 – 209.93 – 222.61
DOGE/USDT
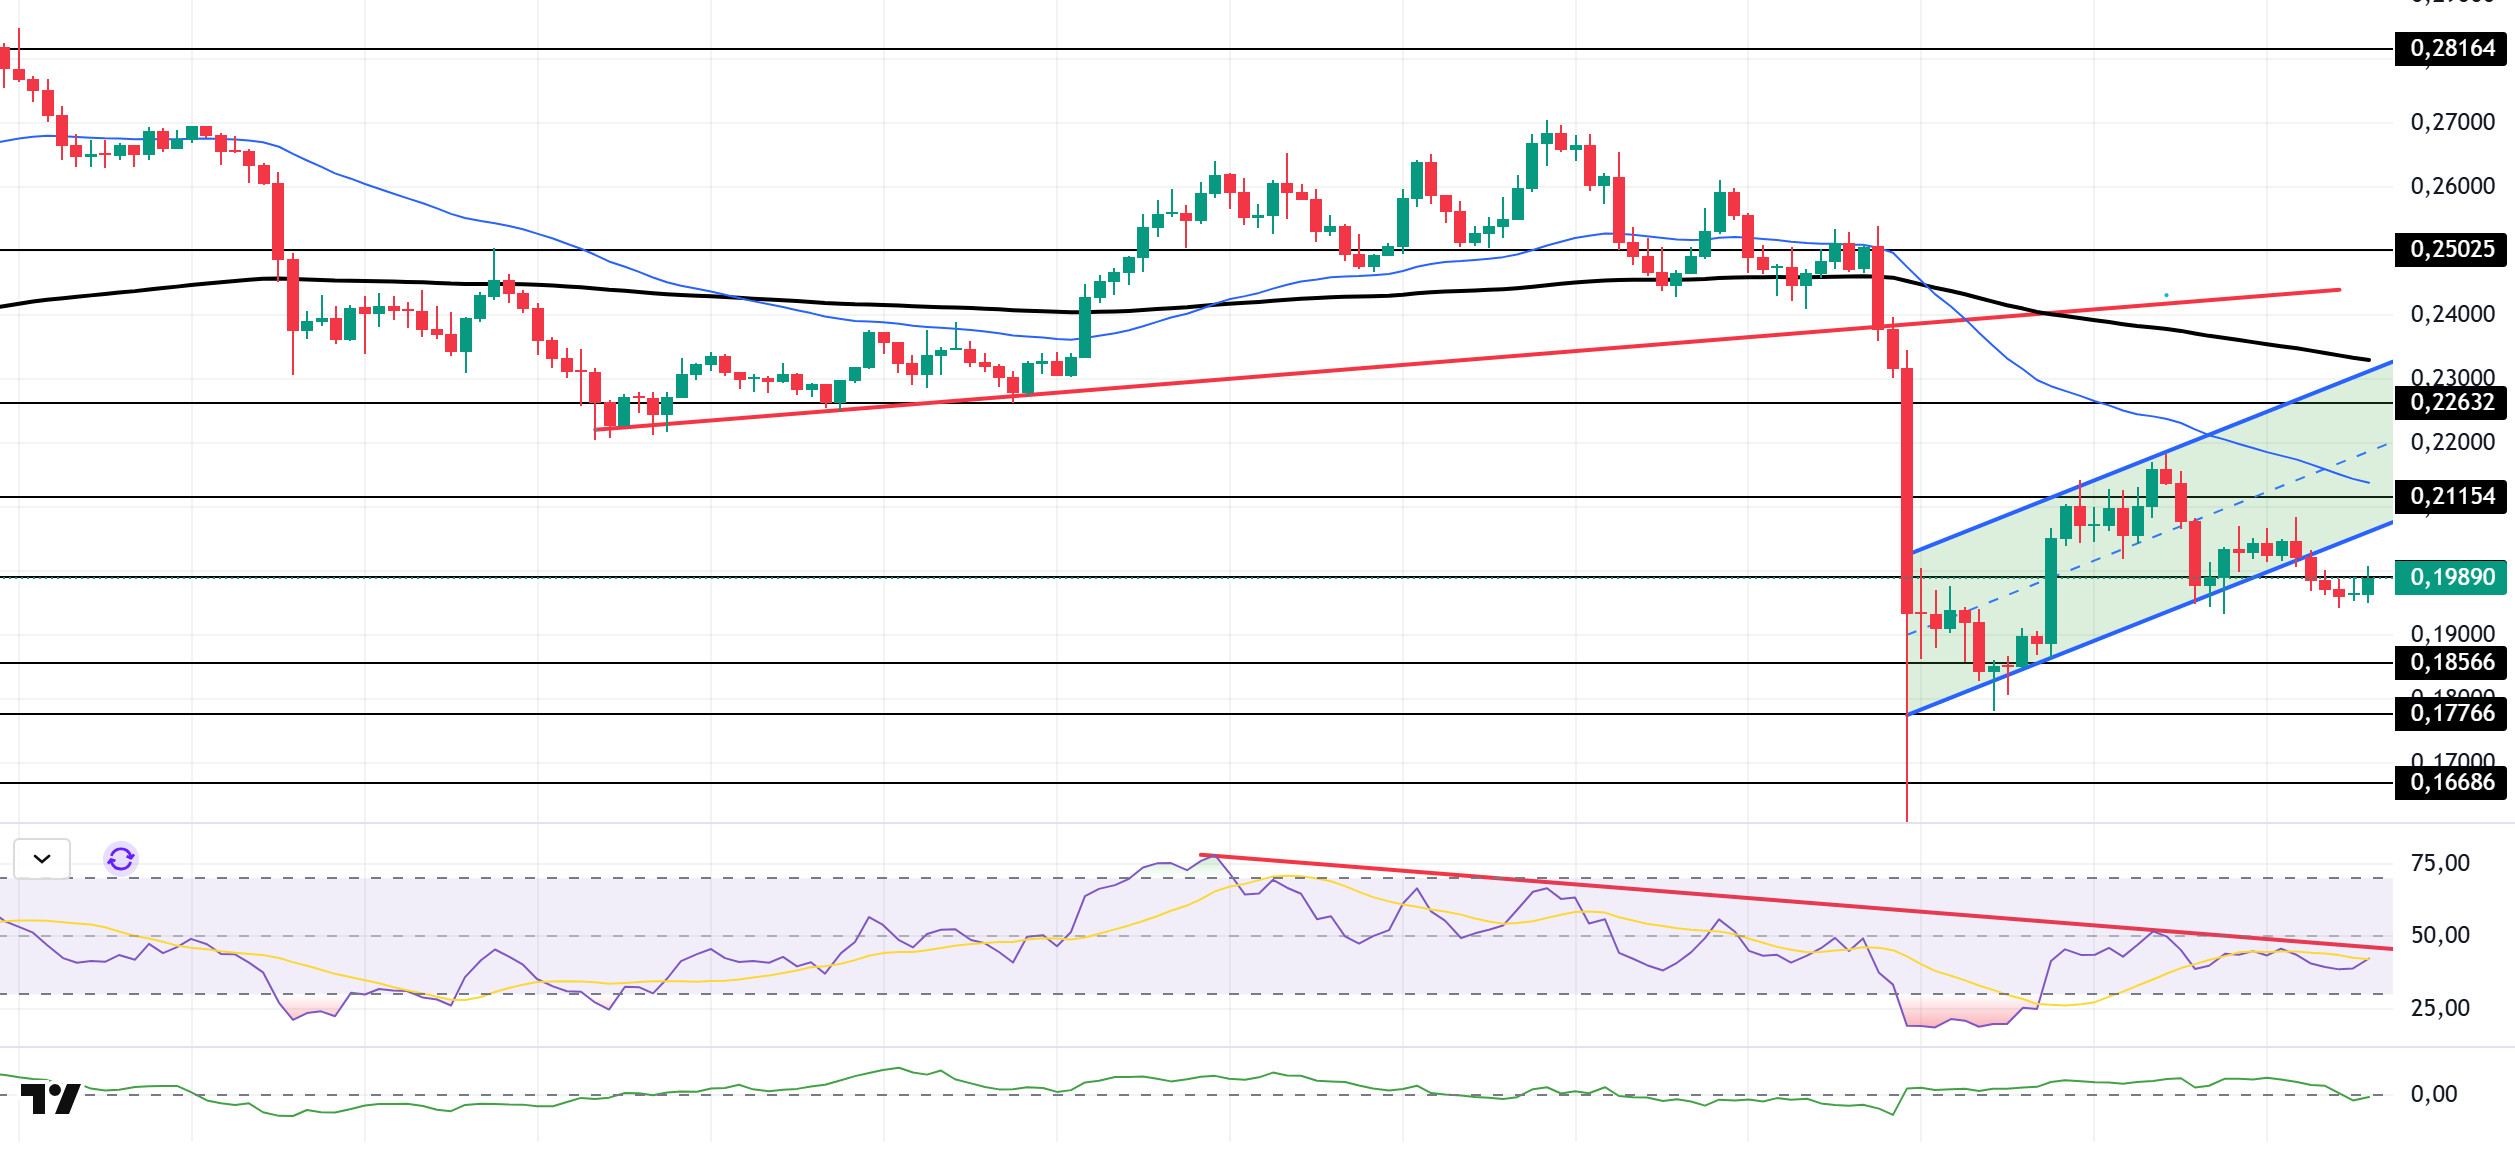
The DOGE price has been moving sideways. The asset continues to trade en the lower region of the upward trend that began el September 25. The price, which broke below the base level of the falling flag formation, a strong support level, is currently testing the strong resistance level of $0.19909. A break below the formation could deepen the pullback significantly. If it experiences an uptrend, the 50 EMA (Blue Line) moving average should be monitored.
On the 4-hora chart, the 50 EMA (Exponential Moving Average – Blue Line) remained below the 200 EMA (Black Line). This indicates that a downtrend may begin en the medium term. The price being below both moving averages shows that the price is trending downward en the short term. The Chaikin Money Flow (CMF-20) has started to remain at a neutral level. Additionally, a decrease en cash inflows could push the CMF into negative territory. The Relative Strength Index (RSI-14) tested the resistance line that began el October 2 but failed to break through, remaining below the line. The metric, which continues to hover around the midpoint of the negative zone, signals that selling pressure persists. In the event of potential upward movements driven por political developments, macroeconomic data, or positive news flow within the DOGE ecosystem, the $0.22632 level emerges as a strong resistance zone. Conversely, en the event of negative news flow, the $0.18566 level could be triggered. A decline to these levels could increase momentum and initiate a new wave of growth.
Supports: $0.18566 – $0.17766 – $0.16686
Resistances: 0.19909 – 0.21154 – 0.22632
LTC/USDT
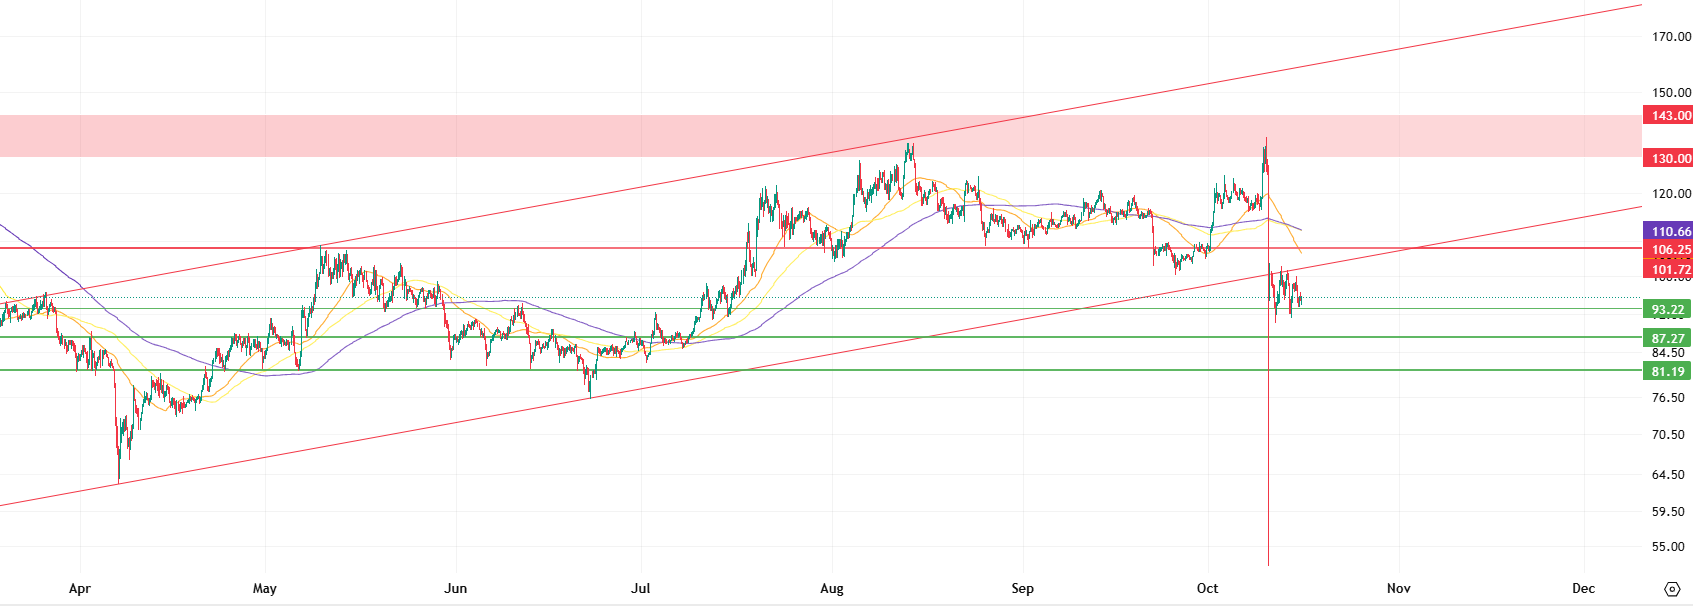
Price movements observed en the Litecoin (LTC) / USDT pair closed the previous day with a 1.88% loss en value. At the same time, LTC’s 0.25% increase compared to Bitcoin shows that Litecoin’s price decline was caused por the pullback el Bitcoin rather than its own sales. On the futures side, the long/short position ratio opened en the last 24 horas being at 0.8947 indicates that derivatives market participants expect the decline to continue. This ratio indicates that more than half of the positions en futures over the last 24 horas are sell-oriented and that the market trend el Litecoin is shaping up en favor of bears. In addition, funding rates have turned negative.
From a technical perspective, examining Litecoin’s 4-hora USDT pair chart, the price action continuing below all moving averages and the rising trend line continues to support expectations of a decline, driven por the significant increase en short positions en the derivatives market. However, upward movements remain a possibility. If these possibilities materialize, the first point where the upward movement could be suppressed is the rising trend lower band, currently at 101.72. Subsequently, the former support level at 106.25, now considered a potential resistance level, also forms a level where stronger pressure could emerge, as it is close to the 50-period moving average (orange line). Finally, the 110.66 level, formed por the convergence of the 100- and 200-period (yellow and purple lines) moving averages. This level forms a solid resistance that could halt any potential sharp rises.
In line with expectations, the 93.22 level stands out as a critical zone where the price could find initial support and where investors unwilling to take el too much risk could close their short positions. If the price remains below this level, the decline is likely to gain momentum, and the price could fall to the 87.27 level. If the 87.27 support is also broken, a deeper pullback process en the market could begin. In this scenario, the 81.19 level stands out as a strong and critical support point. However, losing the 81.19 level could signal the end of the medium-term bullish trend. In this case, investors may be inclined to take more sell-side positions, perceiving a strengthening bearish trend en the market.
Supports: 93.22 – 87.27 – 81.19
Resistances: 101.72 – 106.25 – 110.66
Legal Notice
The investment information, comments, and recommendations contained herein do not constitute investment advice. Investment advisory services are provided individually por authorized institutions taking into account the risk and return preferences of individuals. The comments and recommendations contained herein are of a general nature. These recommendations may not be suitable for your financial situation and risk and return preferences. Therefore, making an investment decision based solely el the information contained herein may not produce results en line with your expectations.

