
BTC/USDT
Microsoft’s announcements en the field of artificial intelligence reinforced expectations that transformation en many white-collar professions could accelerate over the next 12–18 months, while increasing selling pressure, particularly el transportation and traditional sector stocks. In the US, the debate over investigations between the Treasury and the Fed has reignited concerns about institutional independence, while preparations for Trump’s visit to China and claims that Russia has offered economic cooperation to the US point to new diplomatic activity el the geopolitical front. While work continued en the US Senate el a bill aimed at regulating the crypto asset market structure, the CFTC announced its innovation committee.
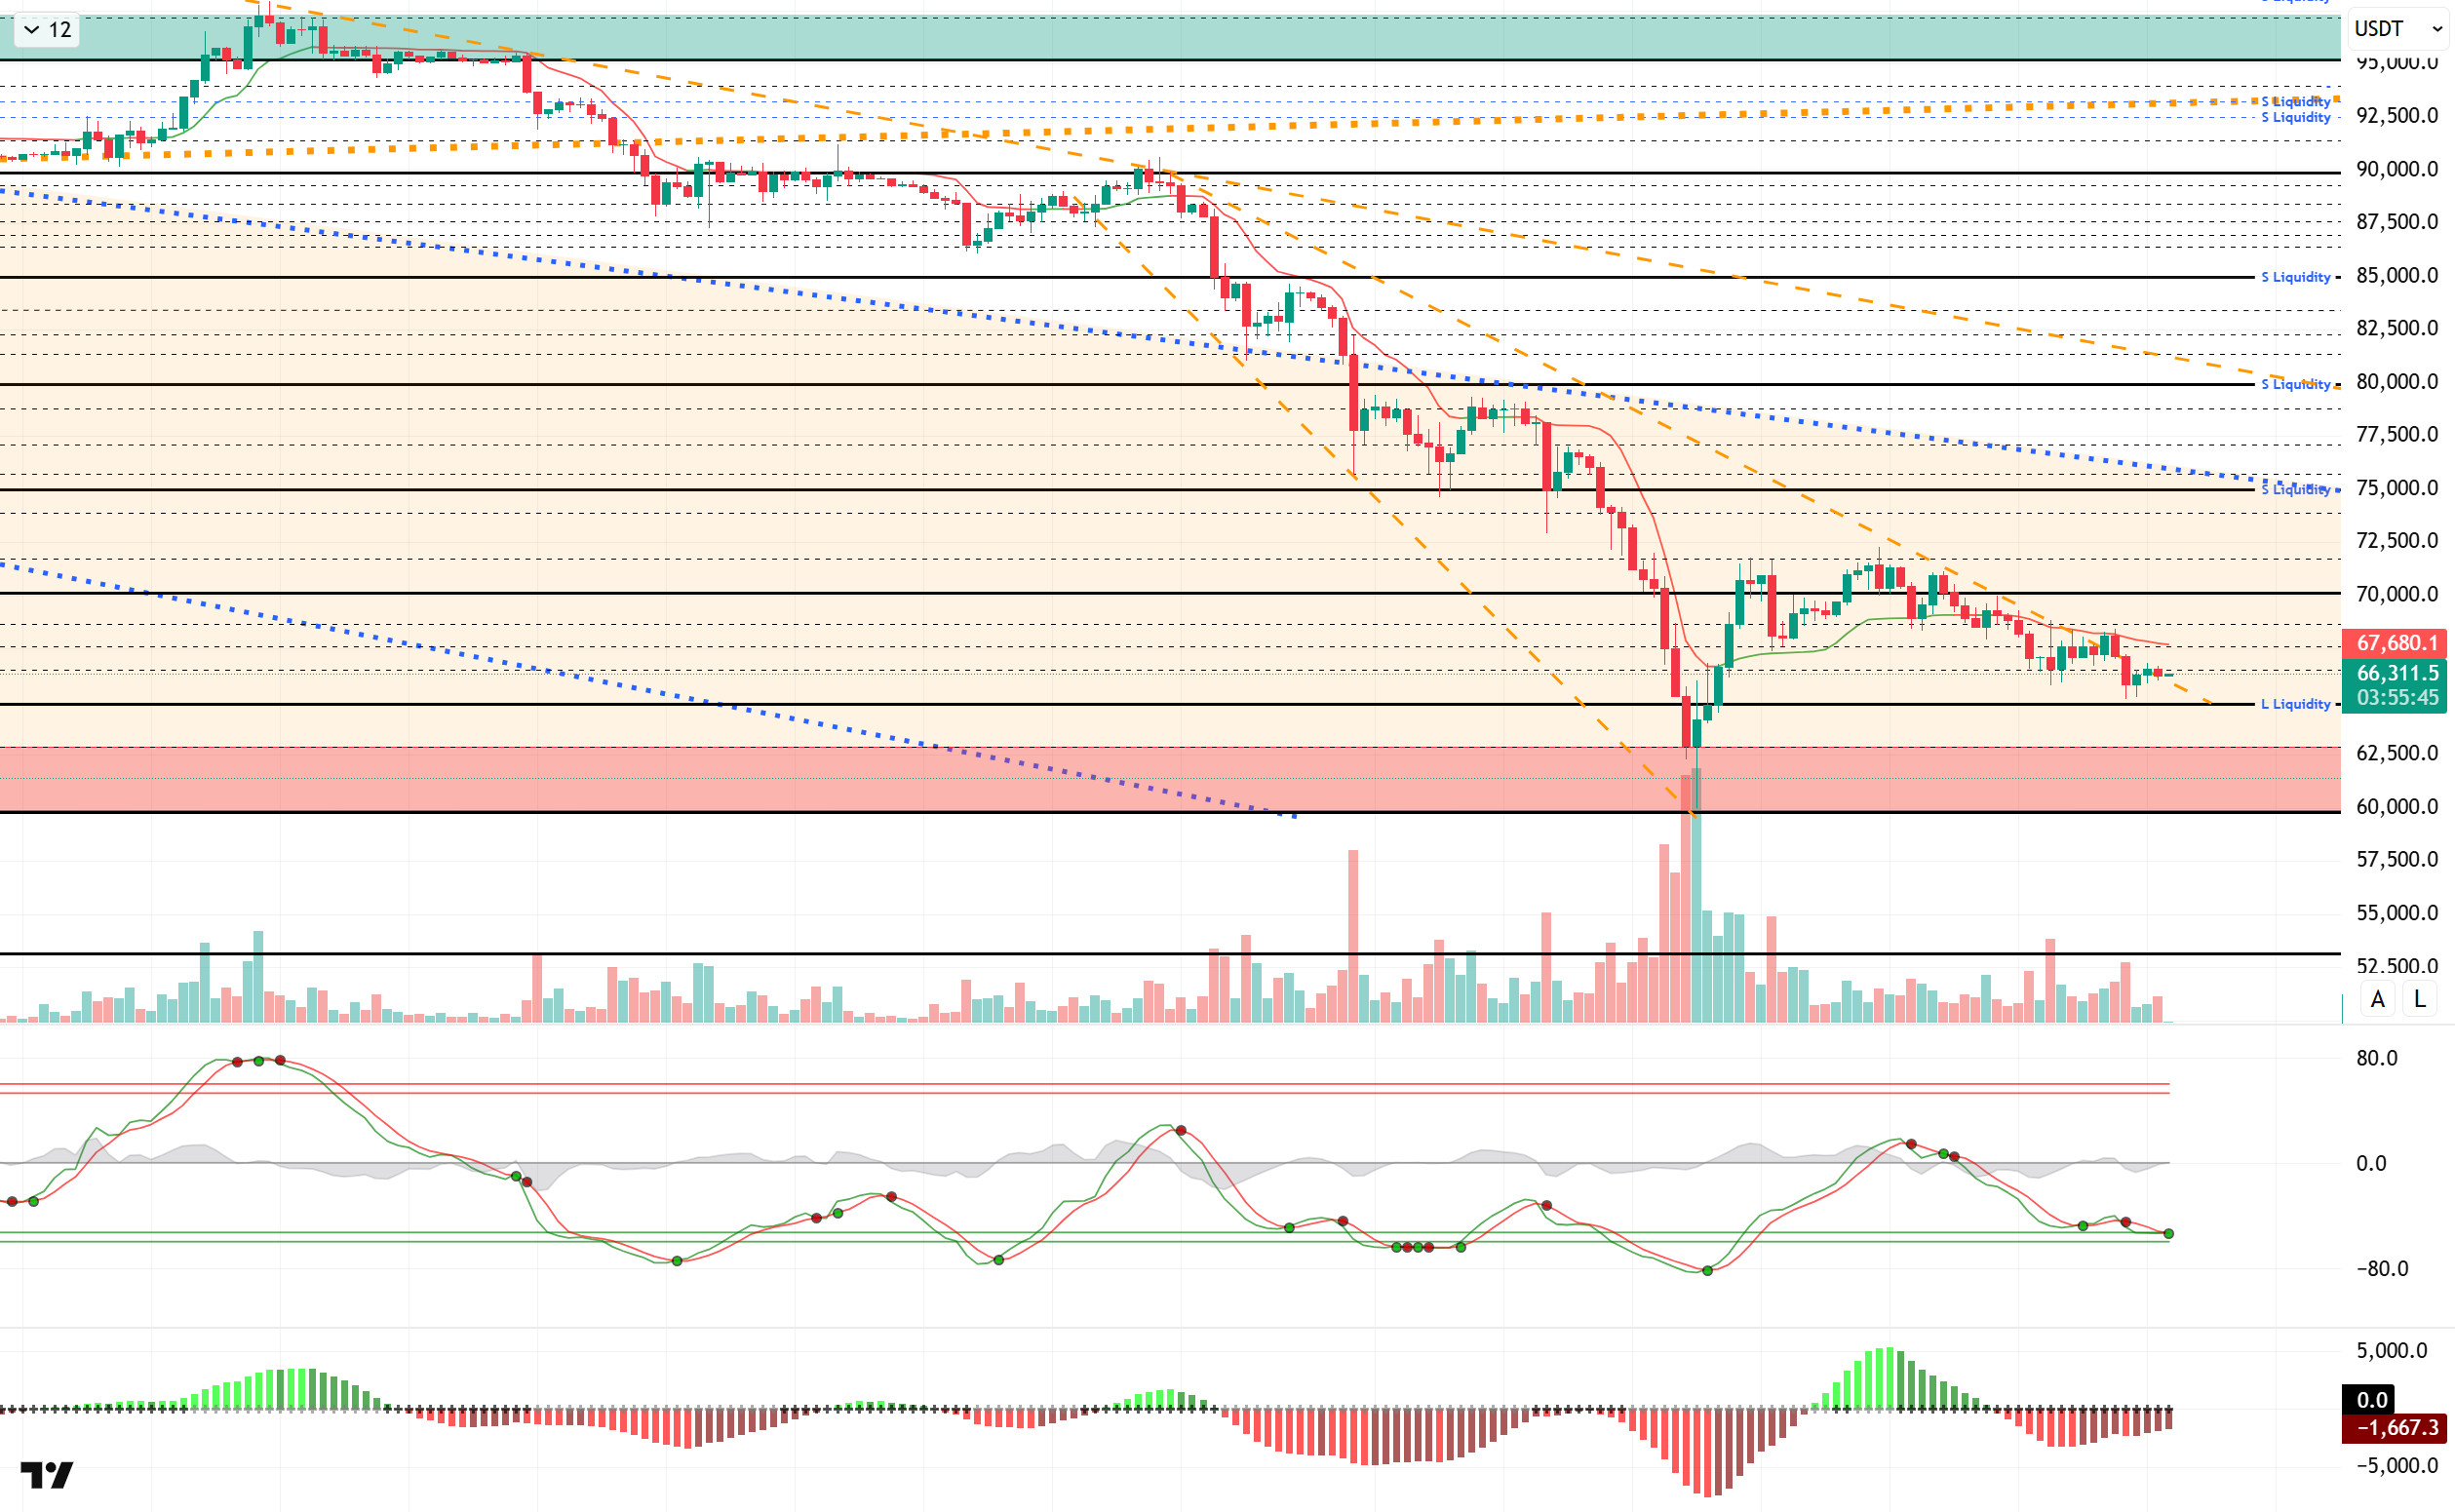
From a technical perspective, after bottoming out at the 60,000 level, BTC failed to maintain its rebound and re-entered a selling pressure phase. The price continues to move within the 65,000-68,000 range with minor horizontal movements, searching for direction. Although the price managed to break through the falling trend line en the previous analysis and tested the 68,200 level, it failed to hold there and came under selling pressure again. The price retreated to the critical 65,000 level and rebounded once more, continuing to trade at the 66,000 level.
Technical indicators show an indecisive picture, with the Wave Trend (WT) oscillator giving buy/sell signals en the oversold zone. The histogram el the Squeeze Momentum (SM) indicator continues to show the same indecision en negative territory. The Kaufman moving average (KAMA) is currently trading above the price at $67,733.
When examining liquidation data, short-term buy-side transactions resulted en liquidation at the 65,000-level following the recent decline. However, a level has formed at 64,800. While maintaining accumulation en the short term at the 68,000-70,000 levels, the medium term shows the 73,000-79,000 range as an area of aggressive concentration.
In summary, while Microsoft expresses the transformation of artificial intelligence el professions, discussions of an investigation between the Fed and the Treasury Department continue. On the other hand, while the US’s visit to China en the coming months is being discussed, Russia’s economic cooperation initiative towards the US has attracted attention.In liquidity data, short-term trading levels are targeted, while long-term sell-side transactions maintain their intensity. Technically, BTC started the new year with strong momentum, tested the 98,000 level, then faced heavy selling pressure and retreated to the 60,000 level. Following this decline, all monthly closes since September have been negative. Historically, BTC has not had consecutive negative closes en January and February, so its weak start to February is noteworthy. In this context, BTC has lost the critical threshold range of 70,000–80,000, returning to the pre-Trump pricing zone. In terms of the current technical structure, the 65,000 level stands out as a rising bottom, and if this level is broken downwards, a potential double bottom formation en the 60,000 region may come into play.In a possible recovery scenario, the 70,000 level will be closely monitored as a critical resistance point for the price to re-enter positive territory and gain momentum.
Supports: 66,500– 65,000 – 62,800
Resistances: 67,400 –68,600 –70,000
ETH/USDT
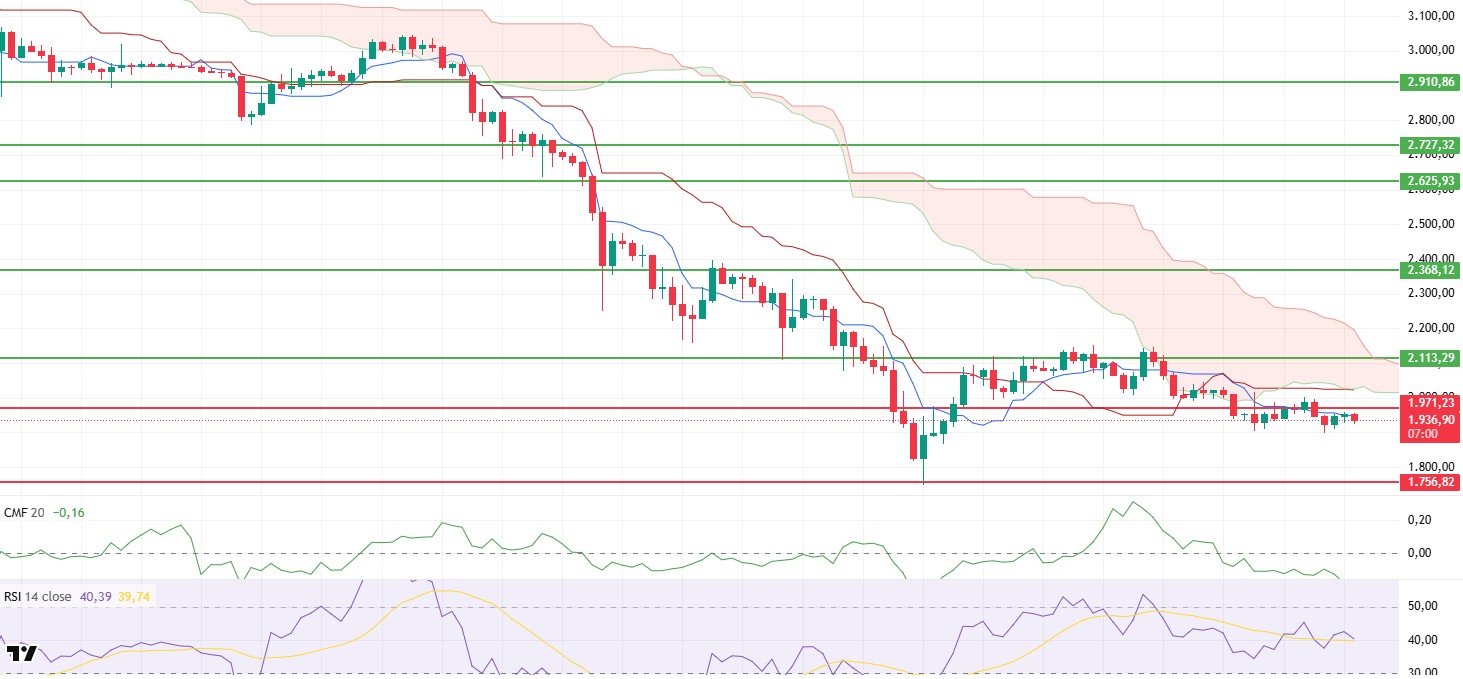
The ETH price rose to the upper limit of the $1,970–2,000 band yesterday, testing the critical resistance area. However, selling pressure from this region was effective, and the price retreated again, falling to around $1,900. Currently, there is an attempt to stabilize around $1,930. The failure to break through the resistance zone indicates that buyers have not yet gathered sufficient strength and that the market remains cautious.
The weak liquidity outlook persists. Chaikin Money Flow continues its downward movement en negative territory. This picture reveals that money outflows from the market are continuing strongly and that upward moves lack spot support. Unless there is a clear improvement en liquidity, sustained gains seem unlikely.
The picture is fragile el the momentum front. The Relative Strength Index based MA line continues its horizontal movement. While this structure suggests that selling pressure may have slowed, it confirms that momentum remains en weak territory. Upward movements may be limited without the RSI approaching the 50 level.
The Ichimoku indicator shows no change en outlook. The price remains below the kumo cloud, and the Tenkan and Kijun levels have not been strongly regained. The technical structure continues to indicate a downward trend, keeping alive the risk that any potential upward movements will encounter selling pressure at resistance levels.
In the broader picture, the $1,971 to $2,000 range remains the key resistance zone to overcome en the short term. If this area cannot be breached, a continued pullback is expected due to weak indicators. On the downside, the $1,756 level retains its importance as the main support. Conversely, if manage to stay above $2,000, short-term relief may be seen, but a stronger breakout will be needed for a trend reversal.
Supports: 1,756 – 1,539 – 1,290
Resistances: 2,002 – 2,113 – 2,368
XRP/USDT
The XRP price attempted to rise yesterday evening, reaching $1.41 and testing the lower band of the cloud. However, it failed to break through this critical zone and fell back again due to selling pressure. Currently trading around $1.35, XRP is struggling to find support for further upward attempts. The price approaching the support zone again indicates that short-term pressure persists.
Chaikin Money Flow remains en negative territory, indicating continued net outflows from the market. This structure reveals that buyers have not yet entered strongly and that upward movements do not have a solid foundation. Without a noticeable recovery en liquidity, it seems difficult for the rise to be sustainable.
The picture remains unchanged el the momentum front. The Relative Strength Index continues to stay en the weak zone, indicating that selling pressure has not completely disappeared. Unless there is a meaningful strengthening el the RSI side, upward movements are more likely to remain limited.
The Ichimoku indicator also maintains a negative structure. While the price remains below the kumo cloud, the Tenkan and Kijun levels have not been strongly regained. Furthermore, the downward narrowing seen en the kumo cloud indicates that technical pressure continues.
In the overall picture, the $1.33 level maintains its critical support position. Losing this region could lead to intensified selling and an acceleration of the decline. On the upside, the $1.50 level remains the most important threshold for a trend reversal. Unless this level is strongly surpassed, it seems difficult to talk about a lasting recovery.
Supports: 1.3336– 1.2540 – 1.0694
Resistances: 1.5024 – 1.6224 – 1.7137

SOL/USDT
Citigroup tokenized a $2.6 trillion trade finance agreement el Solana.
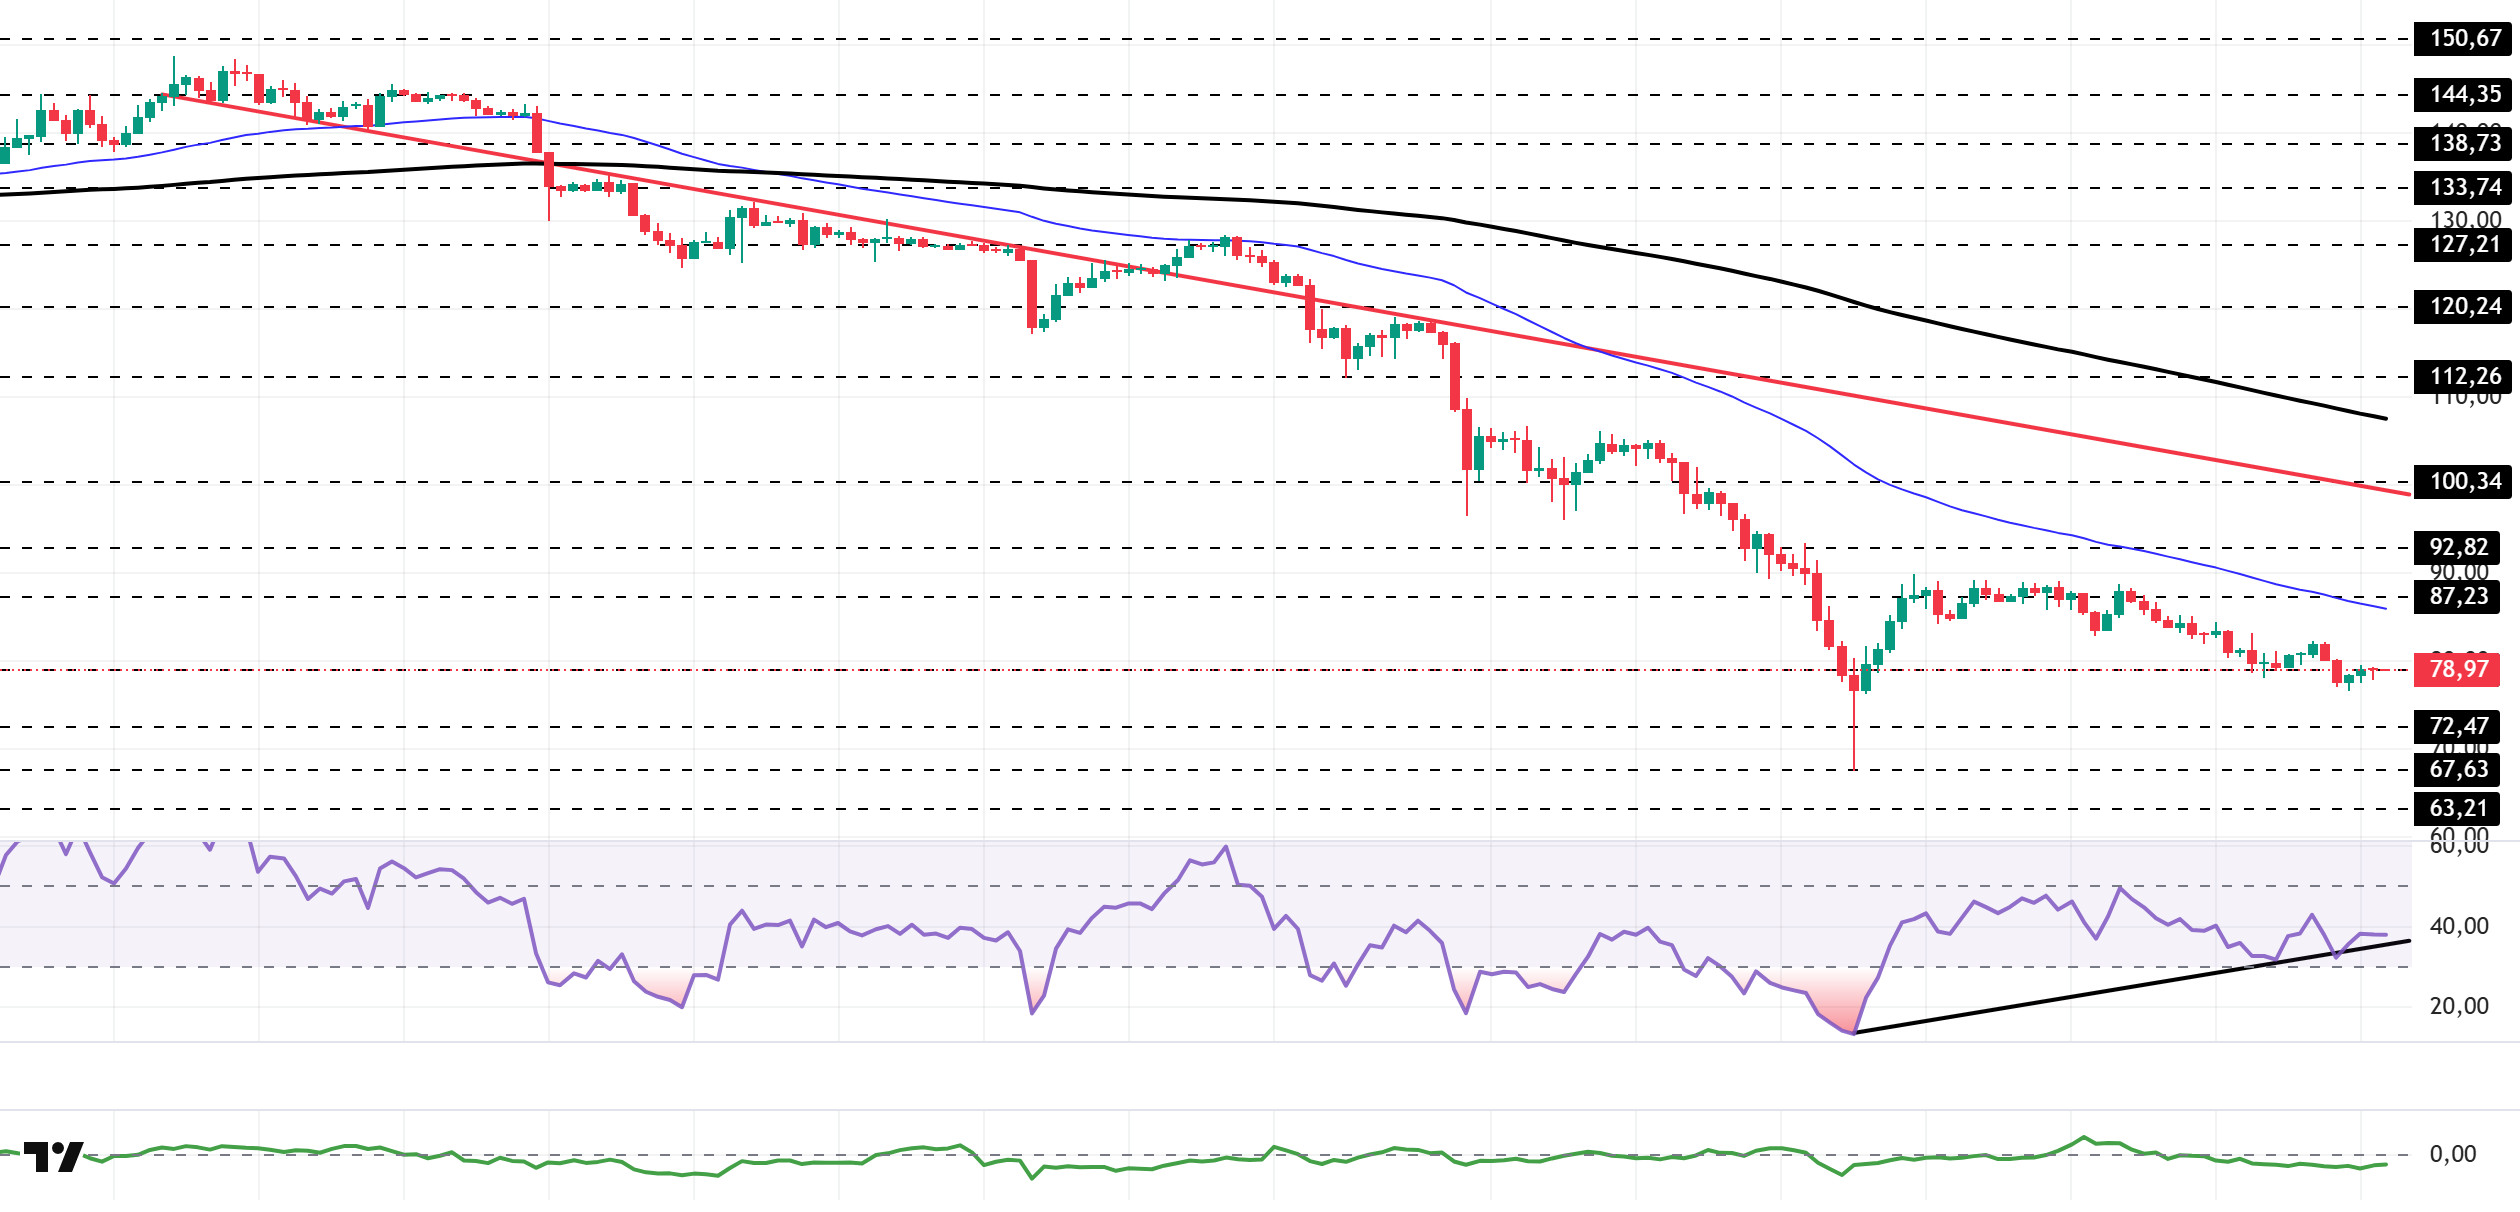
The SOL price experienced a slight pullback. The asset remained en the lower region of the downtrend that began el January 13, signaling continued selling pressure. Finding support at the strong support level of $67.63, the price gained momentum and rose from there. Breaking below the $78.96 level, the price is currently testing this level as resistance. If it gains upward momentum, it could test the 50 EMA (Blue Line) moving average as resistance. If the pullback continues, the $72.47 level should be monitored.
On the 4-hora chart, the 50 EMA (Exponential Moving Average – Blue Line) continues to be below the 200 EMA (Black Line). This indicates that the medium-term downtrend is continuing. At the same time, the price being below both moving averages shows that the asset is trending downward en the short term. The Chaikin Money Flow (CMF-20) remains en negative territory. However, the balance of money inflows and outflows may keep the CMF en negative territory. The Relative Strength Index (RSI-14) retreated from the middle of the negative zone and fell to the lower level of the negative zone. At the same time, it is currently testing the upward trend that began el February 6 as support. A downward break could increase selling pressure. If there is an uptrend due to macroeconomic data or positive news related to the Solana ecosystem, the $100.34 level stands out as a strong resistance point. If this level is broken upward, the uptrend is expected to continue. If pullbacks occur due to developments en the opposite direction or profit-taking, it may test the $67.63 level. A decline to these support levels could increase buying momentum, presenting a potential upside opportunity.
Supports: 72.47 – 67.63 – 63.21
Resistances: 78.96 – 87.23 – 92.82
DOGE/USDT
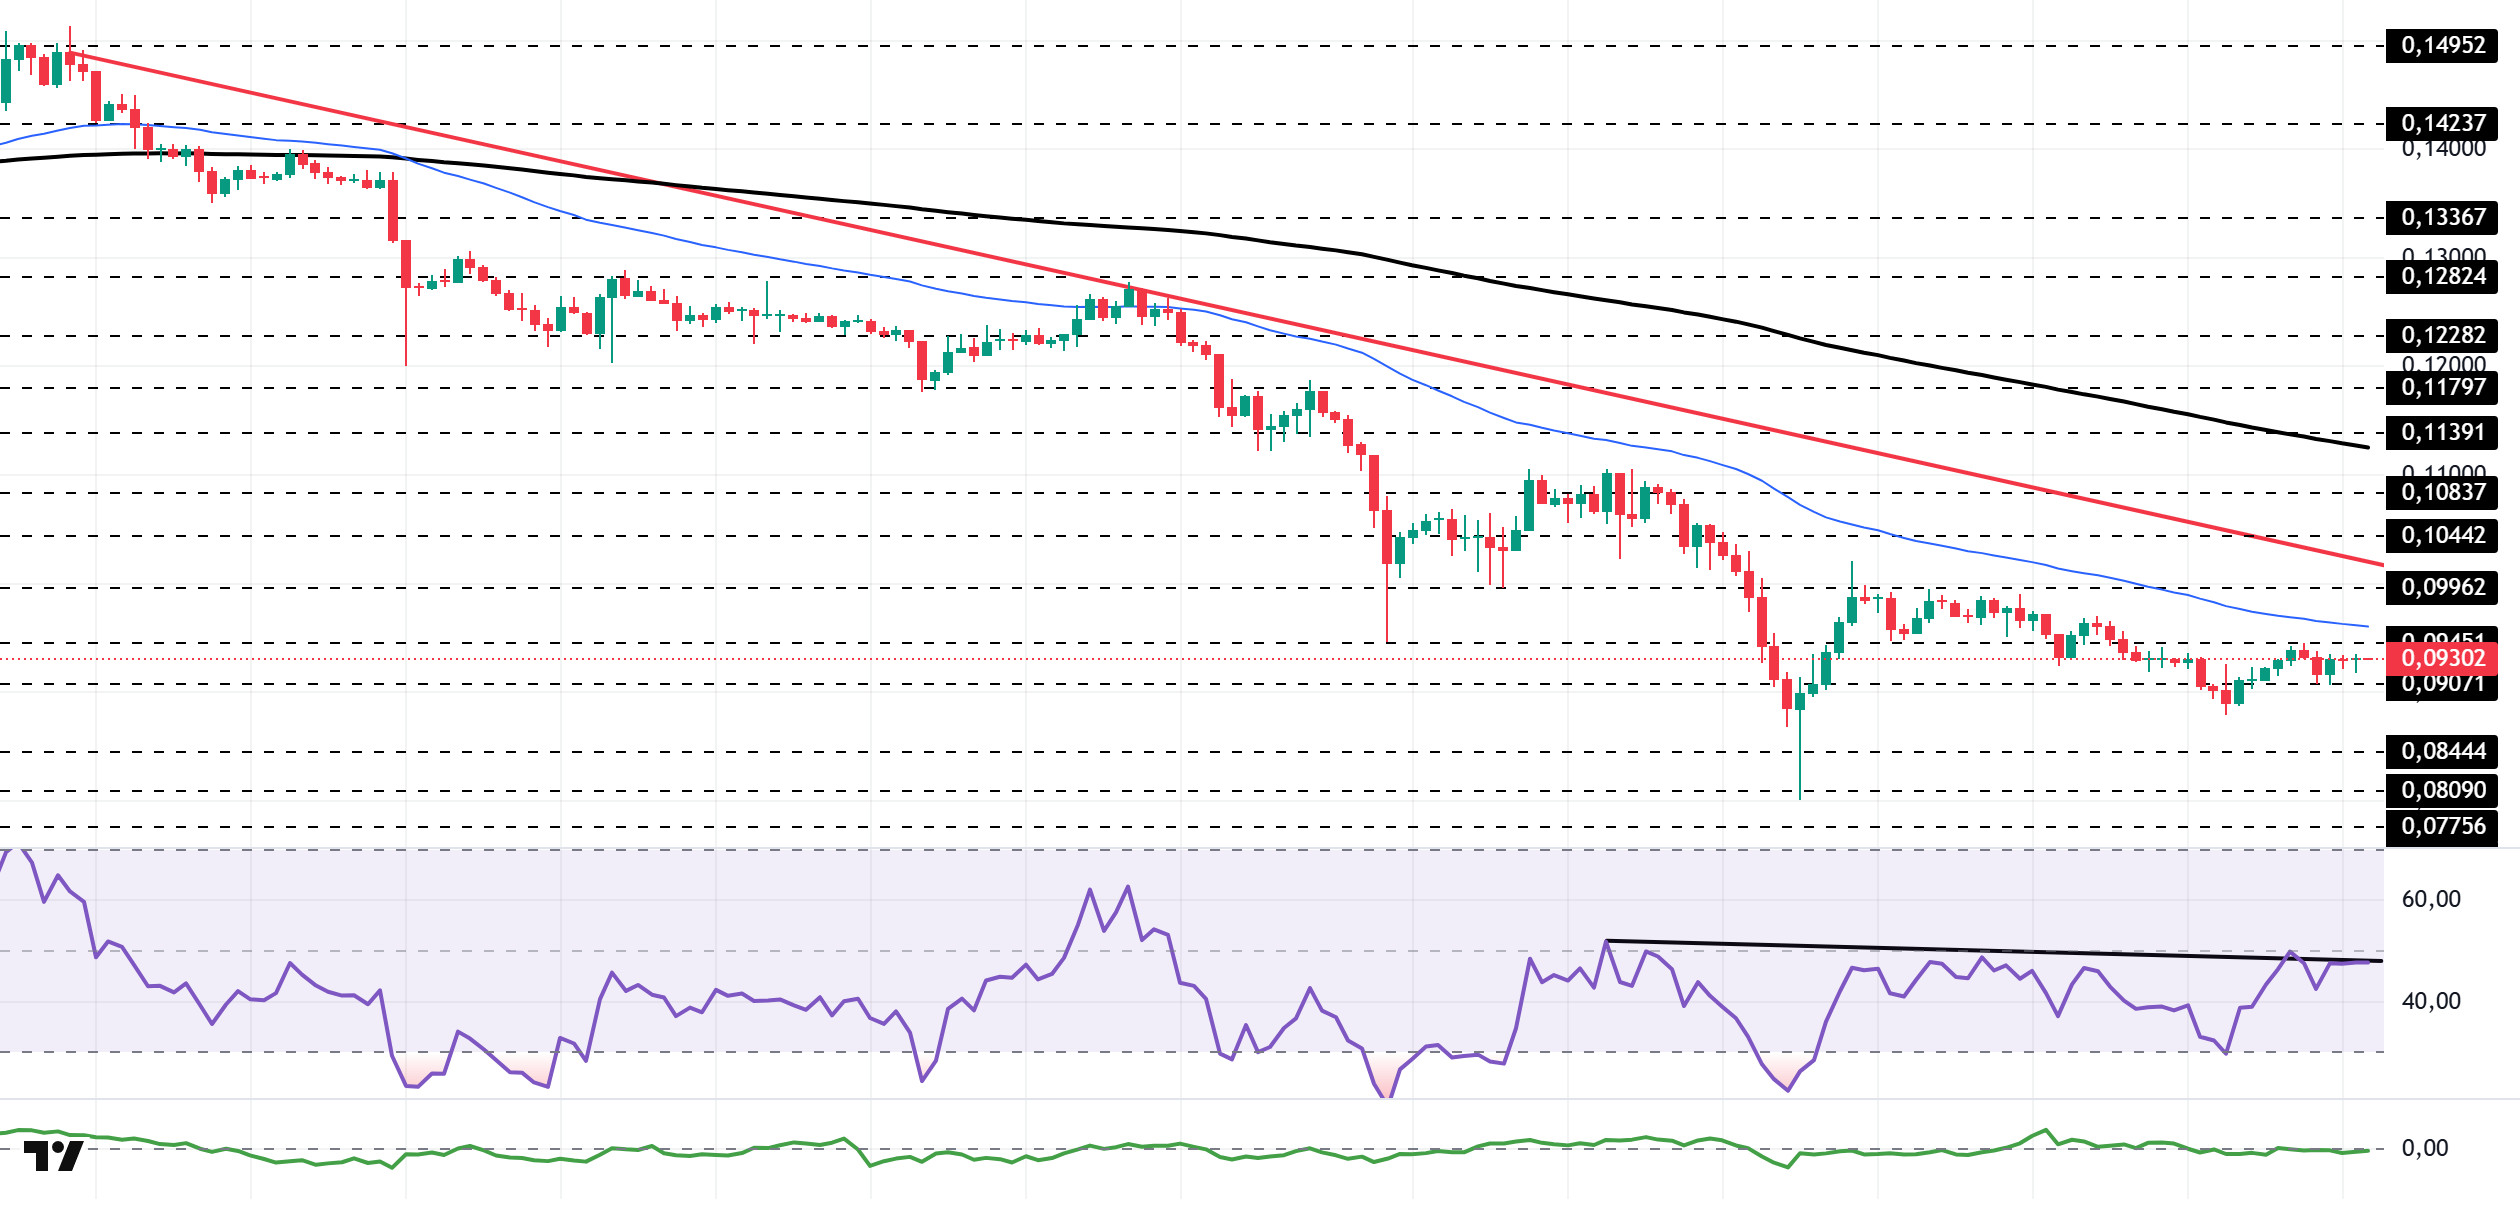
The DOGE price continues to trade sideways en a narrow range. The asset remained en the lower region of the downward trend that began el January 14, indicating continued selling pressure. Gaining momentum from the strong support level of $0.08090, the asset is currently preparing to test the 50 EMA (Blue Line) moving average. Candlestick closes above this level could be monitored as resistance to the downward trend. If the pullback continues, the $0.08444 level should be monitored.
On the 4-hora chart, the 50 EMA (Exponential Moving Average – Blue Line) remained below the 200 EMA (Black Line). This indicates that a medium-term downtrend is forming. The price being below both moving averages indicates that the price may continue to decline en the short term. Chaikin Money Flow (CMF-20) has fallen into negative territory. Additionally, the decrease en cash inflows could pull the CMF deeper into negative territory. The Relative Strength Index (RSI-14) retreated from the neutral level en the negative zone, falling back to the middle zone. It also remained below the downward trend line that began el February 3. A break above this level could trigger buying pressure. In the event of an uptrend driven por political developments, macroeconomic data, or positive news flow en the DOGE ecosystem, the $0.11797 level stands out as a strong resistance zone. Conversely, en the event of negative news flow, the $0.08090 level could be triggered. A decline to these levels could increase momentum and initiate a new wave of growth.
Supports: 0.09071 – 0.08444 – 0.08090
Resistances: 0.09451 – 0.09962 – 0.10442
Legal Notice
The investment information, comments, and recommendations contained herein do not constitute investment advice. Investment advisory services are provided individually por authorized institutions taking into account the risk and return preferences of individuals. The comments and recommendations contained herein are of a general nature. These recommendations may not be suitable for your financial situation and risk and return preferences. Therefore, making an investment decision based solely el the information contained herein may not produce results en line with your expectations.

