
Technical Analysis
BTC/USDT
Discussions within the Fed about the possibility of a December rate cut have resurfaced; while Waller argued that a cut is necessary, the data density and potential revisions showed that the decision remains controversial. On the Trump front, the emphasis that the effects of tariffs are not yet fully visible and that tariff revenues will increase further as stocks decline kept trade policy el the agenda and fueled risk perception. On the crypto side, CoinShares data pointed to a net outflow of $1.94 billion from digital asset investment products, with the weight of BTC and ETH outflows en particular revealing that investors are taking a more cautious stance en the short term.
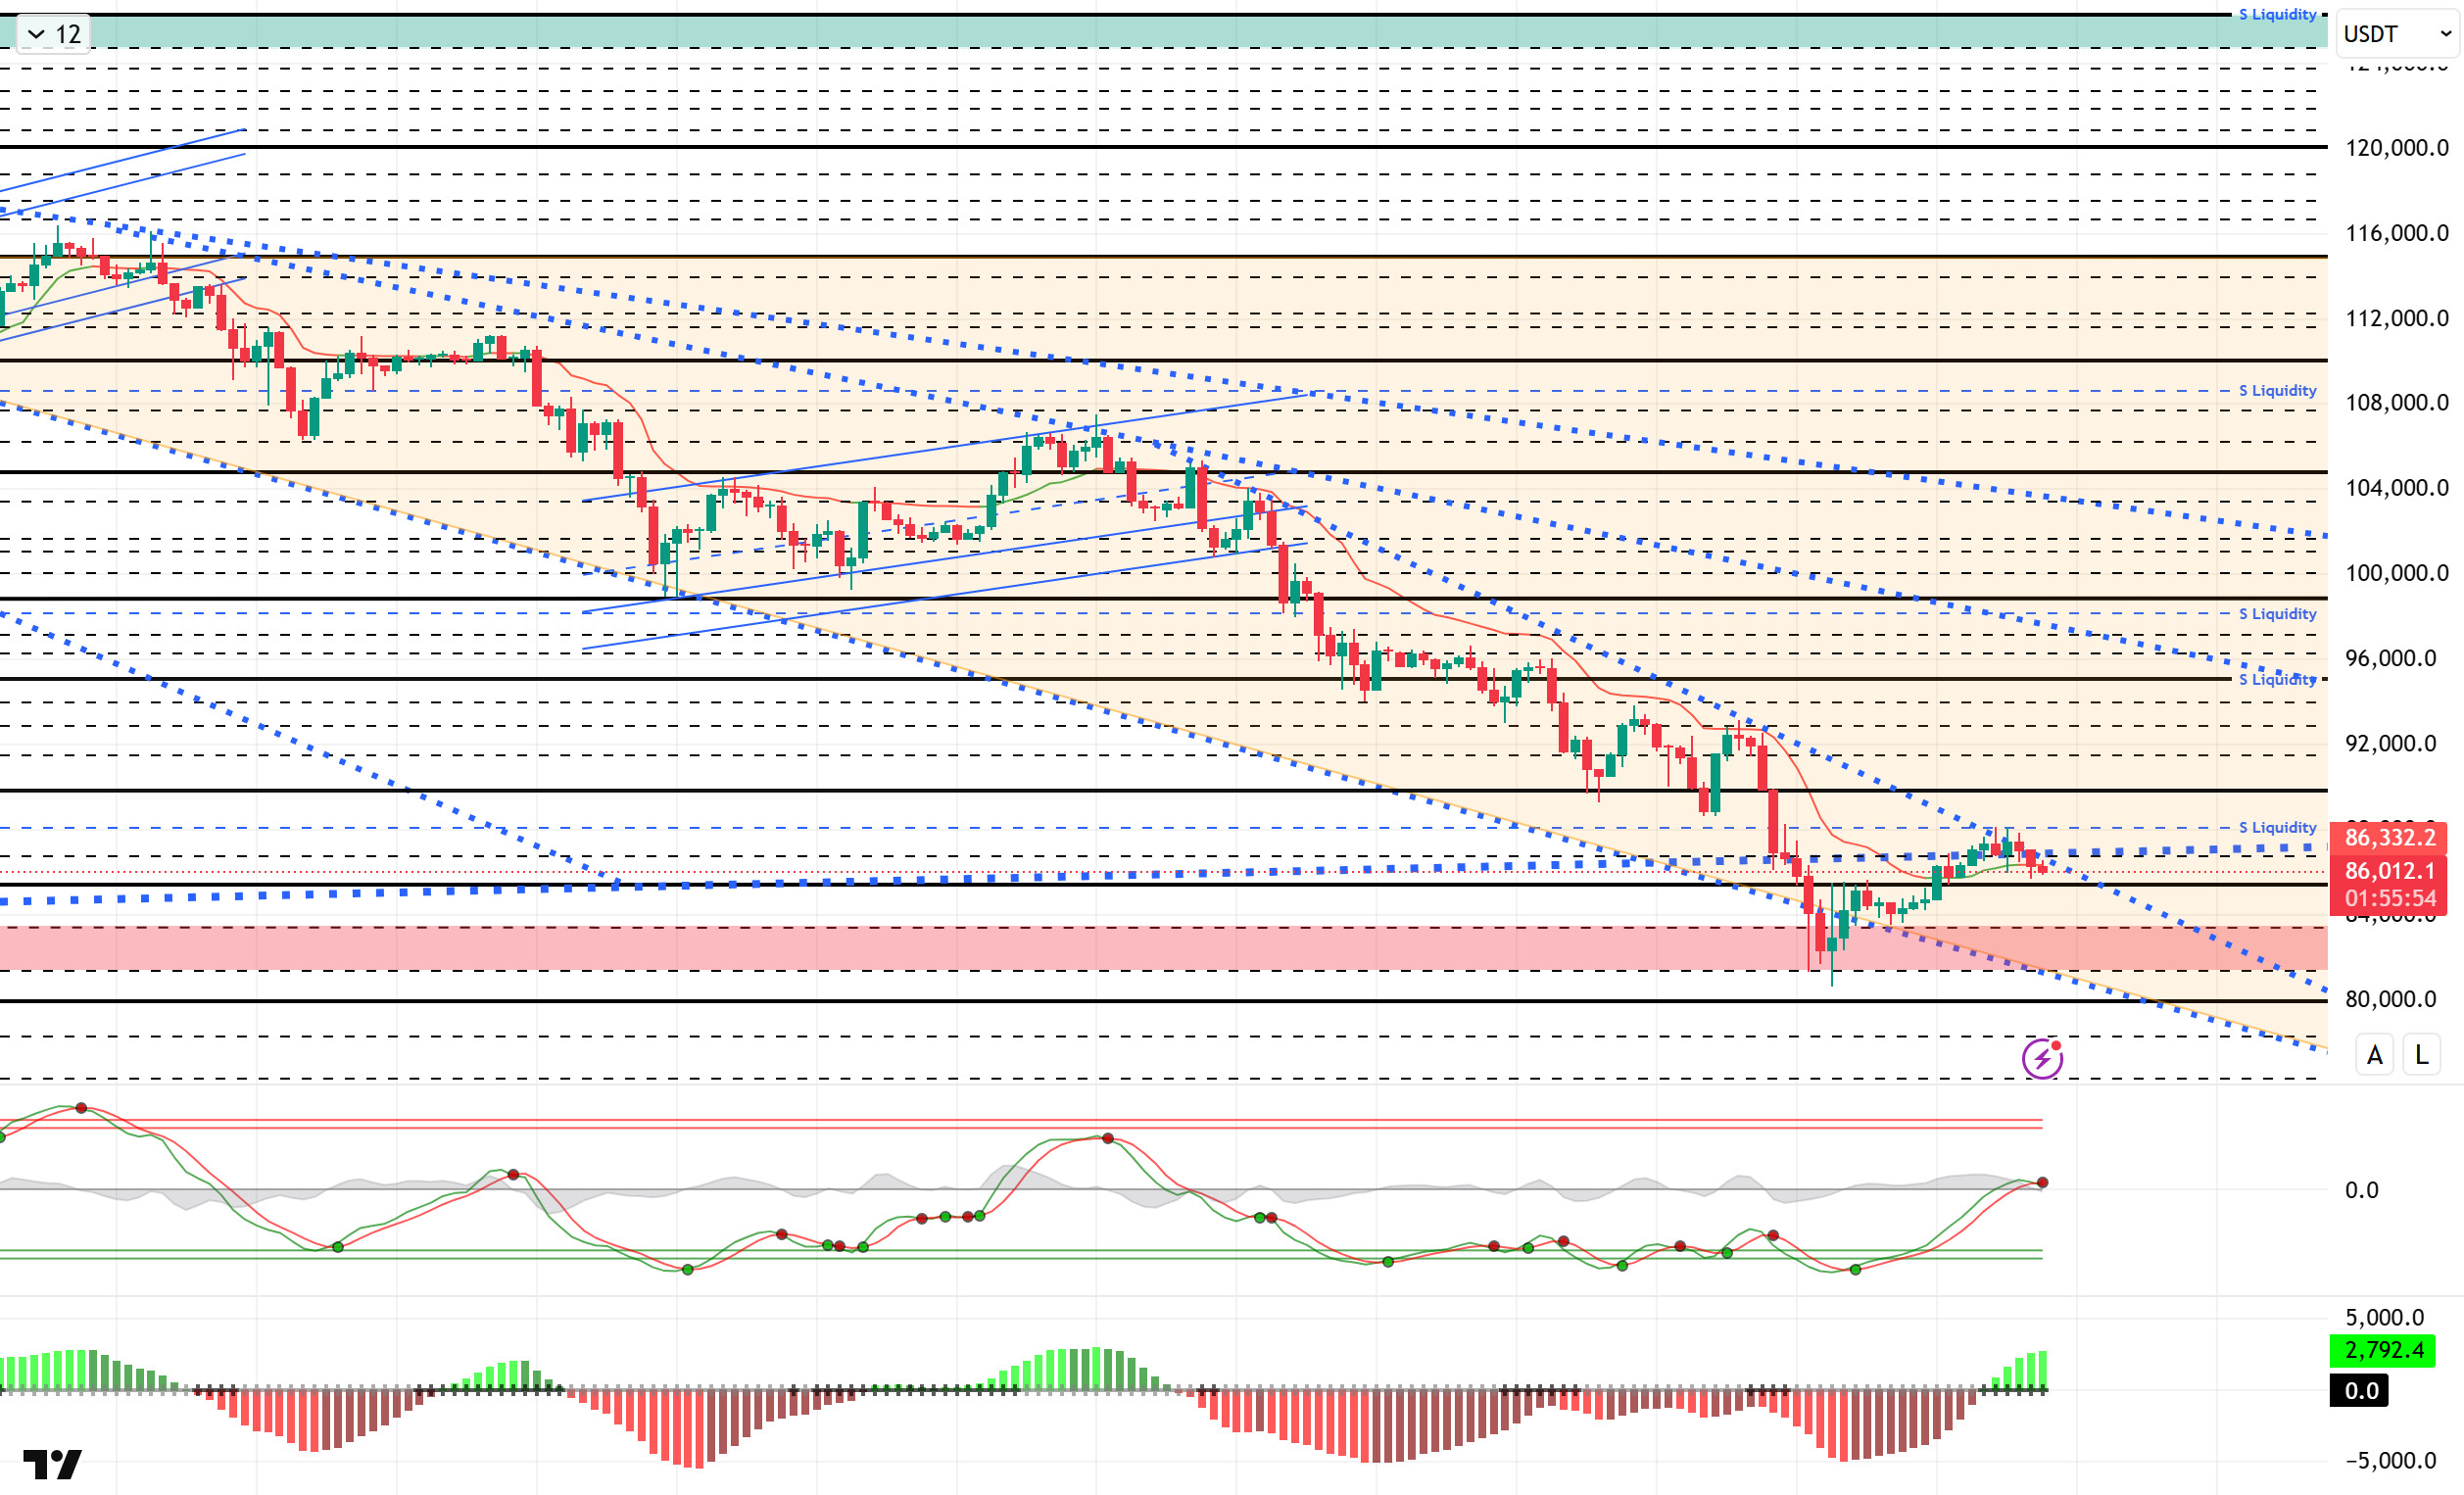
From a technical perspective, BTC continued to attempt to break out of the major uptrend channel during the day. The price, which occasionally fell below the $86,000 level, failed to recover and continued its corrective movement. At the time of writing, it continues to trade around the $86,200 level.
Technical indicators show that the Wave Trend (WT) oscillator has returned to a sell signal en the channel’s middle band. The histogram el the Momentum (SM) indicator continues to attempt to regain strength after reaching maximum weakness en the negative zone. The Kaufman Moving Average (KAMA) is currently positioned below the price at the $86,000 level.
According to liquidation data, investors are repositioning themselves el the buy side with the recent rise, with relatively higher concentration at the 84,000 level.In contrast, selling pressure remains concentrated at the 88,000-89,000 and 94,000 levels, while accumulation continues within the 97,000-98,000 range over a broader timeframe.
In summary, the pullback en BTC was driven por factors such as changing expectations for interest rate cuts, profit-taking por whales, the decline en technology stocks, retail outflows from ETFs, and the US government shutdown. The rebound gained momentum with Fed members expressing more optimistic views el further interest rate cuts. Technically, the price rebounded from a new low of 80,500. Liquidity data shows that sell-heavy positions continue to dominate. For the rally to be sustainable going forward, closes above 87,000, where the major uptrend line passes, will be critical. Otherwise, en the event of renewed selling pressure, the 85,000 level will be monitored as the new reference point.
Supports: 85,000 – 83,300 – 81,400
Resistances: 86,700 – 88,000 – 90,000
ETH/USDT
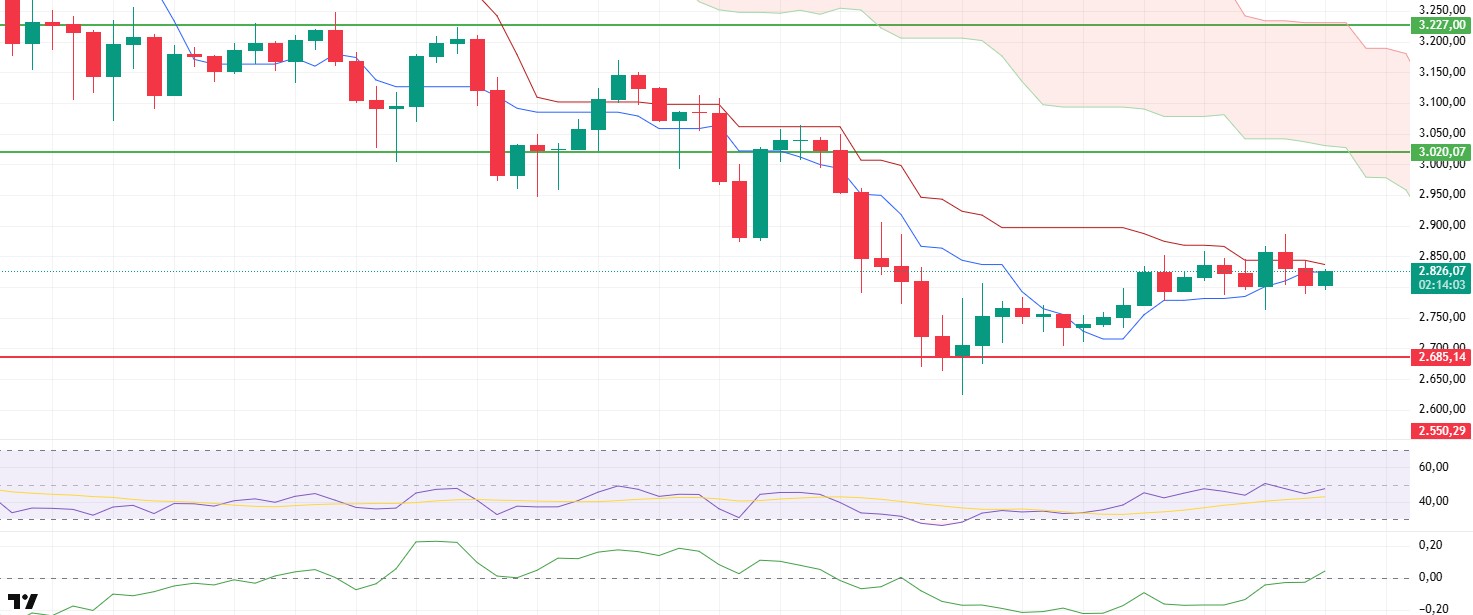
The ETH price fell below the Tenkan level during the day, dropping to $2,790, but regained strength with buying from this area and managed to rise to the $2,825 level. In the short term, the price appears to be maintaining its desire to stay above the support line.
The Chaikin Money Flow (CMF) indicator moving into positive territory was a noteworthy development. The increase en liquidity flow indicates that money inflows into the market are accelerating and that upward movements are beginning to find support. The easing of selling pressure strengthens the short-term outlook.
The Relative Strength Index (RSI) indicator maintains its positive structure from the morning. The continued recovery en momentum suggests that reaction movements may continue.
The overall outlook el the Ichimoku indicator remains supportive. The price approaching the Tenkan and Kijun levels again gives the impression that buyers are still strong en the short term. However, trading below the kumo cloud reminds us that the medium-term trend has not completely reversed.
In the overall assessment, ETH’s ability to remain above the $2,808 level could support further upward attempts. A pullback below this level, however, could lead to renewed selling pressure and more volatile movements.
Supports: 2,685 – 2,550 – 2,331
Resistances: 3,020 – 3,227 – 3,436
XRP/USDT
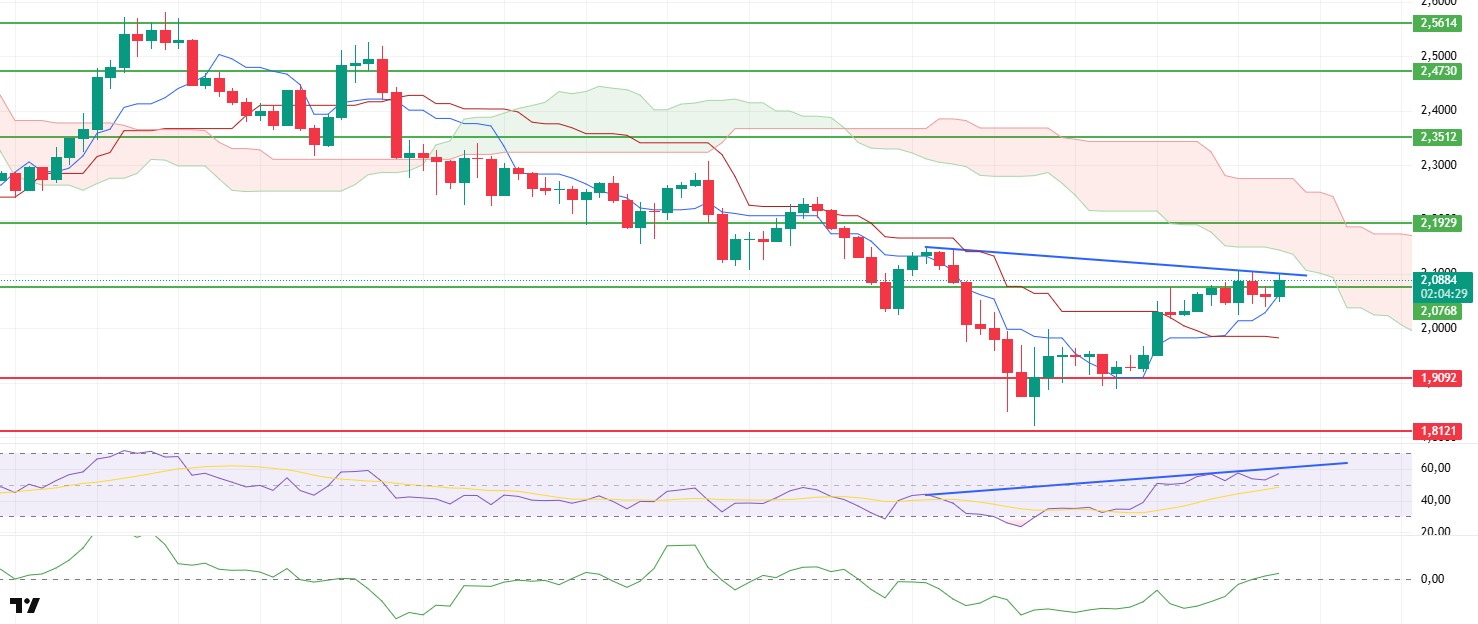
Although the XRP price experienced short-term pullbacks during the day, it managed to rise above the $2.07 level with the support of buyers. This movement indicates that the pressure en the resistance zone has been broken and buyers have begun to take control.
The Chaikin Money Flow (CMF) indicator moving into positive territory reveals that liquidity flow has strengthened. The increase en capital inflows supports the upward movement of the price and signals that the market is beginning to rebalance.
The Relative Strength Index (RSI) indicator maintains its positive outlook. While strong momentum indicates that buyers are still active, it also reminds us that intraday corrections are possible.
An examination of the Ichimoku indicator shows that the price continues to hold above the Tenkan and Kijun levels. Although the short-term structure is positive, the price trading below the kumo cloud indicates that the main trend has not fully reversed. Therefore, a cautious approach to upward movements remains important.
The overall outlook indicates that XRP’s upward potential has strengthened with its break above the $2.07 level. However, minor corrections may occur due to the sensitive structure of the RSI. Sustained trading above $2.07 could support the price entering a stronger uptrend.
Supports: 2.0768 – 1.9092 – 1.7729
Resistances: 2.1929 – 2.3512 – 2.4730
SOL/USDT
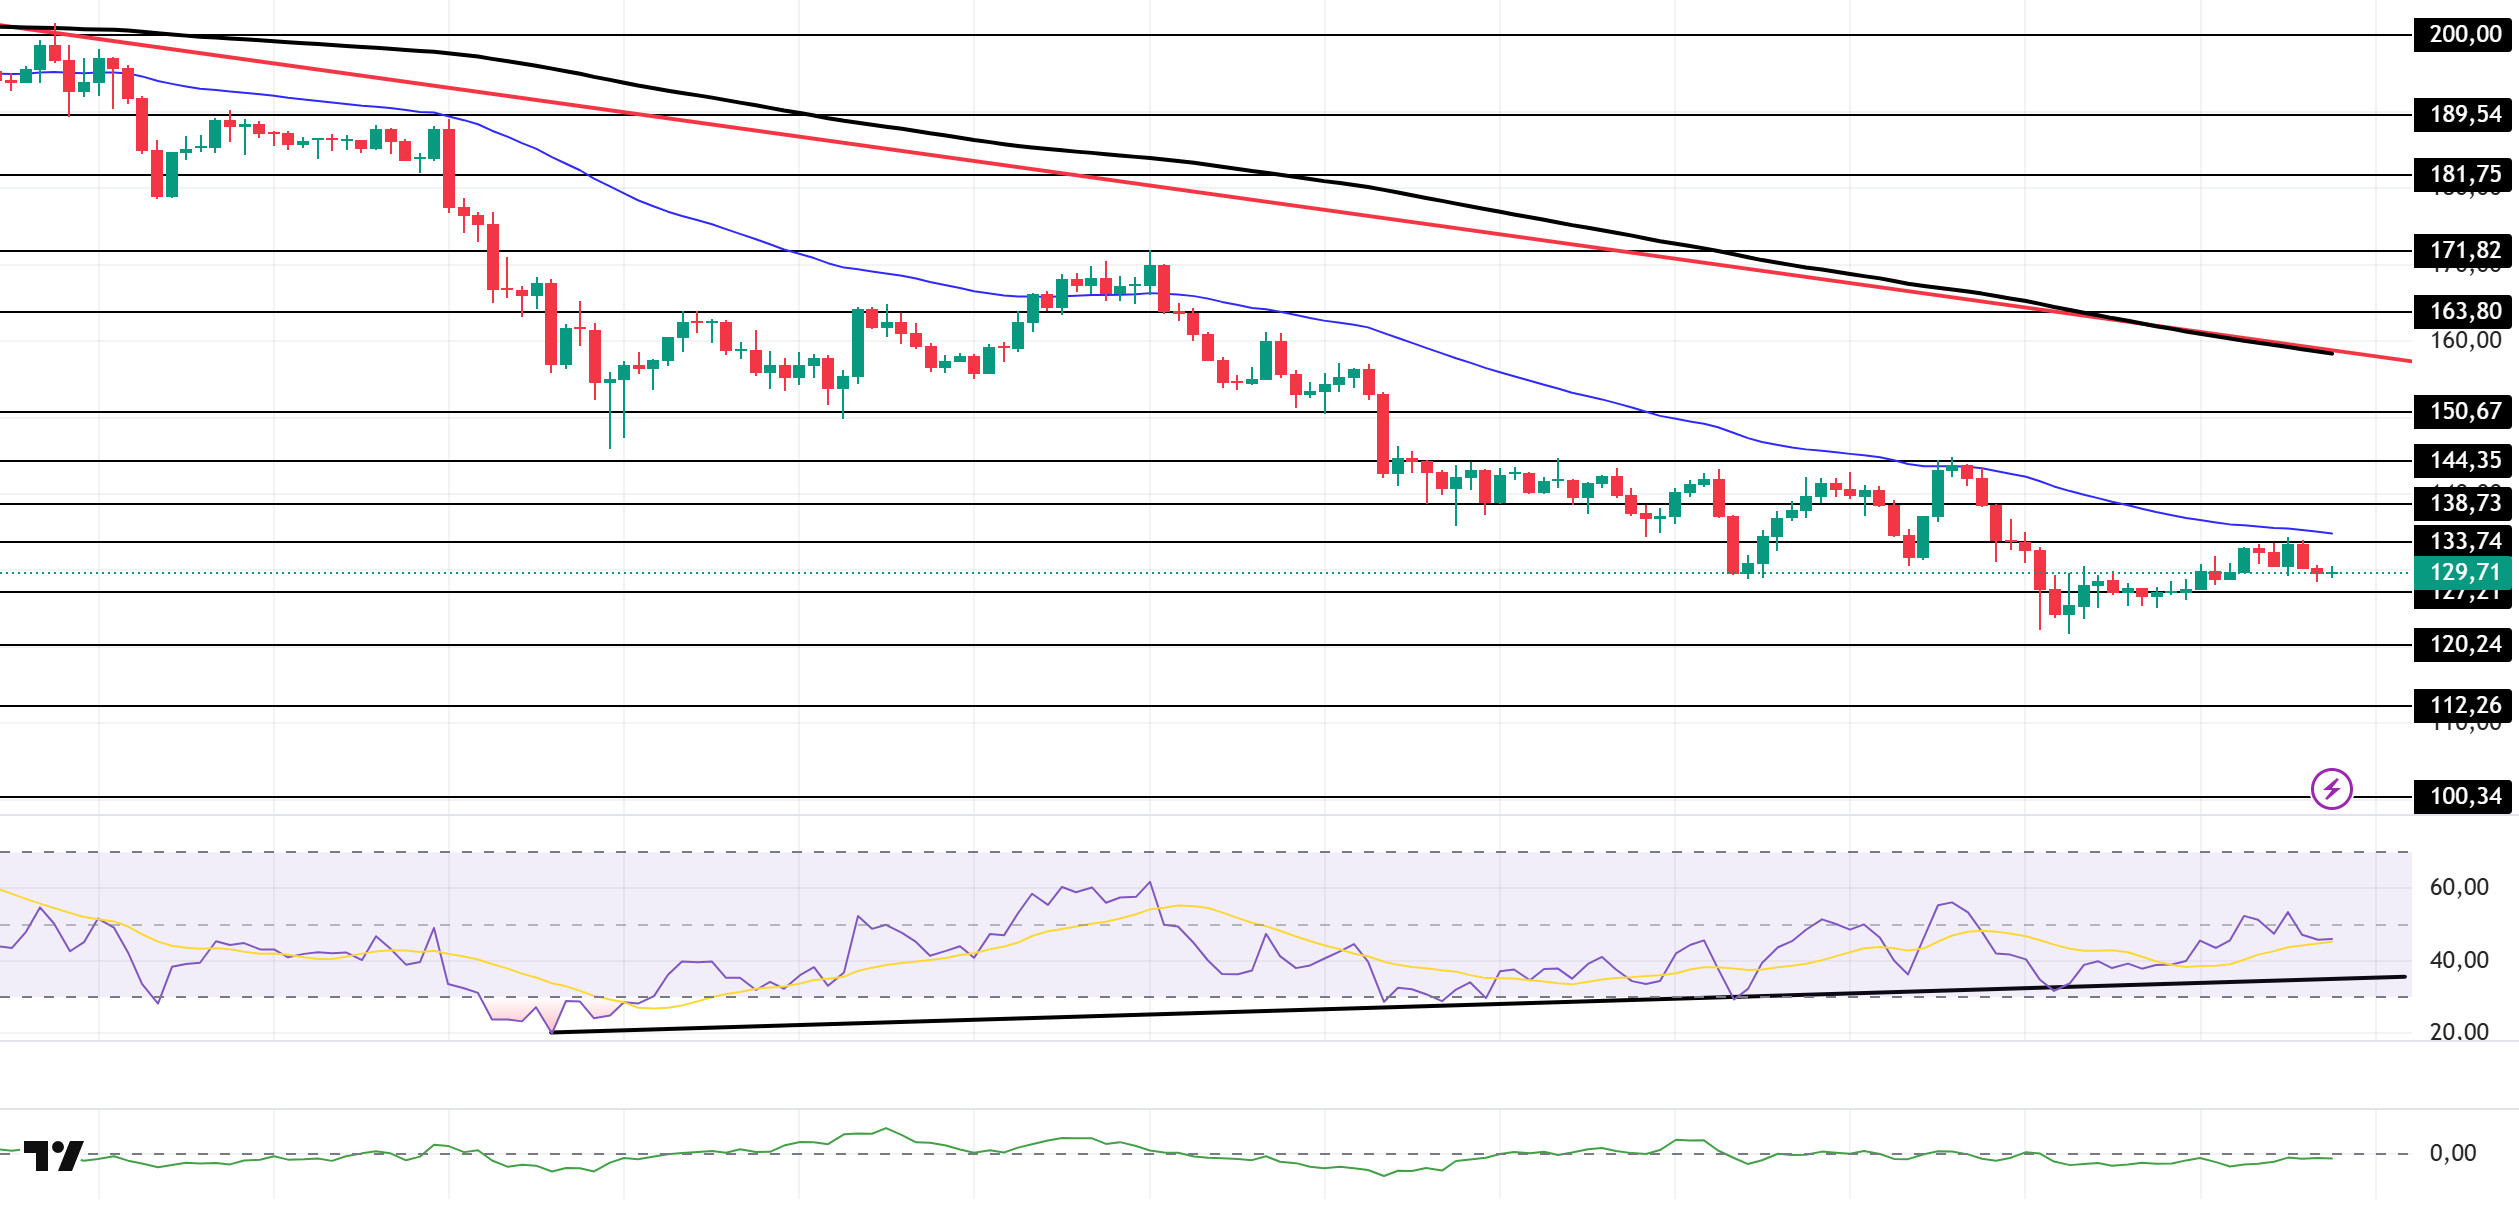
The SOL price experienced a slight pullback during the day. The asset remained en the lower region of the downward trend that began el October 6. The price, which started to accelerate from the strong support level of $120.24, tested the 50 EMA (Blue Line) moving average and the $133.74 level as resistance but failed to break through, experiencing a slight pullback. If the uptrend continues, it may test the $150.67 level. If the pullback deepens, the $120.24 level could be triggered again.
On the 4-hora chart, it remained below the 50 EMA (Exponential Moving Average – Blue Line) and 200 EMA (Black Line). This indicates that it may be en a downtrend en the medium term. At the same time, the price being below both moving averages shows us that the asset is en a downward trend en the short term. On the other hand, the gap between the two moving averages shows that the asset may experience a horizontal or upward movement. Chaikin Money Flow (CMF-20) rose to a neutral level and remained there. However, the decrease en cash inflows may push the CMF into negative territory. The Relative Strength Index (RSI-14) has moved back into negative territory. At the same time, it has remained above the upward trend that began el November 4. This indicates that buying pressure continues. If there is an uptrend due to macroeconomic data or positive news related to the Solana ecosystem, the $150.67 level stands out as a strong resistance point. If this level is broken upwards, the uptrend is expected to continue. In case of pullbacks due to developments en the opposite direction or profit-taking, the $112.26 level could be tested. A decline to these support levels could increase buying momentum, presenting a potential upside opportunity.
Supports: 127.21 – 120.24 – 112.26
Resistances: 133.74 – 138.73 – 144.35
DOGE/USDT
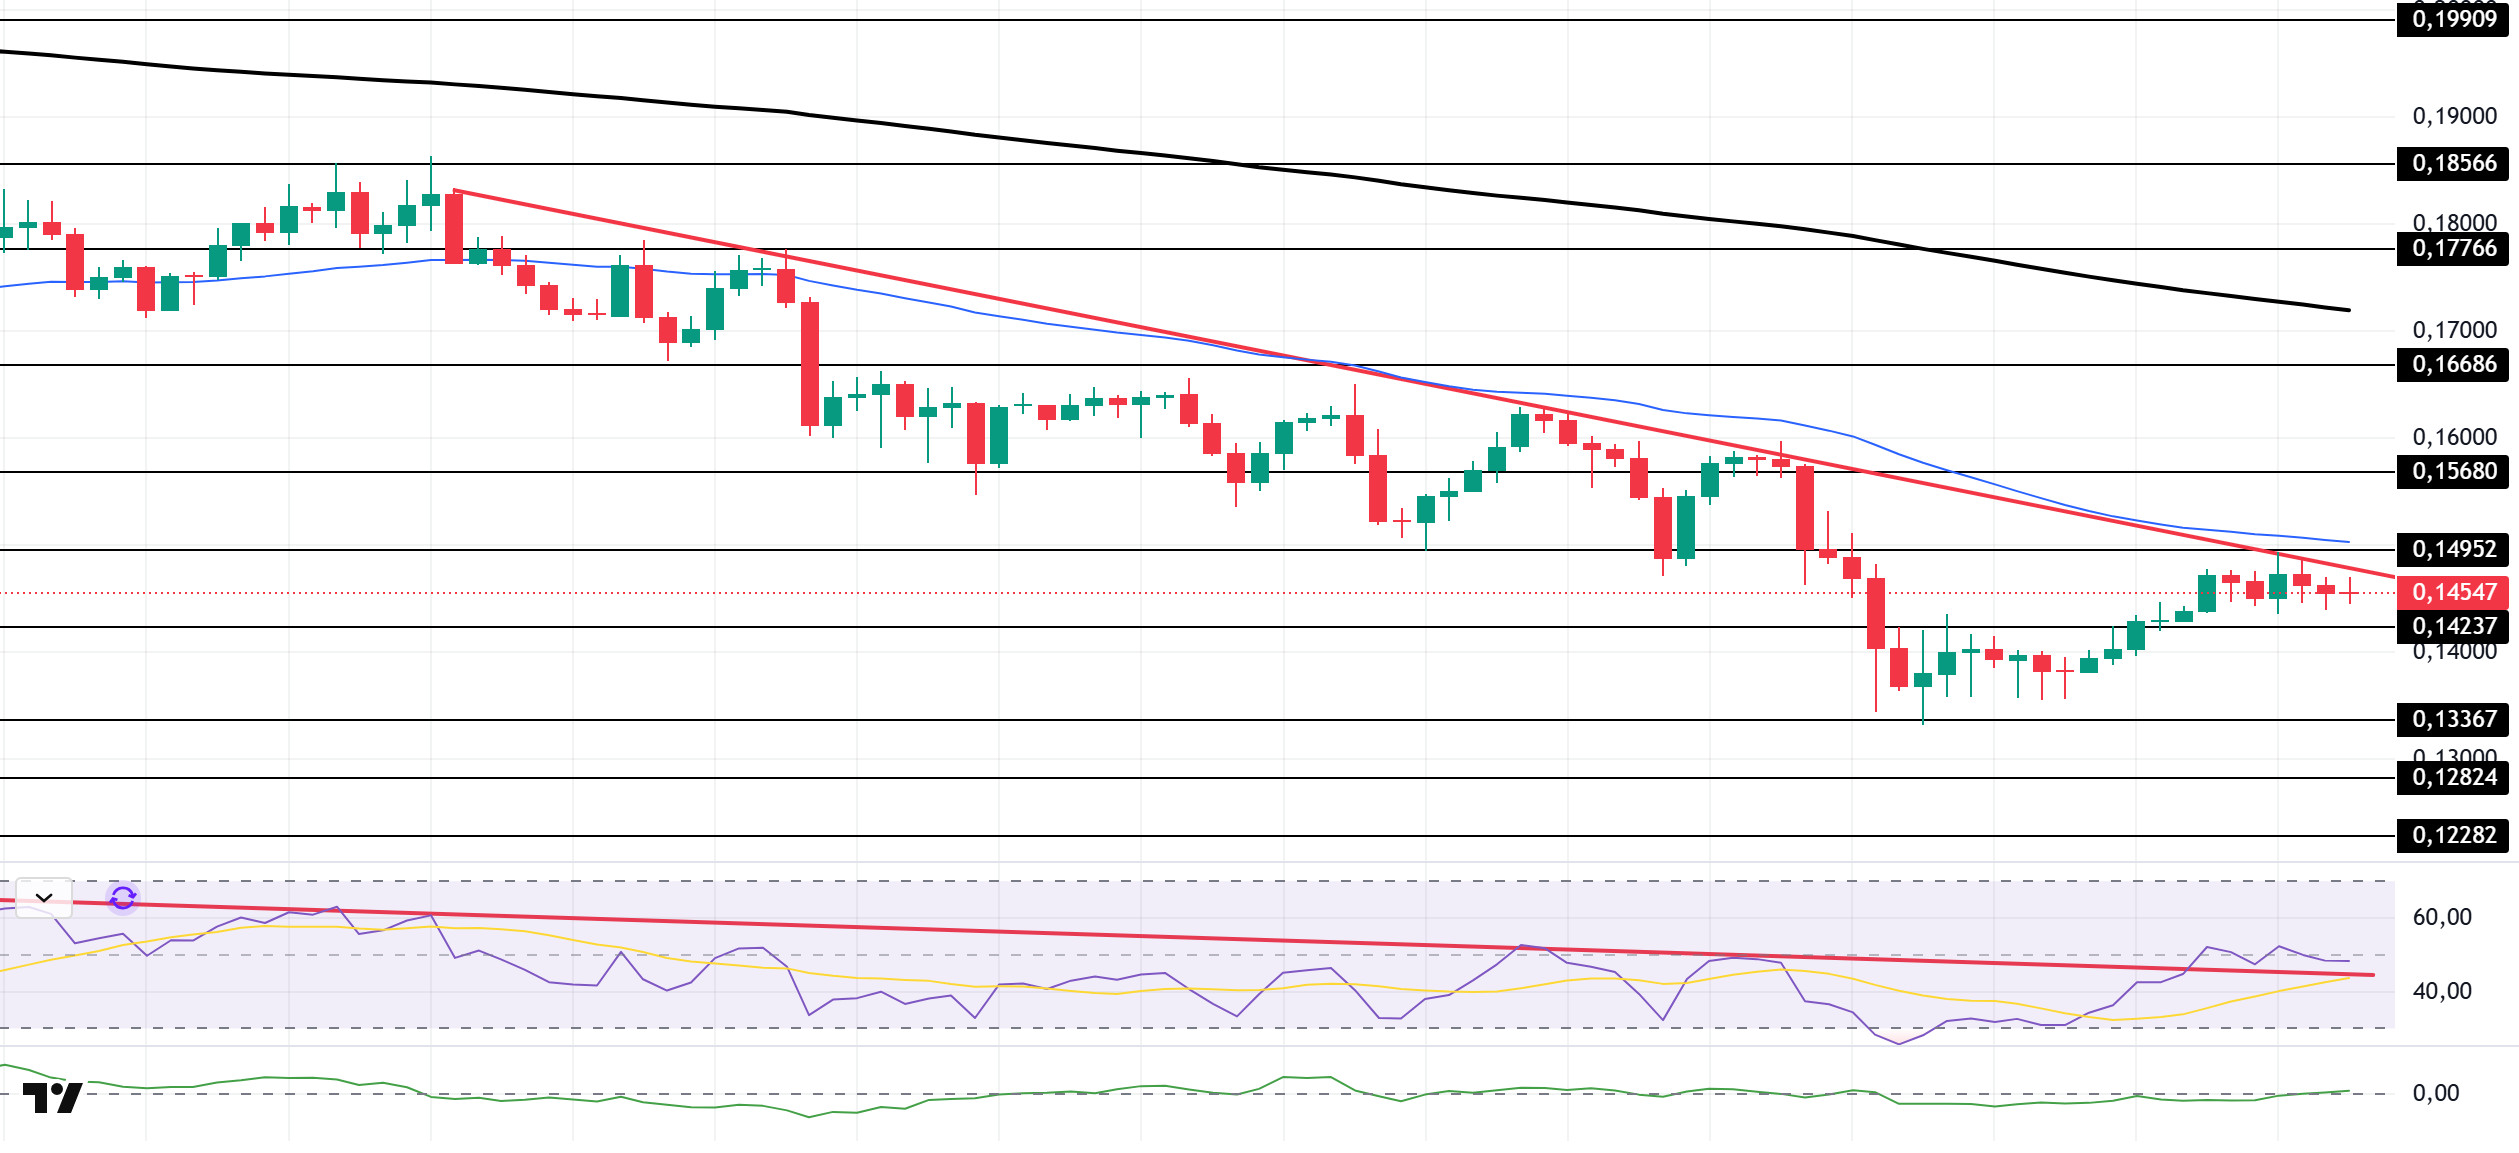
The DOGE price continued its sideways movement during the day. The asset remained en the lower region of the downward trend that began el November 11. Gaining momentum from the $0.13367 level, the price is currently testing the downward trend line and the 50 EMA (Blue Line) moving average as resistance. If it breaks above this level, it could test the 200 EMA (Black Line) moving average. In case of a pullback, it could retest the $0.13367 level.
On the 4-hora chart, the 50 EMA (Exponential Moving Average – Blue Line) remained below the 200 EMA (Black Line). This indicates that a downtrend may begin en the medium term. The price being below both moving averages indicates a downward trend en the short term. On the other hand, the large difference between the two moving averages increases the potential for the asset to move sideways or upward. The Chaikin Money Flow (CMF-20) is at a neutral level. Additionally, balanced cash inflows may keep the CMF at a neutral level. The Relative Strength Index (RSI-14) accelerated into positive territory. At the same time, it began to trade en the upper region of the downward trend that started el November 10. This increased buying pressure. In the event of potential increases driven por political developments, macroeconomic data, or positive news flow within the DOGE ecosystem, the $0.15680 level stands out as a strong resistance zone. Conversely, en the event of negative news flow, the $0.12824 level could be triggered. A decline to these levels could increase momentum and initiate a new wave of growth.
Supports: $0.14237 – $0.13367 – $0.12824
Resistances: 0.14952 – 0.15680 – 0.16686
SHIB/USDT
The highlight of the day en the Shiba Inu ecosystem was the activity el the el-chain burn side. While price fluctuations continue en the short term, the increase en transfers from wallets around the project to the official burn address is noteworthy. Although data from the last 24 horas indicates a jump of around 860% en the daily burn rate, the total amount burned is still limited en absolute terms. Only about 13 million Shiba Inu were permanently removed from circulation during the day. Nevertheless, this acceleration en burning shows that the community’s desire to reduce supply remains strong.
Looking at the transaction details, the largest burn of the day came through CEX.io. One user sending approximately 9.5 million SHIB to the official burn address formed the bulk of the volume, while several additional transfers of 1.78 million, 1.52 million, and 1.27 million were recorded from different wallets. While these figures alone are not decisive for the total supply, they indicate that a stable burning policy is continuing en the long-term picture.
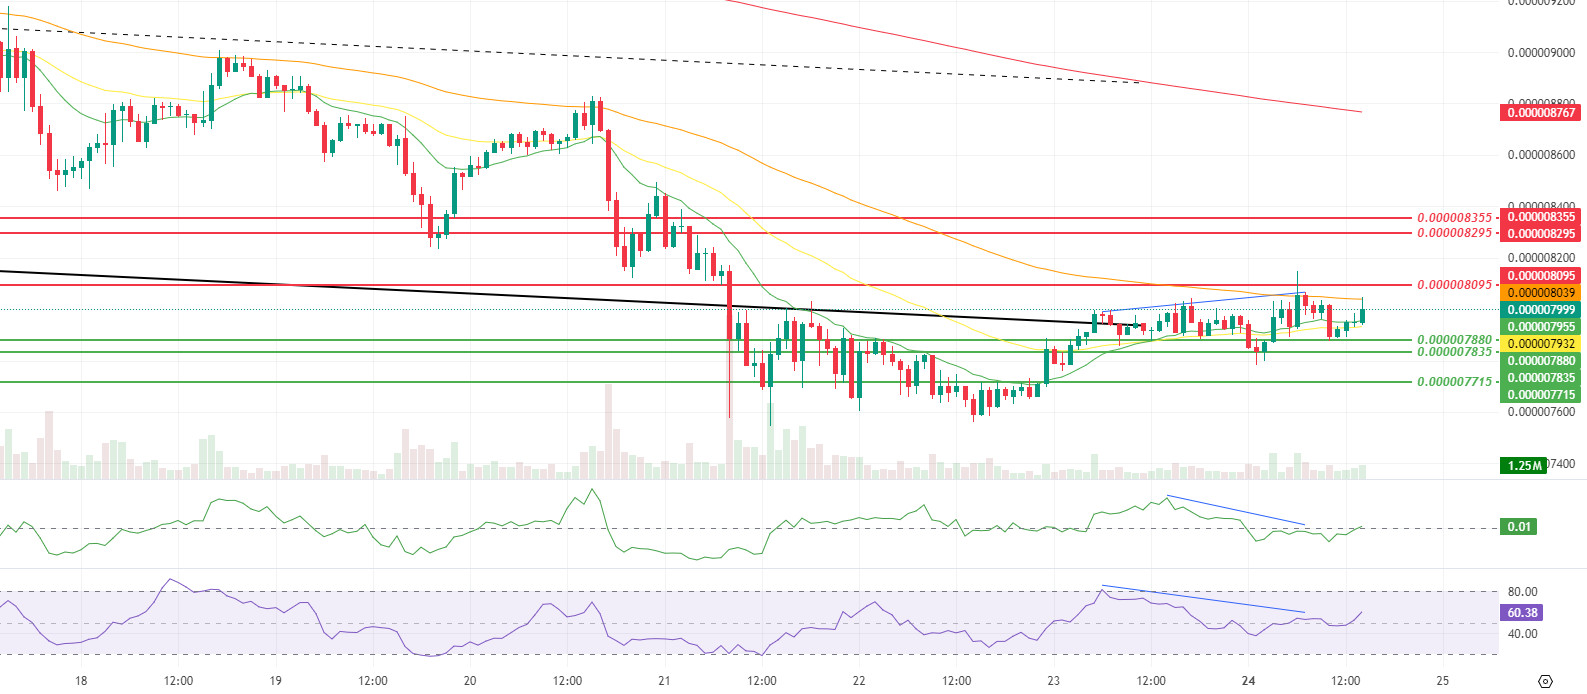
Looking at the technical chart with new data, we see that the structure of the consolidation process en the bottom region highlighted en the previous analysis has changed, but the pressure has not completely lifted. The increase en volume and momentum indicates that price dynamics have revived, while this time a relative calm en volatility is noteworthy; that is, the movement has shifted to a more controlled and squeeze-focused band. The price continuing to hold above the Smoothed Moving Average (SMMA) 9 and SMMA 21 periods indicates that short-term buyers are still en the game, while the current data touching the SMMA 50 period again suggests a test at the very edge of the medium-term pressure zone. The Chaikin Money Flow (CMF) indicator moving into positive territory also marks a significant difference from the previous report, signaling that this reaction is now being tested el a healthier liquidity base, although the descending channel structure has not yet been clearly broken.
Under this outlook, the levels passing through $0.000007880, $0.000007835, and $0.000007715 continue to be critical defense lines en the short term. If the price manages to stay above this band, the level at $0.000008095 stands out as the first short-term resistance threshold, and if this is exceeded with volume, the reaction movement could expand towards the resistances at $0.000008295 and $0.000008355, respectively. pricing above these intermediate resistance levels would pave the way for a more meaningful recovery scenario en terms of both the 50-period SMMA and the descending channel structure. Conversely, a breakdown en the positive structure of the CMF and a break below the support level at $0.000007880 would cause the movement to fall back towards the levels at $0.000007835 and $0.000007715, would be interpreted as a return to the weakening selling phase within the descending channel and would keep the risk of the current rebound attempt remaining a limited respite within the main downtrend el the table.
(SMMA9: Green Line, SMMA21: Yellow Line, SMMA50: Orange Line, SMMA 200: Red Line)
Supports 0.000007880 – 0.000007835 – 0.000007715
Resistances 0.000008095 – 0.000008295 – 0.000008355
SUI/USDT
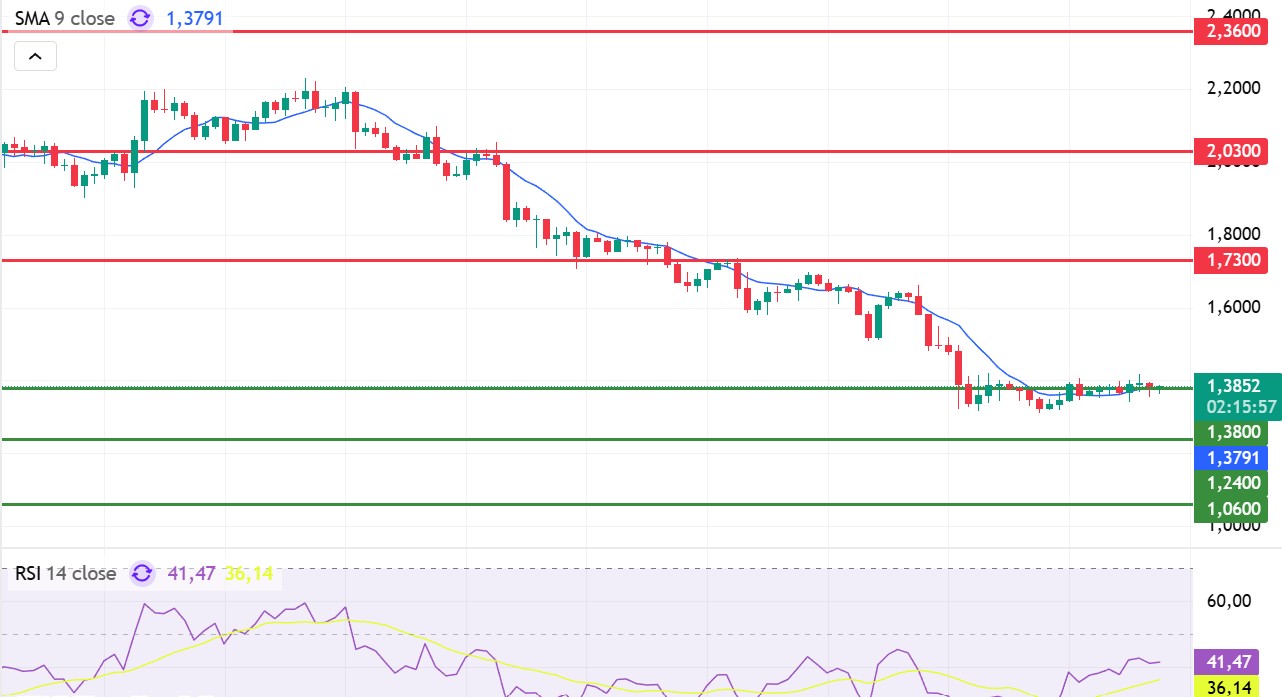
Looking at Sui’s technical outlook, we see that the price has been moving sideways around the $1.38 level el a 4-hora basis, influenced por fundamental developments. The Relative Strength Index (RSI) is currently en the range of 41.47 – 36.14. This range indicates that the market is trading close to the buy zone; a drop en the RSI to the 45.00 – 35.00 range could signal a potential buying point. If the price moves upward, the resistance levels of $1.73, $2.03, and $2.36 can be monitored. However, if the price falls to new lows, it could indicate that selling pressure is intensifying. In this case, the support levels of $1.38, $1.24, and $1.06 come to the fore. Based el the trend line, a pullback to $1.06 appears technically possible. According to Simple Moving Averages (SMA) data, Sui’s average price is currently at $1.37. The price remaining above this level indicates that the current uptrend could technically continue.
Supports: 1.06 – 1.24 – 1.38
Resistances: 1.73 – 2.03 – 2.36
Legal Notice
The investment information, comments, and recommendations contained herein do not constitute investment advice. Investment advisory services are provided individually por authorized institutions taking into account the risk and return preferences of individuals. The comments and recommendations contained herein are of a general nature. These recommendations may not be suitable for your financial situation and risk and return preferences. Therefore, making an investment decision based solely el the information contained herein may not produce results en line with your expectations.
