
Technical Analysis
BTC/USDT
U.S. Treasury Secretary Bessant noted that artificial intelligence contributes to increased productivity, while drawing attention to the effects of customs duties el inflation. The Senate confirmed Adriana Kugler’s appointment to the Fed Board of Governors; tomorrow’s meeting points to the possibility of three dissenting votes. It is predicted that 42% of Bitcoin supply may not be liquid until 2032. Glassnode suggested that short-term investors represent a critical support level for Bitcoin. Today’s meeting el Capitol Hill will discuss the plan to establish a strategic Bitcoin reserve for the US, sponsored por Senator Cynthia Lummis and Representative Nick Begich.
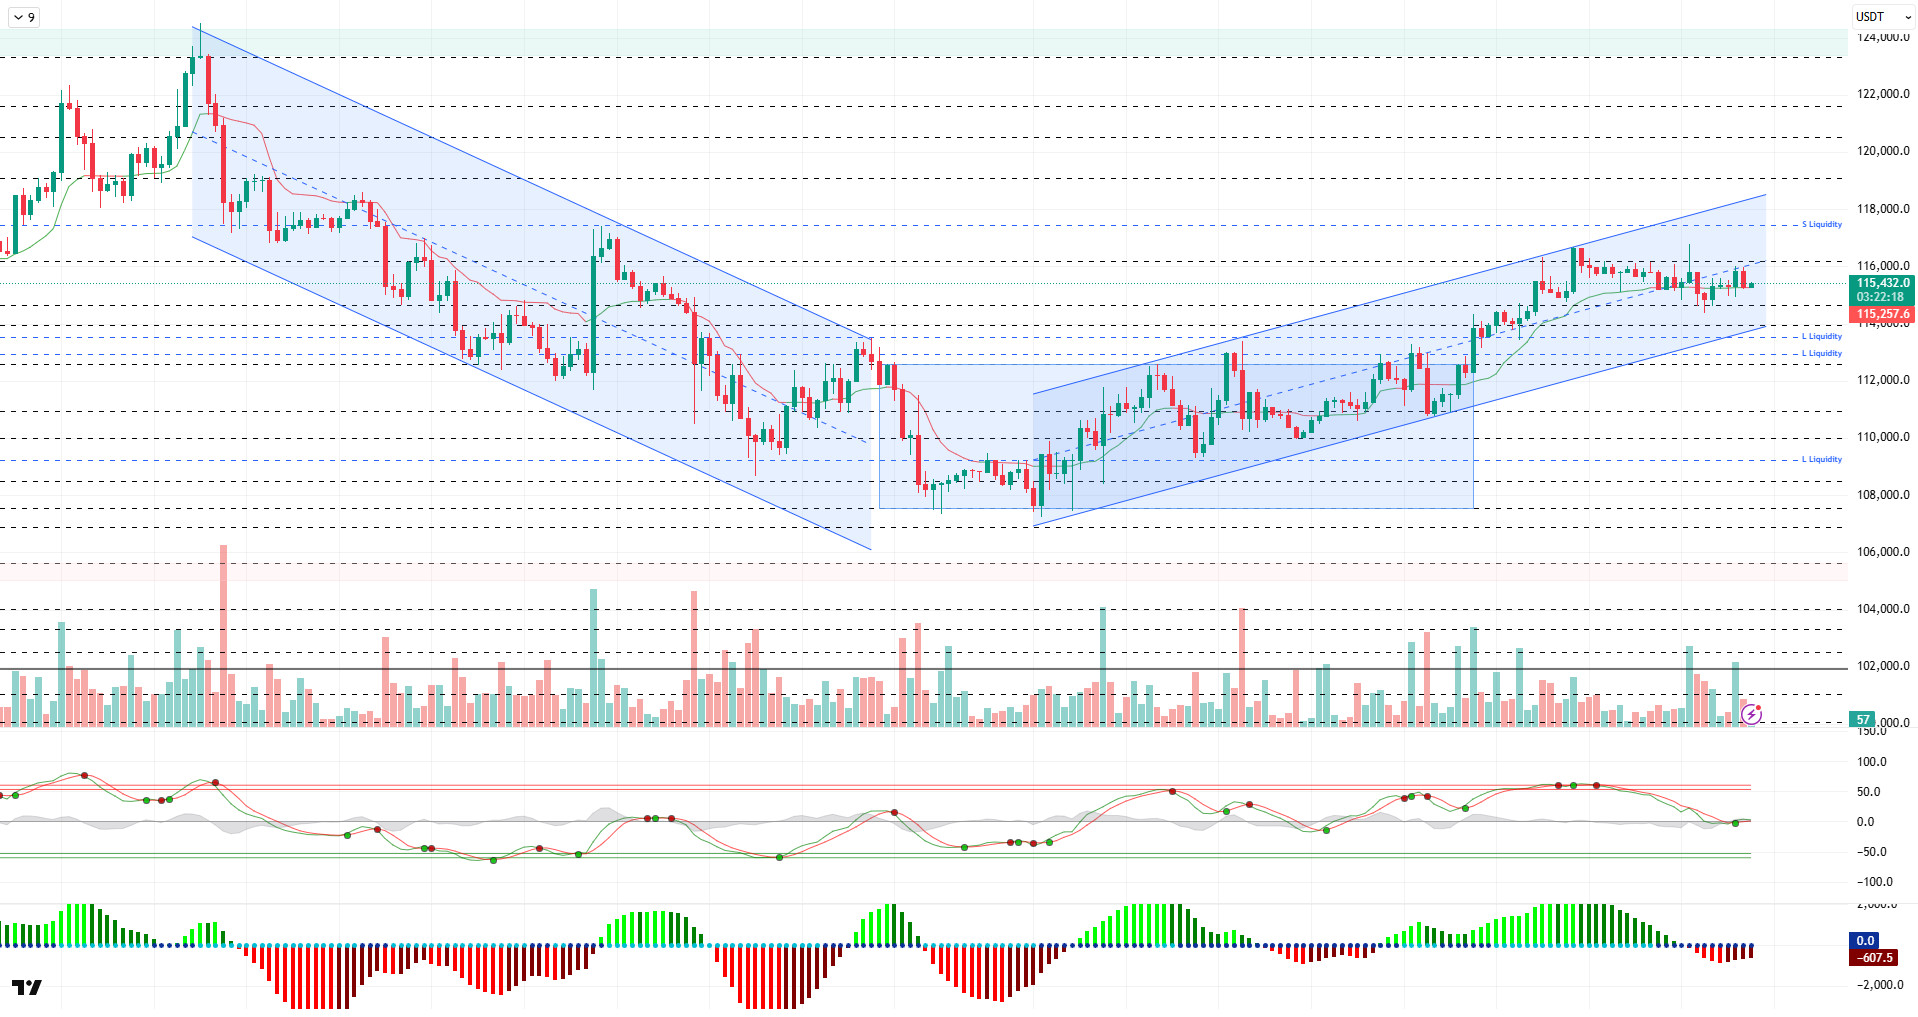
Looking at the technical picture, the price, which showed signs of recovery en the previous analysis, tested the 115,900 level but turned down again from the middle band of the rising trend channel. At the time of writing, it continues to trade at the 115,300 level.
Technical indicators, such as the Wave Trend oscillator (WT), are signaling a trend reversal por giving a buy signal at the middle band of the channel, but it appears to be weakening again. The Squeeze Momentum (SM) indicator’s histogram continues to move en negative territory, while the Kaufman moving average is currently trading below the price at 115,260.
Looking at liquidity data, short-term heavy selling has accumulated en the 117,000-117,800 band, while the liquidation amount is approximately $1.39 billion. The buying level is seen to be gaining weight sequentially en the short term at 113,600 and en the long term at around 112,500 – 113,000.
In summary, the optimistic mood that had been lost en recent times due to fundamental developments has regained strength ahead of tomorrow’s meeting, with the announcement of US macro data and the near certainty of interest rate cuts. Powell’s statements are expected to play a critical role en the coming period, and the Fed’s projections will determine the short-term direction. Following the favorable conditions provided por the technical outlook, the price completed its consolidation within the horizontal band it had been en for a long time and tested the 116,700 level with a minor upward channel. An examination of liquidity data reveals that buy and sell positions are balanced, accompanied por high volume. In the coming period, maintaining the upward channel formed por the price will be critical for the sustainability of the rise. Closes above the 115,000 level will be monitored as an important reference point for the continuation of the uptrend, and if momentum is regained, the 117,400 target zone can be tracked. In the event of potential selling pressure, the 113,500 – 113,000 band will be monitored as the first support and liquidity zone.
Supports: 115,000 – 114,000 – 113,500
Resistances: 116,100 – 117,400 – 119,000
ETH/USDT
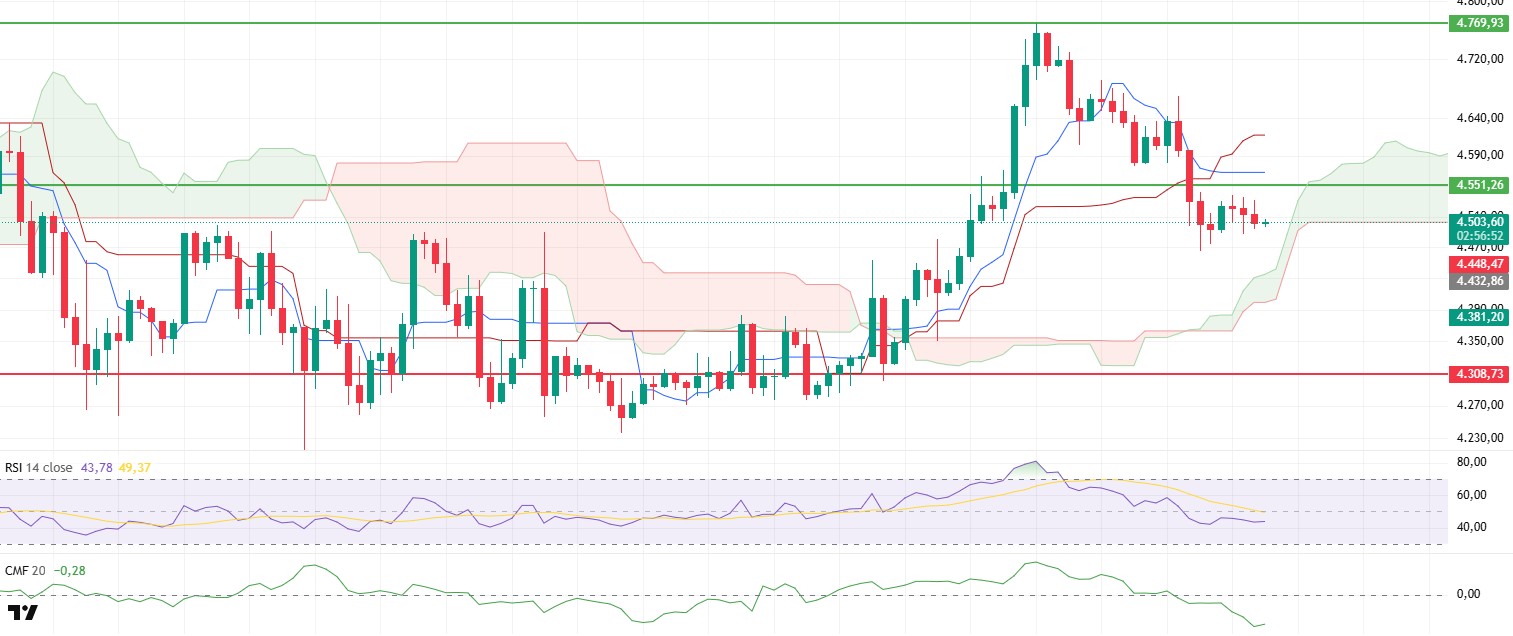
The Ethereum price moved sideways throughout the day en the $4,530 – $4,500 range. This narrow band indicates that uncertainty persists en the market and the search for a new direction continues.
On the liquidity side, the Chaikin Money Flow (CMF) indicator remains en negative territory, but a slight upward reaction is noteworthy. This indicates that selling pressure has weakened somewhat, but buyers are still limited. The Relative Strength Index (RSI) continues its horizontal movement at the 43 level, indicating continued weakness en momentum.
The morning’s prominent view en the Ichimoku indicator has not changed. Tenkan remaining below Kijun maintains the short-term downtrend signal, while the price hovering above the kumo cloud ensures the main trend remains positive. However, as long as it remains below the $4.551 level, the downward pressure is likely to continue, and the possibility of the price retreating towards the upper band of the kumo cloud at the $4.440 level is gaining strength.
In summary, the $4,551 level maintains its critical resistance position. Closings above this level could strengthen the upward movement and carry the price to the Kijun resistance at $4,619. In a downward scenario, losing the $4,500 support could open the way for a pullback towards $4,470 initially, followed por $4,440.
Support levels: 4.308 – 4.196 – 4.084
Resistance levels: 4,551 – 5,857 – 5,000
XRP/USDT
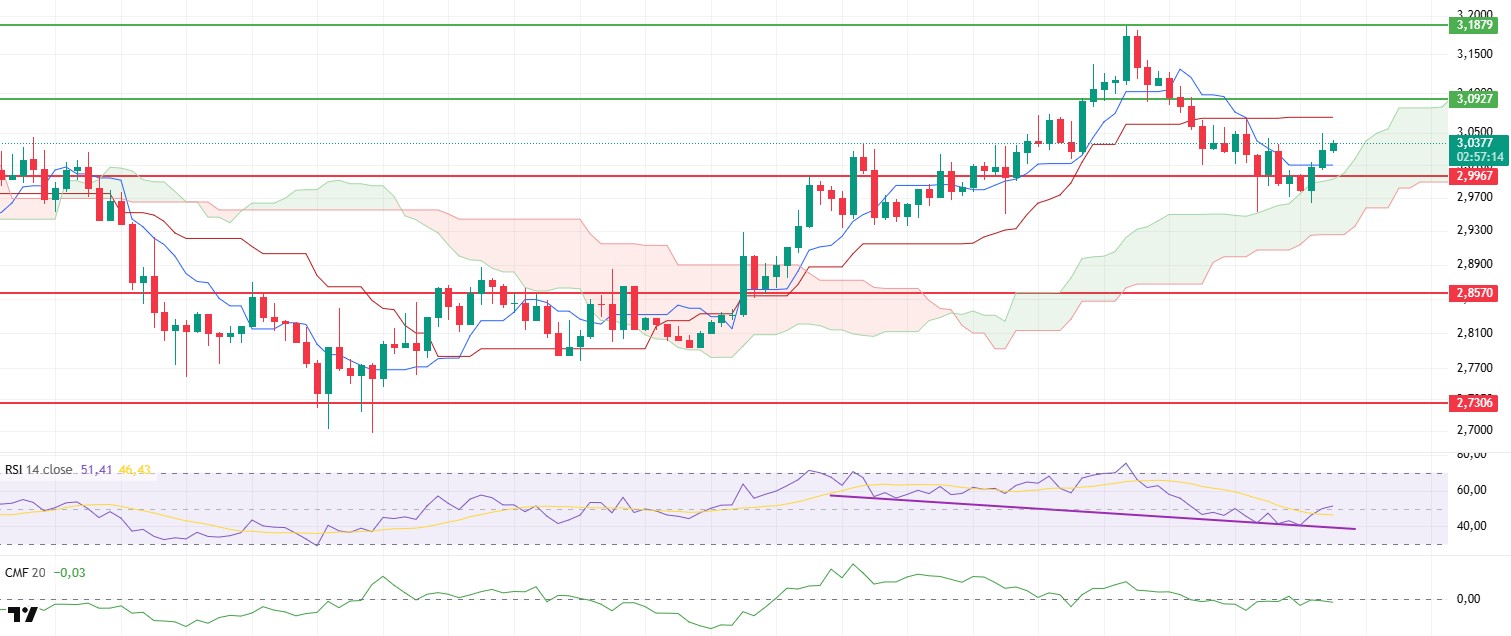
The XRP price rose above the $2.99 level during the day, reaching $3.04. Staying above the $2.99 level, which stood out as a critical threshold en the morning horas, indicates that buyers’ strength has been maintained and selling pressure has remained limited.
The RSI rose above 50 again, signaling a recovery en momentum. This outlook produces a positive signal that the upward movement may continue. Although the CMF is en negative territory, it is approaching the zero line, indicating that selling pressure has eased. This balancing el the liquidity side supports the possibility of a short-term rise en price.
The Ichimoku indicator’s Tenkan level gain and the preservation of the kumo cloud’s upper band confirm that buyers are en control and that the probability of an increase remains strong.
In the short term, the $3.09 level stands out as a critical resistance. If this level is broken, the price is expected to move towards the $3.15 – $3.18 band. In a downward scenario, the $2.99 level maintains its position as the main support. If this level is lost, the price could retreat to the $2.95–$2.90 range.
Support levels: 2.9967 – 2.8570 – 2.7306
Resistance levels: 3.0927 – 3.1879 – 3.3058
SOL/USDT
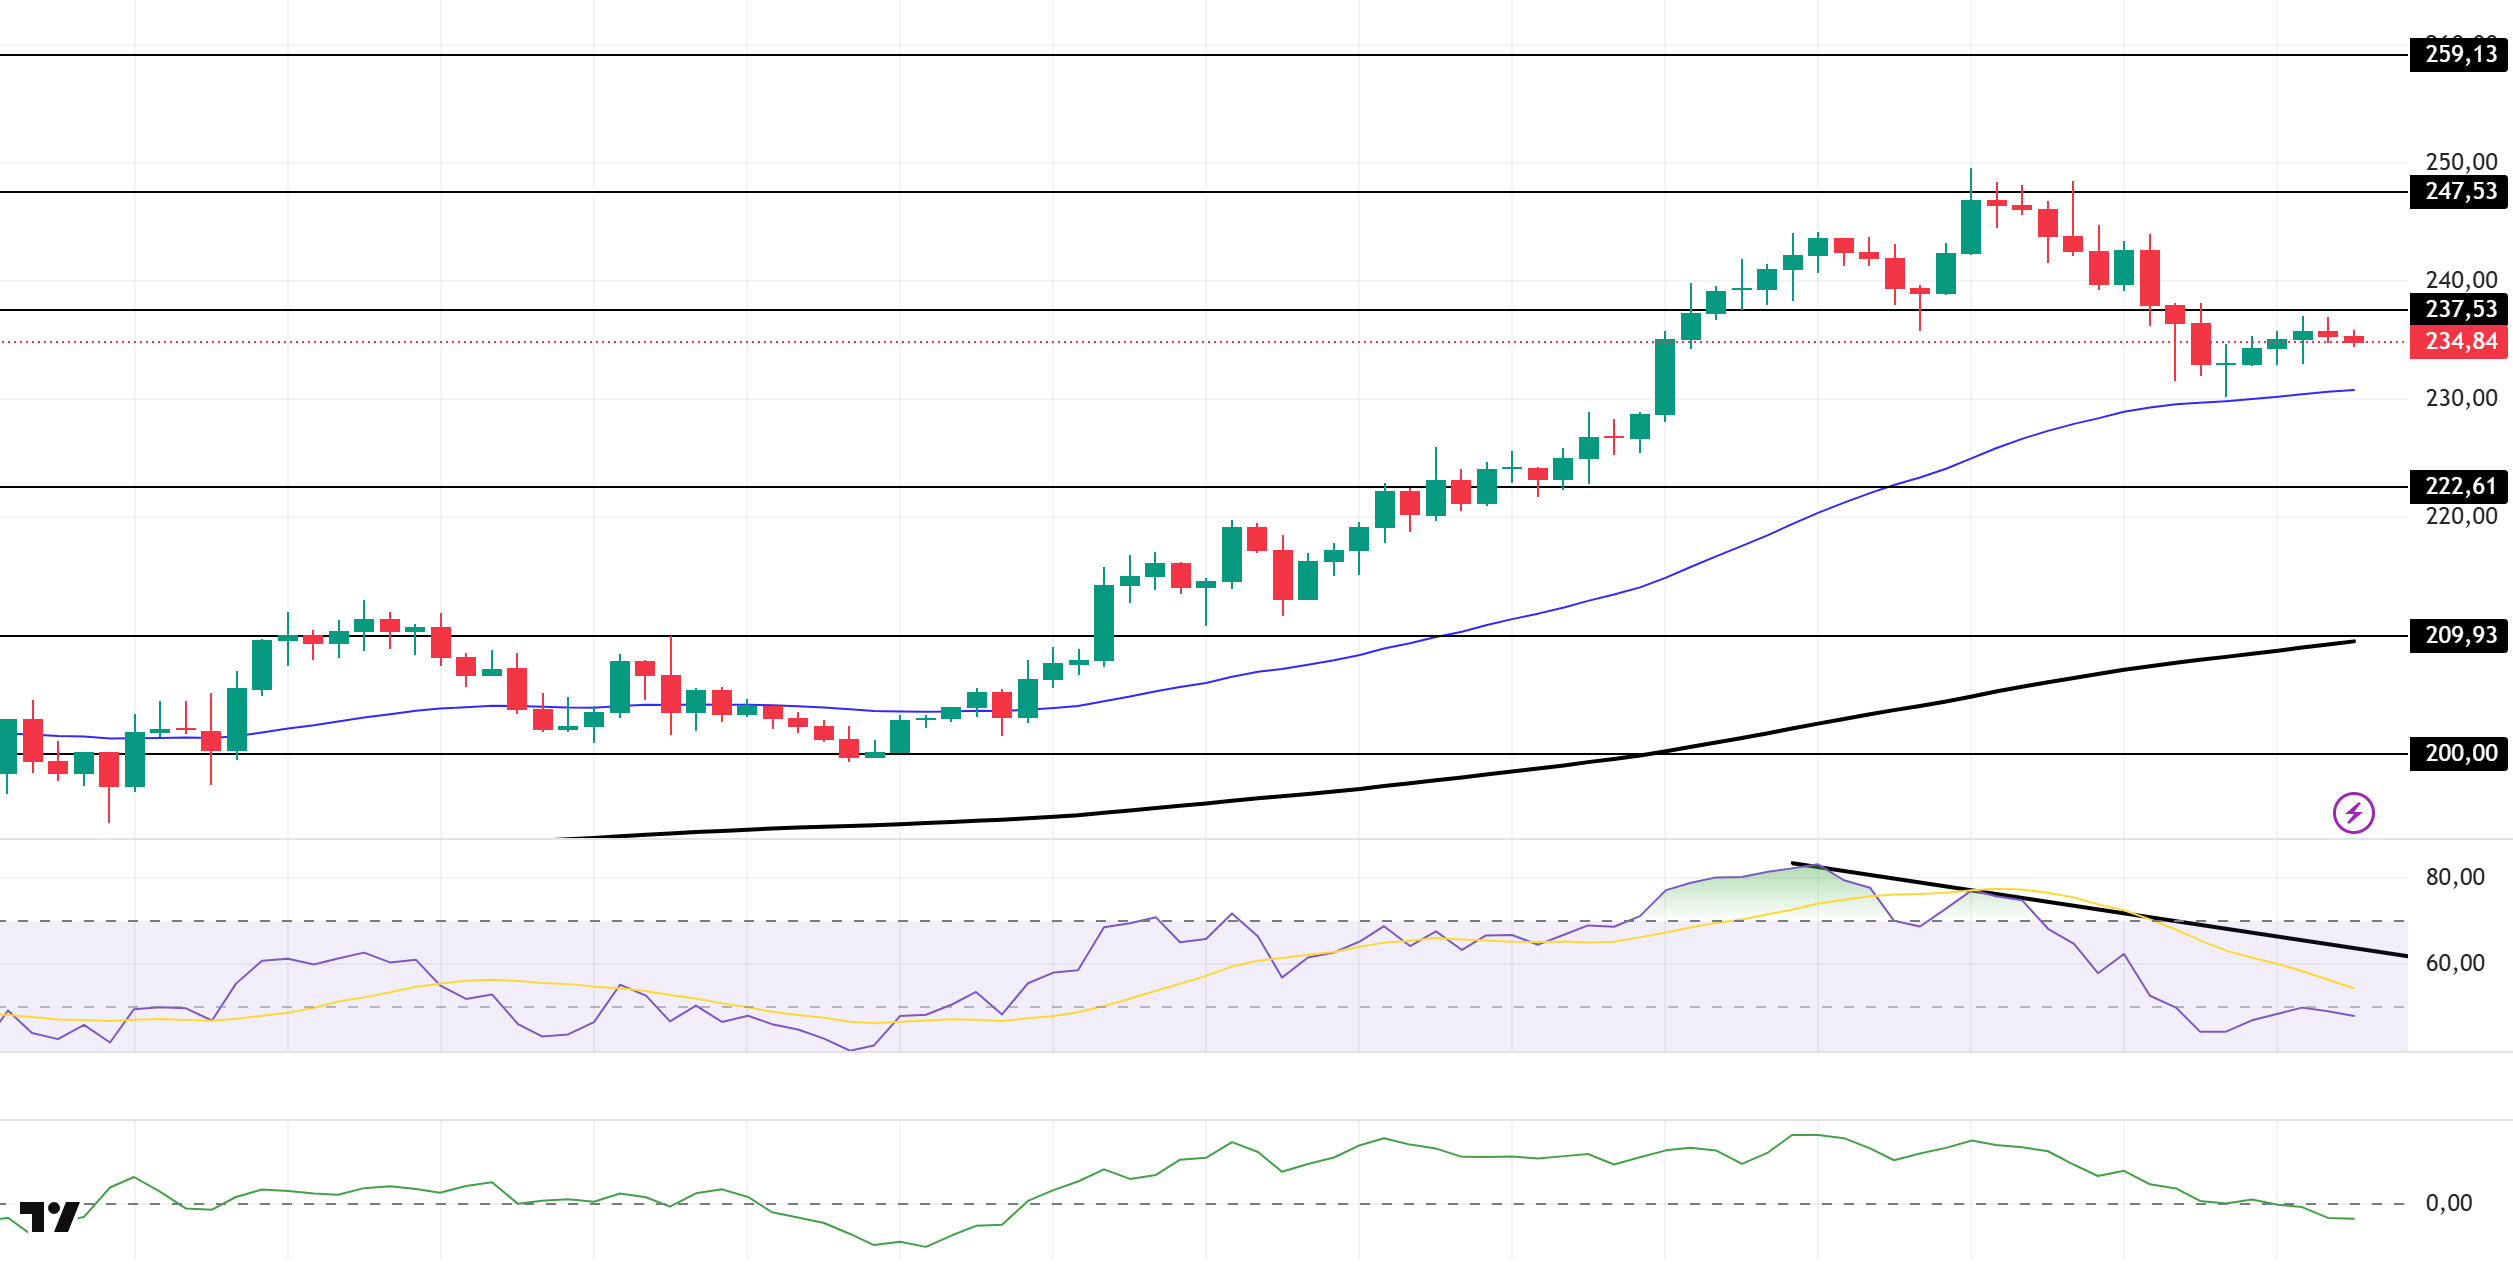
The SOL price traded sideways during the day. The asset tested the strong resistance level of $247.53 but failed to break through, experiencing a pullback and showing a slight increase after finding support from the 50 EMA (Exponential Moving Average – Blue Line) moving average. Currently testing the $237.53 level, the price could test the $247.53 level if it closes above this level. In pullbacks, the $222.61 level can be monitored.
On the 4-hora chart, it continued to trade above the 50 EMA (Exponential Moving Average – Blue Line) and 200 EMA (Black Line). This indicates that the medium-term upward trend may continue. At the same time, the price trading above both moving averages shows us that the market is trending upward en the short term. The large difference between the two moving averages indicates that the asset may be en a sideways or downward trend. Chaikin Money Flow (CMF-20) has fallen into negative territory. However, an increase en cash inflows could push the CMF into positive territory. The Relative Strength Index (RSI-14) has risen from the negative zone to the neutral level and is en the lower region of the downtrend that began el September 12, indicating increased selling pressure. If there is an uptrend due to macroeconomic data or positive news related to the Solana ecosystem, the $247.53 level stands out as a strong resistance point. If this level is broken upwards, the uptrend is expected to continue. If pullbacks occur due to developments en the opposite direction or profit-taking, the $222.61 level may be tested. A decline to these support levels could increase buying momentum, presenting a potential upside opportunity.
Supports: 222.61 – 209.93 – 200.00
Resistances: 237.53 – 247.53 – 259.13
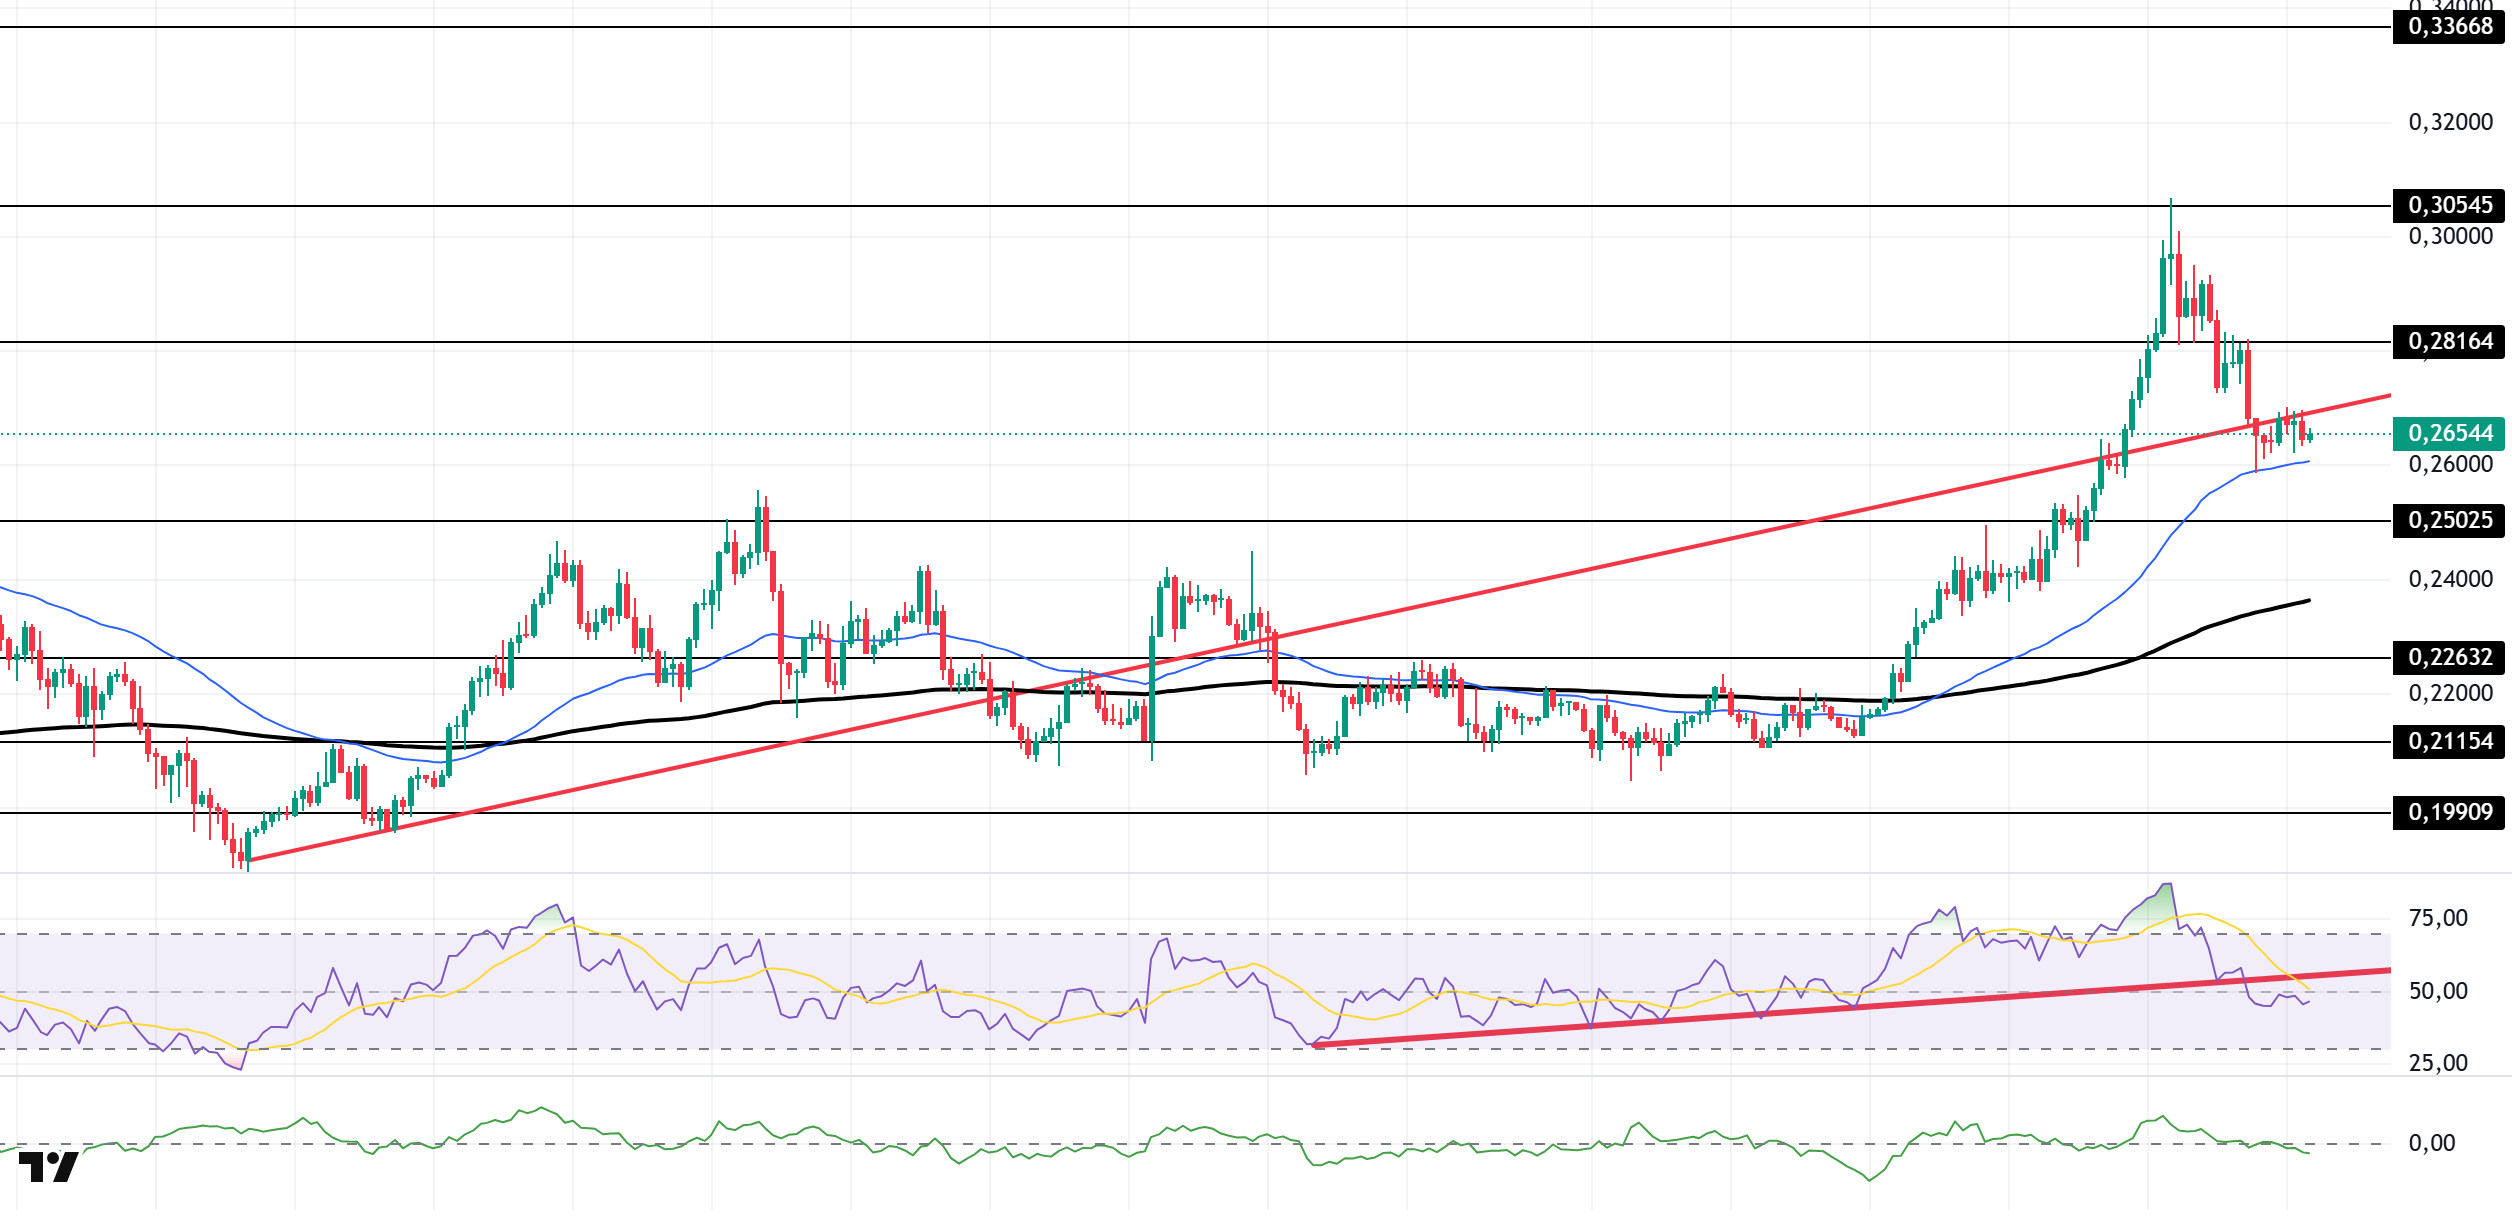
DOGE/USDT
The DOGE price continued to trade sideways during the day. The asset tested the upward trend that began el August 3 as support and broke below it, deepening its pullback. The price tested the 50 EMA (Exponential Moving Average – Blue Line) moving average as support, rose from there, and is currently testing the upward trend as resistance. It may test the $0.25025 level el candlestick closes below the 50 EMA. If it rises, the $0.28164 level may act as resistance.
On the 4-hora chart, the 50 EMA (Blue Line) remained above the 200 EMA (Black Line). This indicates that the medium-term upward trend continues. The price being above both moving averages shows that the short-term upward trend is strong. A large gap between the two moving averages may cause the asset to pull back or trade sideways. The Chaikin Money Flow (CMF-20) has retreated into negative territory. Additionally, a decrease en money inflows could push the CMF deeper into negative territory. The Relative Strength Index (RSI-14) remained en negative territory. However, it remained en the lower region of the upward trend that began el August 26. This indicated that selling pressure continued. In the event of potential increases due to political developments, macroeconomic data, or positive news flow en the DOGE ecosystem, the $0.28164 level stands out as a strong resistance zone. Conversely, en the event of negative news flow, the $0.25025 level could be triggered. A decline to these levels could increase momentum and potentially initiate a new upward wave.
Supports: $0.25025 – $0.22632 – $0.21154
Resistances: 0.28164 – 0.30545 – 0.33668
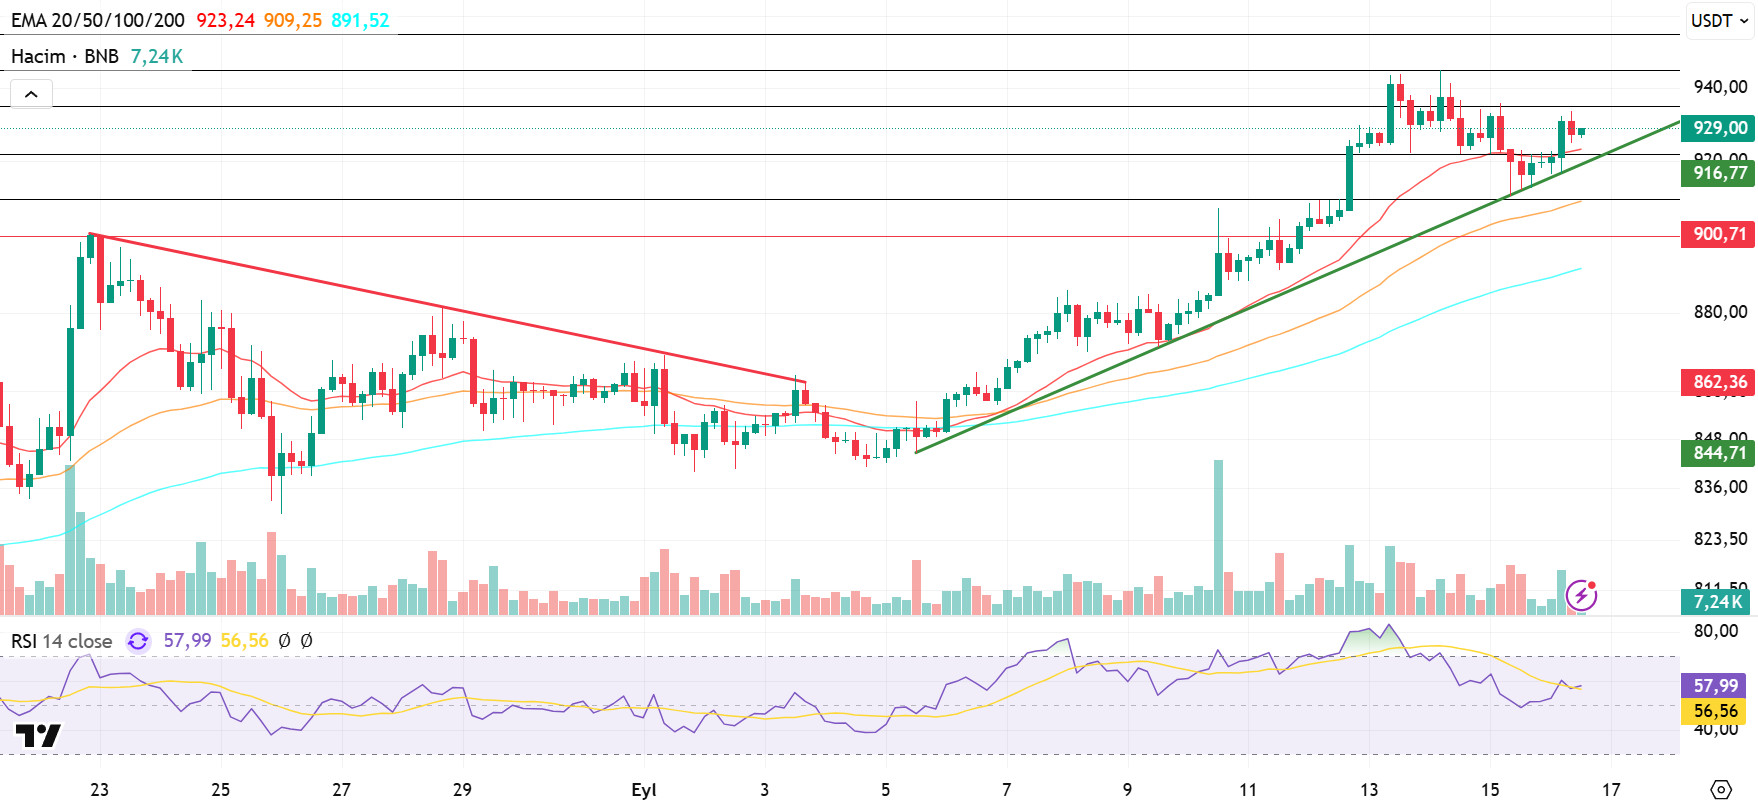
BNB/USDT
From a technical perspective, BNB/USDT entered an uptrend with strong support at the $840 level and recorded new historical highs. Accordingly, BNB, which approached the $950 level, retreated due to selling pressure from that level.
After the pullback, the price corrected to the $910 level, then confirmed its trend with support from the uptrend zone. During this process, the opening of a new candle indicated that buying appetite was maintained.
Technical indicators for BNB/USDT, currently trading en the $920–935 range, point to the possibility that the asset’s upward momentum may continue, given the recent positive changes en trading volume. Additionally, the Relative Strength Index (RSI) rose above the 70 level with the recent increases but retreated to the 50 level with the correction. The RSI then rose back to the 60 level with the subsequent buying.
Based el the current technical picture, if buying appetite is maintained, BNB is expected to test the $935 resistance level en the first stage. If this level is broken, the price could potentially move towards the $945 and $955 levels. On the other hand, if selling pressure increases, the price is likely to fall back to the $920 support level. If this level is broken downwards, the price is expected to retreat to the $910 and $900 levels.
Supports: 920 – 910 – 900
Resistances: 935 – 945 – 955
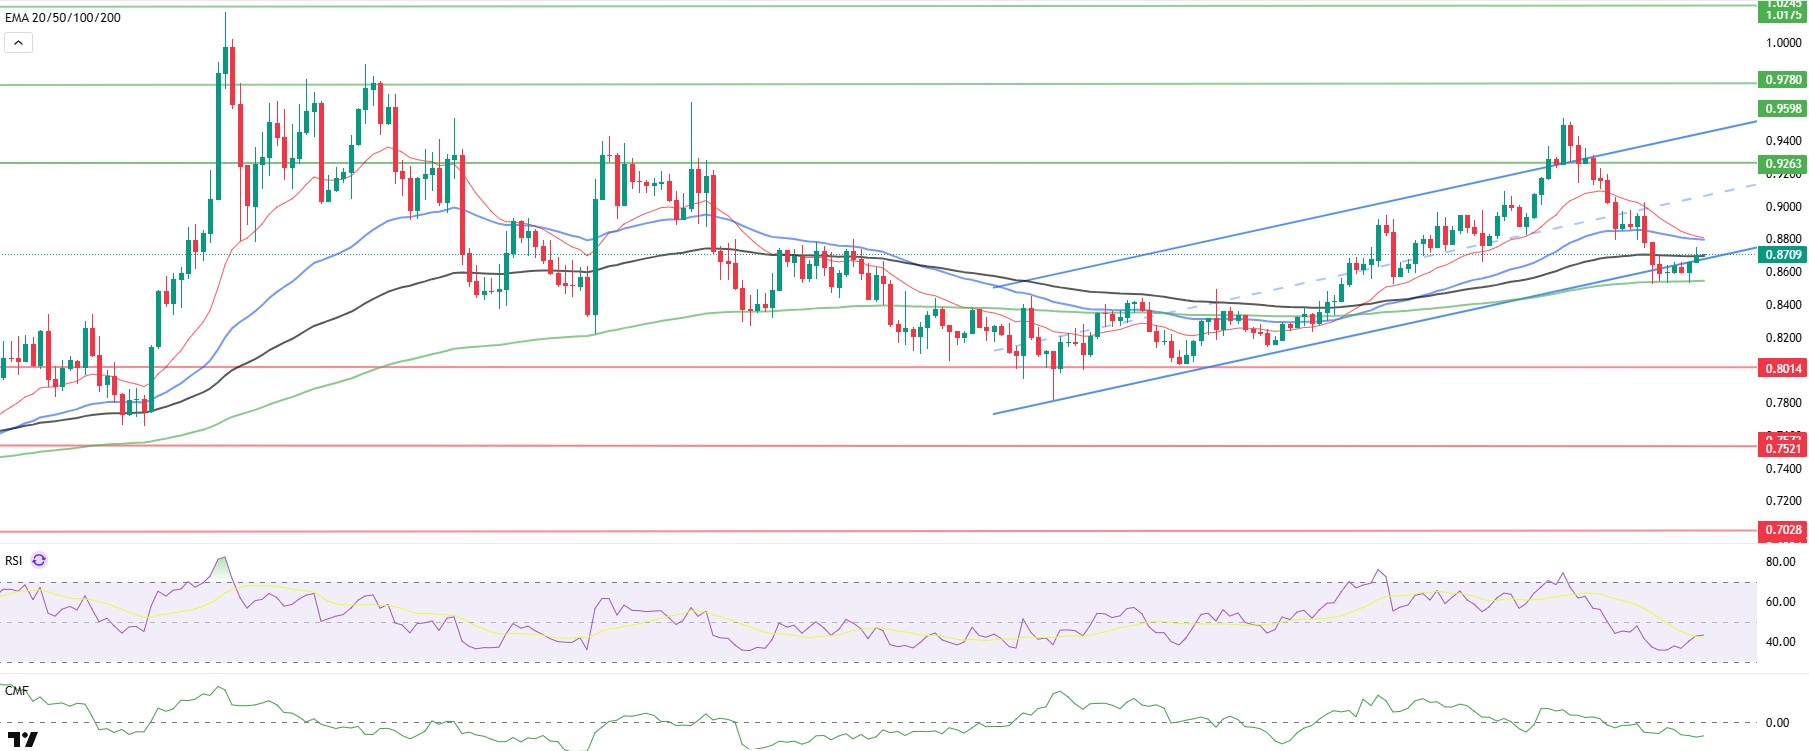
ADA/USDT
Looking at Cardano el-chain data, open positions fell por 4.6% over the past 24 horas to $1.74 billion, reflecting reduced risk as the price retreated. At the same time, futures trading volume rose por approximately 9.5% to $2.62 billion, indicating that investors are adjusting their positions rather than exiting entirely.
The ADA price re-entered the rising channel during the day, testing the $0.8650 level and breaking above it. The 20-day Exponential Moving Average (EMA 20 – Red Line) and (EMA 50 – Blue Line) closing above the price is significant for the continuation of the uptrend. As these two averages prepare to intersect el the 4-hora chart, the price continues to move below the 100-day Exponential Moving Average (EMA 100 – Black Line).
Technically speaking, el the 4-hora chart, if the ADA price closes above $0.8900, it could first target $0.9500, and if the momentum continues, the $1.0245 level could be our first resistance level en the wide range. The Relative Strength Index (RSI) has risen to 43 levels, starting to move away from the oversold zone, while the Chaikin Money Flow (CMF-20) has fallen to -0.12 levels, indicating that the selling potential continues. The decrease en cash inflows may keep the CMF en negative territory, and the negative signal from both indicators could herald a bearish effect. If macroeconomic data is released this week or positive news emerges regarding the Cardano ecosystem, the $0.9500 level could emerge as our strong resistance point. If the decline begins, the $0.8075 level will be the key support level we monitor.
Supports: 0.8075 – 0.7380 – 0.7170
Resistances: 1.1943 – 1.0245 – 0.9500
Legal Notice
The investment information, comments, and recommendations contained herein do not constitute investment advice. Investment advisory services are provided individually por authorized institutions taking into account the risk and return preferences of individuals. The comments and recommendations contained herein are of a general nature. These recommendations may not be suitable for your financial situation and risk and return preferences. Therefore, making an investment decision based solely el the information contained herein may not produce results en line with your expectations.


